Planner DynoSim Benchmarking

Drive the planner in the simulation loop against a saved trace to evaluate SLA behavior and scaling decisions
View as Markdown

This guide shows how to benchmark the Dynamo Planner against a recorded trace by running it inside DynoSim. Use it to compare agg vs disagg topologies, tune SLA targets, and study how deployment realities (engine startup time, worker counts) affect planner behavior — all without bringing up a live cluster.

For the general mechanics of DynoSim runs (input format, arrival speedup, router modes, synthetic workloads), see DynoSim Runs. This guide focuses on the --planner-config path.

1. Setup

Build

Install the Dynamo Python components and build the Rust runtime bindings. The python -m dynamo.replay CLI is part of the Python components, and it imports the runtime _core module from the bindings package:

$.venv/bin/maturin develop --release -m lib/bindings/python/Cargo.toml
$uv pip install -e .

The --release flag is strongly recommended. DynoSim execution is largely single-threaded and CPU-bound on the mocker engine core; a debug build can be 5–10× slower, which compounds across sweep runs.

Key Planner Config Knobs

Passed as JSON via --planner-config. Uses the same schema as the live planner. The fields most relevant to benchmarking:

FieldPurpose
mode"agg" or "disagg" — picks scaling strategy and required engine args.
optimization_target"sla" uses TTFT/ITL targets; "throughput" uses static queue/KV thresholds.
ttft_ms / itl_msSLA targets in ms. Drives load-scaling decisions.
enable_throughput_scalingPeriodic scaling based on predicted steady-state load.
enable_load_scalingReactive scaling to short-term traffic spikes.
throughput_adjustment_interval_secondsSeconds between throughput-scaling decisions.
load_adjustment_interval_secondsSeconds between load-scaling decisions. Short intervals mean faster reaction but more flapping.
pre_deployment_sweeping_mode"rapid" uses AIC for optional bootstrap data and native perf-model identity; "none" lets planner warm from native AIC or live FPMs.
prefill_engine_num_gpu / decode_engine_num_gpuGPUs per engine replica. Must be set explicitly — both default to None, and the simulation adapter silently treats None as 0, which collapses the cumulative-GPU-hours metric in the report to zero.
speculative_nextnManual speculative-decode depth fallback. Replay normally supplies this from engine args, but the planner config fallback is useful when engine metadata is absent.
report_filenameOutput HTML filename under ./planner_reports/.

Key Engine Arg Knobs

Passed as JSON via --extra-engine-args (agg) or --prefill-engine-args / --decode-engine-args (disagg). DynoSim uses the mocker engine, so “engine args” means the analytical perf model inputs:

FieldPurpose
aic_backendBackend the analytical model should emulate, e.g. "vllm", "trtllm", "sglang".
aic_systemGPU SKU for the perf model, e.g. "h200_sxm", "h100_sxm", "b200".
aic_model_pathHF model identifier used by the perf model.
aic_tp_sizeTensor-parallel size of each engine replica.
aic_nextnSpeculative-decode depth for AIC-backed MTP runs. In disagg, put this on the decode engine args.
aic_nextn_accept_ratesConditional draft-token accept rates used by the mocker burst sampler, for example "1,1" with aic_nextn=2 accepts up to three visible tokens per decode forward.
startup_timeSimulated seconds between a planner scale-up decision and the new worker becoming active. Unset or 0 means workers activate instantly.

Other fields follow the standard mocker engine protocol (see DynoSim Runs).

Planner Traffic Metrics From Replay

Planner-in-the-loop replay feeds the same traffic shape that the live planner consumes, but the observation source is the offline simulator instead of Prometheus. On planner traffic ticks, replay drains:

Replay metricPlanner meaning
num_reqCompleted requests in the observation window.
avg_isl / avg_oslRaw request input and output lengths. avg_osl is not divided by speculative decode accept length.
avg_kv_hit_rateMean router prefix-cache hit rate at admission time, computed as the arithmetic mean of per-request overlap_blocks / isl_blocks.
avg_accept_lengthMean visible output tokens per decode request-forward, including the base token. Agg records the decode portion of the mixed engine pass; disagg records decode workers only.

The planner treats KV hit rate and accept length as runtime metadata with last-value semantics. Missing accept-length samples leave the last valid value unchanged; without MTP metadata or without a prior valid sample, the effective accept length is 1.0. When MTP is enabled, the planner clamps accept length to [1.0, nextn + 1.0], where nextn comes from replay engine capabilities (aic_nextn) or the speculative_nextn planner fallback.

MTP changes decode capacity by discounting ITL, not by rewriting raw OSL. Accept length can be slightly below nextn + 1 when the final decode burst is partial; for example, nextn=2 with all draft tokens accepted over OSL=64 gives 64 / 22 = 2.91. With decode batch size 16 and raw per-forward wall time 40 ms:

CaseAccept lengthEffective ITLEngine RPS
No MTP1.040.0 ms16 / (64 * 0.040) = 6.25
MTP2.9140 / 2.91 = 13.7 ms16 / (64 * 0.0137) = 18.2

The raw 64 output tokens still feed KV residency, context-length estimates, and request length. In agg capacity, raw OSL remains the request output length, but accept length also tightens the prefill/decode balance because faster decode egress requires more prefill admissions per forward. Decode ITL SLA checks and decode RPS use the discounted ITL.

For AIC-backed MTP replay, set aic_nextn on the agg engine args or on the disagg decode engine args, and set aic_nextn_accept_rates to control the mocker burst sampler. The planner bootstrap path asks AIC for raw forward iteration time with zero accept rates internally, so the regression is trained on undiscounted wall time and the planner applies the observed replay accept length exactly once.

2. Example: Agg vs Disagg On The Mooncake Agentic Trace

Download the trace:

$mkdir -p traces/mooncake_fast25 && cd traces/mooncake_fast25
$curl -sLO https://raw.githubusercontent.com/kvcache-ai/Mooncake/main/FAST25-release/traces/toolagent_trace.jsonl

Run agg (2 workers, TP=1):

$.venv/bin/python -m dynamo.replay traces/mooncake_fast25/toolagent_trace.jsonl \
> --planner-config '{
> "mode": "agg",
> "optimization_target": "sla",
> "ttft_ms": 1500, "itl_ms": 50,
> "enable_throughput_scaling": true, "enable_load_scaling": true,
> "pre_deployment_sweeping_mode": "rapid",
> "throughput_adjustment_interval_seconds": 300, "load_adjustment_interval_seconds": 10,
> "prefill_engine_num_gpu": 1, "decode_engine_num_gpu": 1,
> "report_filename": "dynosim_agg.html"
> }' \
> --extra-engine-args '{"aic_backend": "vllm", "aic_system": "h200_sxm", "aic_model_path": "nvidia/Llama-3.1-8B-Instruct-FP8", "aic_tp_size": 1}' \
> --num-workers 2 --arrival-speedup-ratio 1.0

Run disagg (1P1D, TP=1):

$.venv/bin/python -m dynamo.replay traces/mooncake_fast25/toolagent_trace.jsonl \
> --planner-config '{
> "mode": "disagg",
> "optimization_target": "sla",
> "ttft_ms": 1500, "itl_ms": 50,
> "enable_throughput_scaling": true, "enable_load_scaling": true,
> "pre_deployment_sweeping_mode": "rapid",
> "throughput_adjustment_interval_seconds": 300, "load_adjustment_interval_seconds": 10,
> "prefill_engine_num_gpu": 1, "decode_engine_num_gpu": 1,
> "report_filename": "dynosim_disagg.html"
> }' \
> --prefill-engine-args '{"aic_backend": "vllm", "aic_system": "h200_sxm", "aic_model_path": "nvidia/Llama-3.1-8B-Instruct-FP8", "aic_tp_size": 1}' \
> --decode-engine-args '{"aic_backend": "vllm", "aic_system": "h200_sxm", "aic_model_path": "nvidia/Llama-3.1-8B-Instruct-FP8", "aic_tp_size": 1}' \
> --num-prefill-workers 1 --num-decode-workers 1 --arrival-speedup-ratio 1.0

Each run prints the AIPerf summary table to stdout and writes an HTML diagnostics report to ./planner_reports/<report_filename>. For this trace with a long ISL and short OSL, agg is better than disagg, which gets slightly better ITL at the cost noticeably more GPU-hours.

3. Example: Cold-Start-Time Sweep

How sensitive is SLA attainment to engine startup time? Sweep startup_time from 0 to 300 seconds in 10-second steps and record TTFT/ITL/GPU-hours per run.

$#!/usr/bin/env bash
$set -euo pipefail
$
$TRACE=traces/mooncake_fast25/toolagent_trace.jsonl
$OUT=planner_reports/sweep_startup
$mkdir -p "$OUT"
$
$run_one() {
> local s=$1
> local name=$(printf "dynosim_agg_startup_%03d.html" "$s")
> local extra
> if [[ "$s" -eq 0 ]]; then
> extra='{"aic_backend":"vllm","aic_system":"h200_sxm","aic_model_path":"nvidia/Llama-3.1-8B-Instruct-FP8","aic_tp_size":1}'
> else
> extra=$(printf '{"aic_backend":"vllm","aic_system":"h200_sxm","aic_model_path":"nvidia/Llama-3.1-8B-Instruct-FP8","aic_tp_size":1,"startup_time":%d}' "$s")
> fi
> .venv/bin/python -m dynamo.replay "$TRACE" \
> --planner-config "$(printf '{"mode":"agg","optimization_target":"sla","ttft_ms":1500,"itl_ms":50,"enable_throughput_scaling":true,"enable_load_scaling":true,"pre_deployment_sweeping_mode":"rapid","throughput_adjustment_interval_seconds":300,"load_adjustment_interval_seconds":10,"prefill_engine_num_gpu":1,"decode_engine_num_gpu":1,"report_filename":"%s"}' "$name")" \
> --extra-engine-args "$extra" \
> --num-workers 2 --arrival-speedup-ratio 1.0 \
> --report-json "$OUT/startup_$(printf '%03d' "$s").json" \
> >"$OUT/startup_$(printf '%03d' "$s").log" 2>&1
>}
$
$export -f run_one
$# Run 12 sweeps in parallel; adjust -P for your machine.
$seq 0 10 300 | xargs -n1 -P12 -I{} bash -c 'run_one "$@"' _ {}

Each run emits the AIPerf metrics table (parse TTFT / ITL avg / p90) and its HTML report (grep GPU hours: <float>). Plotting those against startup_time gives:

Planner DynoSim — startup time sweep

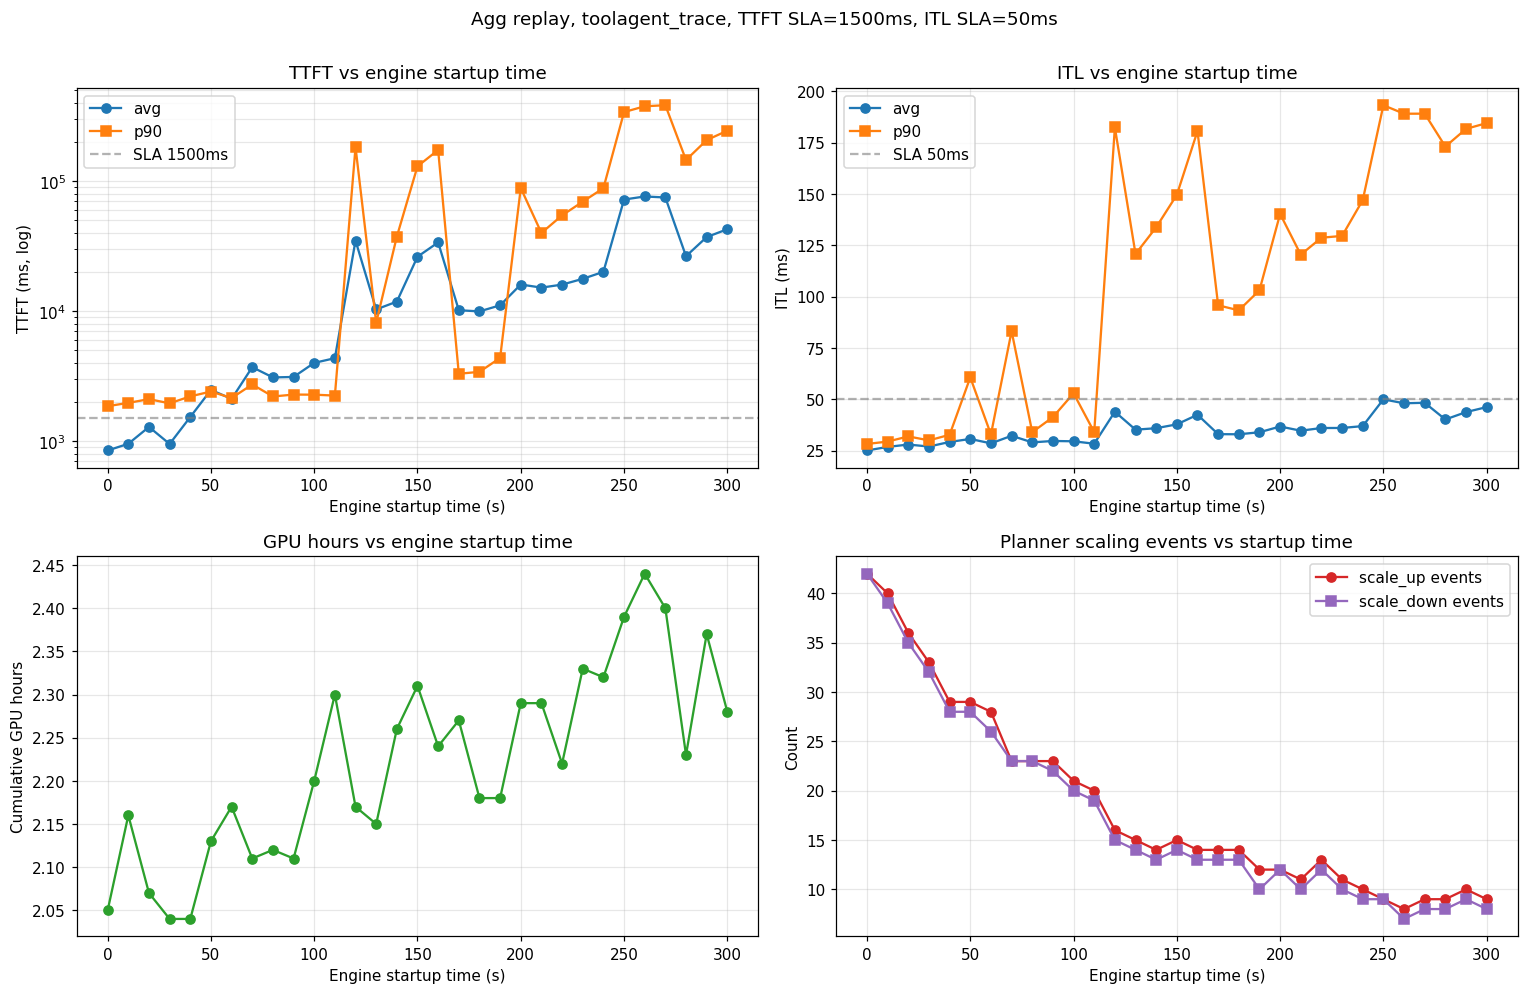
Observations from this sweep (agg, TTFT SLA 1,500 ms, ITL SLA 50 ms, H200-SXM, Llama-3.1-8B-FP8, TP=1):

  • SLA cliff near 100–120 s. Below that, the planner scales up fast enough to hold TTFT; above it, p99 TTFT diverges and the system stays perpetually backlogged.
  • Scaling-event count drops monotonically (42 → 8) as startup grows — long-startup runs require load planner to wait for stabilization before the next scaling decision.
  • ITL is less sensitive than TTFT until the queue saturates. Below the cliff, ITL rises modestly (25 → 30 ms avg); above it, p90 ITL jumps to ~200 ms as decode requests starve.