

Help! My Instance/Subnet/VPC is stuck in a certain state
A common issue that is observed in sites managed by NVIDIA Infra Controller (NICo) is that objects do not move into the desired state - even after a user waits for a long amount of time.
Examples of these problems are:
- Instances are not getting provisioned (are stuck in
Provisioningstate) - Instances are not getting released (are stuck in
Terminatingstate) - Subnets (Network Segments) are not getting provisioned or released
- The Machine Discovery process stops in a certain state (for example,
Host/WaitingForNetworkConfig)
This runbook explains how operators can troubleshoot why an object doesn’t advance into the next state.
Step 1: Is it a Cloud or Site problem?
The state of NICo objects is tracked and advanced in 2 different systems:
- The cloud backend, which stores the states that are shown by the NGC console and web UI.
- The actual NICo site, which manages the lifecycle of each object inside the site.
If the state of an object doesn’t advance, there might be multiple reasons for it:
- The state of the object isn’t advanced on the actual NICo site
- The request to change the state of the object is not forwarded from the cloud to the NICo site. Or the notification about the state changed was not forwarded from the NICo site to the cloud.
A rule of thumb for locating the source of the problem is:
- If the states that are shown on the site and via the Cloud API are different, reason 1 above applies. This indicates a communication issue in the paths between the cloud backend, site agent and NICo site controller.
- If the states match, then the state on the site isn’t advanced as required.
The next chapters will describe on how to lookup the state of an object on the actual site and how to determine what prevents the object from moving into the next state on the site.
1.1 Checking the state in the web UI or API
Another initial check on whether the problem is a cloud or site problem is to check whether the cloud backend could actually send the state change request (such as an instance release request) to the site.
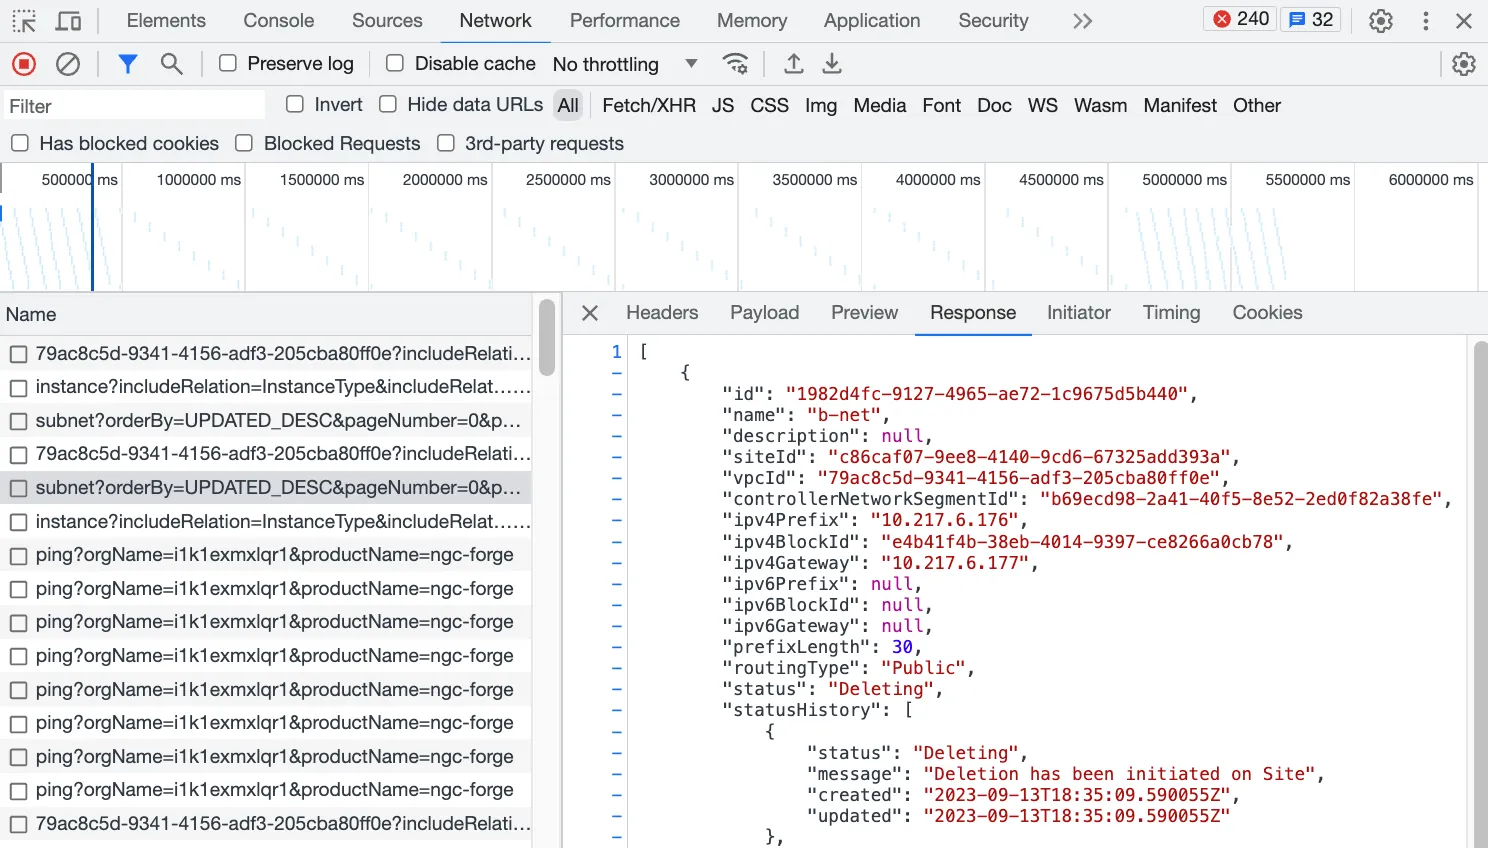
The statusHistory field on the cloud API can be helpful for this assessment. For example, the history for the following Subnet indicates that the deletion request was sent to the site, but deletion might be stuck there:
In this example, we can see the cloud backend indicated it transferred the deletion request to the site. In this case, we should continue the investigation by checking the site state for this subnet.
If you are using the web UI, not all API details like statusHistory
are displayed. However we can work around this by getting
access to the raw cloud API response. A browser’s developer tools can be used for this:
- On the page that shows the status of the object (such as “Virtual Private Clouds”), open the browser developer tools. The F12 key opens it on many browsers.
- Click the Network Tab.
- Either wait for a request that fetches the state of the object of interest (such as
subnetorinstance), or refresh the page to force a request. - Select the relevant request in the Network panel.
- Click the
Responsetab.
You should now see the raw cloud API response, as shown in the following screenshot:
Step 2: Determine the actual state an object is in
The web UI only shows a simplified state for users, like
- Provisioning
- Ready
- Deleting
However NICo sites use much more fine grained states, like
Assigned/BootingWithDiscoveryImage. The / in this notion separates
the main state of an object from its substate(s). In this example, Assigned
is the main state of an object and BootingWithDiscoveryImage is the substate.
In order to understand why the state of an object doesn’t advanced, we first need to determine the full state. This can be done using multiple approaches:
2.1 Using nico-admin-cli
You can inspect the detailed state of an object on NICo sites using nico-admin-cli. Refer to nico-admin-cli for instructions on how to use it.
Using nico-admin-cli, you can inspect the state of an object with commands like the following:
You can observe the detailed state of the ManagedHosts in the state field.
It is Assigned/BootingWithDiscoveryImage in this example. The machine show
command will also list the history of states - including timestamps when the
ManagedHost entered a certain state.
For NetworkSegments, you can use the network-segment subcommand:
2.2 Using the NICo dashboard
In order to get a first impression of whether an object might be stuck in a state and why, you can use the NICo Grafana Dashboard.
On the Dashboard, search for the graph which shows the amount of objects in a certain state. For example, for ManagedHosts/Instances, check “ManagedHost States”. The graph might look like:
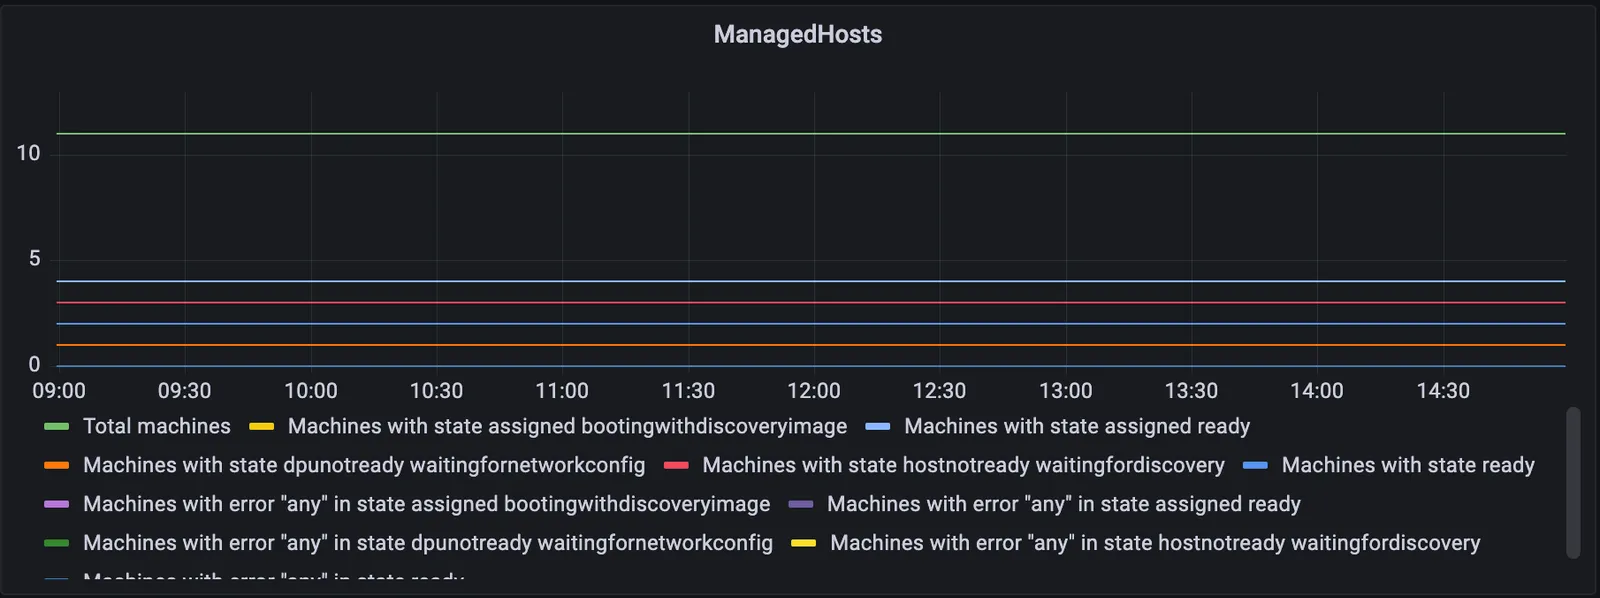
In this diagram we can observe ManagedHosts in various transient states
(like assigned bootingwithdiscoverimage or dpunotready waitingfornetworkconfig)
for multiple hours. Thereby we can assume those objects are stuck in this
state, and that operator intervention is required to make them advance state.
The dashboard will not tell us which ManagedHost is exactly stuck. But if only one ManagedHost is in a stuck state, we can deduct that this might be the ManagedHost a user is concerned about.
For other objects whose lifecycle is controlled by NICo - such as Subnets, Network Segments or Infiniband Partitions - a similar diagram will exist.
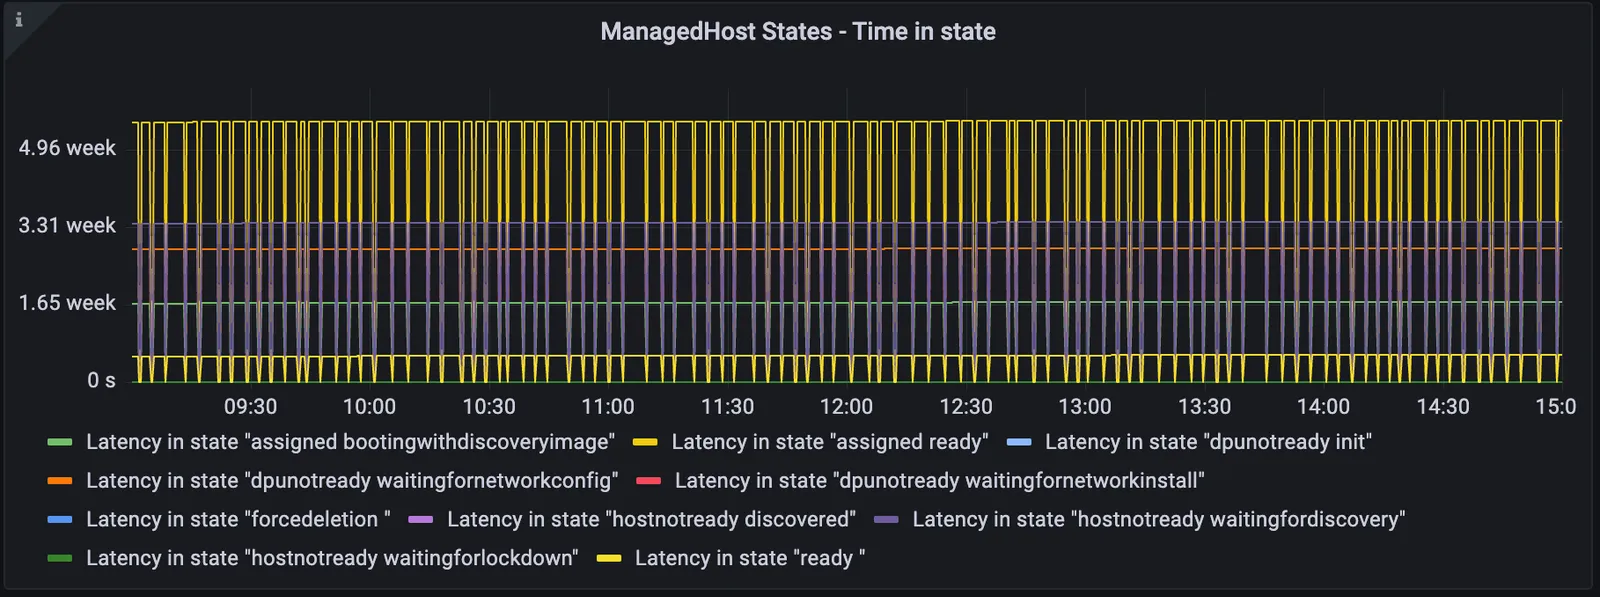
Another diagram you can look at is the “Time in state” chart that exists
for each object type. It shows the average time objects have stayed in a
particular state. Any metrics on this graph that indicate that there exist
objects in transient states for more than 30-60 Minutes indicate that those
objects are stuck. In the following example for ManagedHosts we can observe that
the average time ManagedHosts had been in the assigned bootingwithdiscoveryimage
state is 1.65 weeks. This equals to 1 ManagedHost being stuck in the state for
this long, or that there exist multiple ManagedHosts in the state and one is stuck
for even longer.
Step 3: Determine why an objects state does not advance on the Site
After we know the actual state of the object, we need to determine why it doesn’t advance into the next state.
3.1 What is required to move into the next state?
A good first step to assess why the state doesn’t change is to determine what would actually need to happen in order to perform a state transition. The best documentation for these state changes is the actual state machine source code, which codifies the conditions for moving out of each state. Use the following links to look at the state machines for objects managed by NICo:
crates/api/src/state_controller/machine/handler.rs— ManagedHost State Machine (also used for the lifecycle of instances)crates/api/src/state_controller/network_segment/handler.rs— NetworkSegment/Subnet State Machinecrates/api/src/state_controller/ib_partition/handler.rs— Infiniband Partition State Machine
When looking at these files, consider that the software version deployed
on the NICo site you are investigating might not match the latest main
version of those state machines. You might then want to look at the version
of the file which matches the version (git commit hash) of the actual site.
The handle_object_state function in these files will be called for each
object whose lifecycle is controlled by NICo in periodic intervals. The
default period is 30s - but it could be changed in future NICo updates.
This means that if the state of an object could not be advanced within one iteration of this function, it will automatically be retried 30s later.
Inside the handle_object_state function, you will find a branch that
indicates what needs to happen in order to move the object into the next state.
For example, for the Assigned/BootingWithDiscoveryImage state that was detected
above, we can find the following logic:
This snippet of code describes that the condition for moving out of the state
is that we detected that the Host had been rebooted. It also describes that once
the reboot is detected, we will move on into the Assigned/SwitchToAdminNetwork
state.
Inspecting the rebooted function further will tell us that checks that the last_reboot_time timestamp
is more recent than the time when we entered the state. And checking even
further for where the last_reboot_time is updated, we would learn that
it happens when nico-scout is started and asks the nico-api server
via the NicoAgentControl API call for instructions.
Therefore we can determine that possible sources of the ManagedHost being stuck are:
- The Host is never rebooted
- The Host is rebooted, but does not boot into the discovery image
- The Host is rebooted and boots into the discovery image, but
nico-scoutis not running or might not be able to reach the API server.
We can now continue troubleshooting by inspecting which of these steps might have failed.
3.2 Learning more about failures from logs
Sometimes we can easily learn from nico-api logs why the state transition for a certain object failed. If a state machine tries to advance the state of an object and any function within the state machine returns an error, the error will be logged.
For example the following nico-api logs show us that the state-machine tried to advance
the state of ManagedHost fm100htbj4teuomt9p8095cg3nikudaqq69uih6t3gg61tpgkkmtncvjbgg
from state Assigned/WaitingForNetworkConfig, but due to a vault issue we failed
to load the BMC credentials for the reboot request that is required to exit the state:
As seen from the example above, the field error_types can also provide
a quick overview on what errors have occurred in certain states and
prevented the state machine to advance the state of objects.
indicates that for ManagedHosts in state Assigned/WaitingForNetworkConfig, state handling
for 1 ManagedHost encountered a redfish_client_creation_error. The consequence of
this is that the reboot request for the Host could not be dispatched.
Such an error will show up every 30s. The state transition will happen once
the credentials can be loaded and the reboot request gets dispatched.
In order to avoid having to manually look at each log line, try to filter the
logs by machine_id, segment_id or instance_id. If you find any recent
log line about any action which affected the state of the object, search also
for the span_id in this log line. It will show all log messages that have
been emitted as part of the same RPC request or the same state handler iteration.
3.3 Learning more about failures from the NICo Grafana Dashboard
The NICo Grafana Dashboard can also provide a quick overview of why state transitions have failed. In case the state handler of a certain object returned an error, the error type will also be shown in the diagram that summarizes the number of objects in a certain state for each NICo site.
In the following example, we can see state handling for 1 ManagedHost in the state assigned waitingfornetworkconfig failing due to a redfish_client_creation_error. This is equivalent to the information that we found in logs.
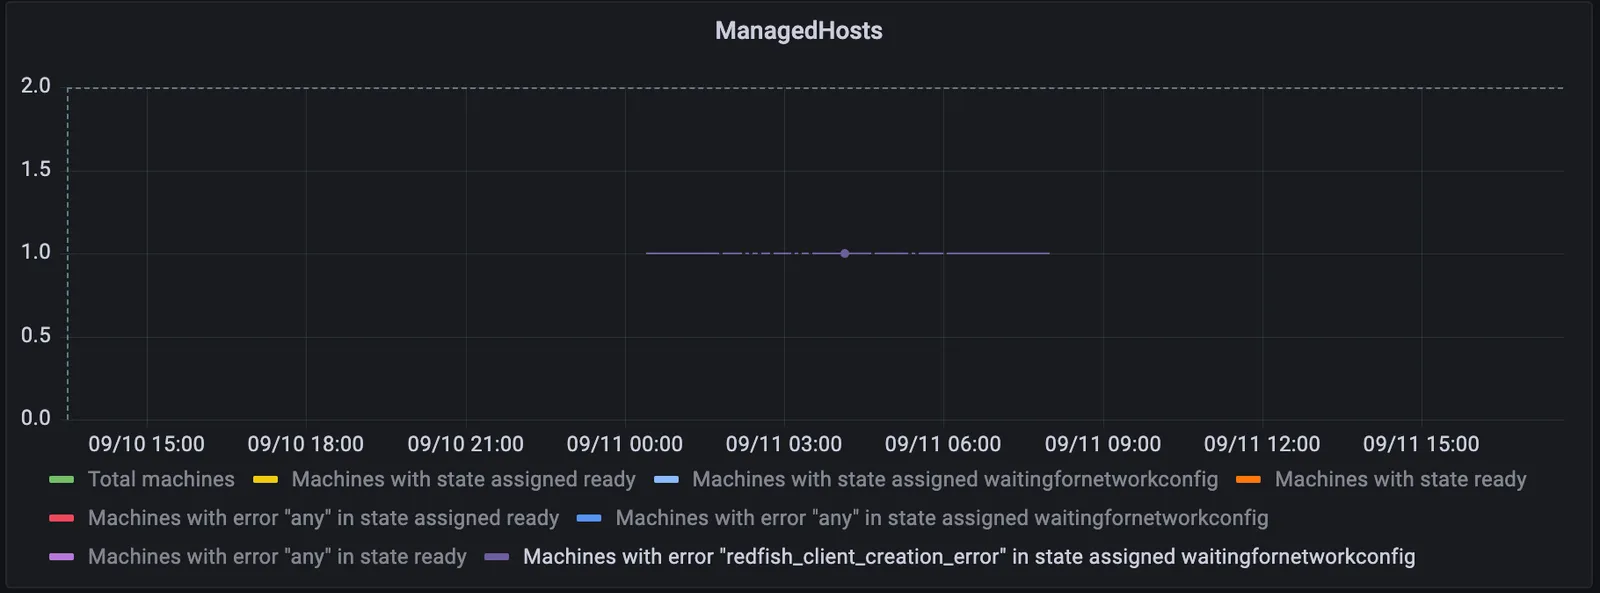
The benefit of the dashboard is that it allows for a very quick assessment on what the root cause of a certain issue is. It also shows whether just 1 object is affected by a certain issue, or whether multiple objects are affected.