SID Visualization Example#
Prerequisites#
To run the demo, you will need the following:
Docker
docker-compose-plugin(Tested with version 2.12.2)
Setup#
To run this demo, ensure all submodules are checked out:
git submodule update --init --recursive
Build Morpheus Dev Container#
Before launching the demo, we need the docker container for Morpheus to be created:
export DOCKER_IMAGE_TAG="sid-viz"
./docker/build_container_dev.sh
Launch User Interface#
We will use docker-compose to build and run the entire demo. To launch everything, run the following from the repo root:
Save the Morpheus repo directory:
export MORPHEUS_ROOT=$(git rev-parse --show-toplevel)
Ensure the data has been downloaded:
git lfs install
./scripts/fetch_data.py fetch examples
Change to the example directory:
cd ${MORPHEUS_ROOT}/examples/sid_visualization
Launch the containers:
DOCKER_BUILDKIT=1 docker compose up --build -d
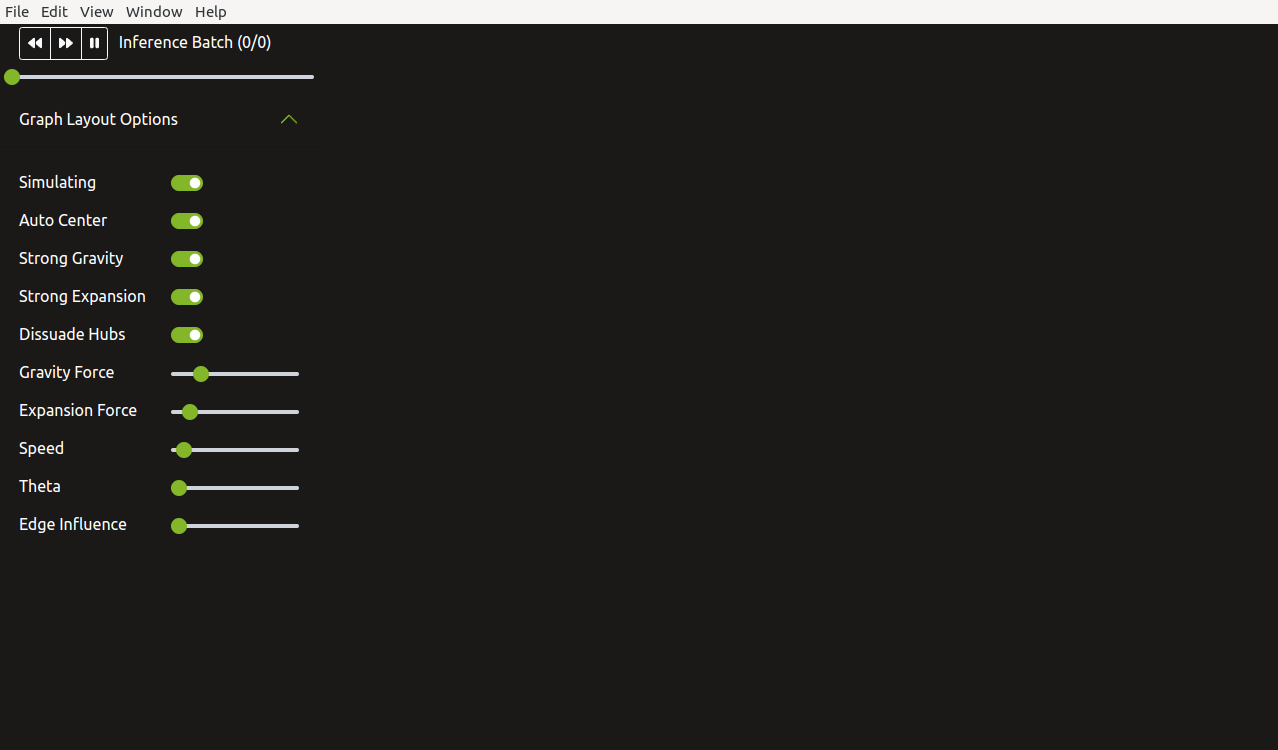
The following GUI should be displayed when all containers have completed launching:
Build Morpheus#
Once docker compose command has completed and GUI is displayed, exec into the container to build and run Morpheus:
Exec into the Morpheus container:
docker compose exec morpheus bash
Inside the container, compile Morpheus:
BUILD_DIR=build-docker ./scripts/compile.sh
Verify Morpheus is installed:
morpheus --version
Keep this shell in the Morpheus Dev container running. It will be used later to start Morpheus.
Running the Demo#
Running Morpheus#
After the GUI has been launched, Morpheus now needs to be started. In the same shell used to build Morpheus (the one running the Morpheus Dev container), run the following:
python examples/sid_visualization/run.py \
  --debug \
  --triton_server_url=triton:8000 \
  --input_file=./examples/data/sid_visualization/group1-benign-2nodes.jsonlines \
  --input_file=./examples/data/sid_visualization/group2-benign-50nodes.jsonlines \
  --input_file=./examples/data/sid_visualization/group3-si-50nodes.jsonlines \
  --input_file=./examples/data/sid_visualization/group4-benign-49nodes.jsonlines
Note: The first run of this script will take a few minutes to allow Triton to convert the deployed ONNX model to TensorRT. Subsequent runs will not include this conversion step so will be much quicker.
This launch will use all of the available datasets. Each dataset will show up as one batch in the visualization. Here is a description of each dataset:
examples/data/sid_visualization/group1-benign-2nodes.jsonlinesSmall scale with 2 nodes, no SID
examples/data/sid_visualization/group2-benign-50nodes.jsonlinesScale up to 50 nodes, no SID
examples/data/sid_visualization/group3-si-50nodes.jsonlines50 nodes, with SID from a single node
examples/data/sid_visualization/group4-benign-49nodes.jsonlinesIsolate bad node leaving 49 nodes, no SID
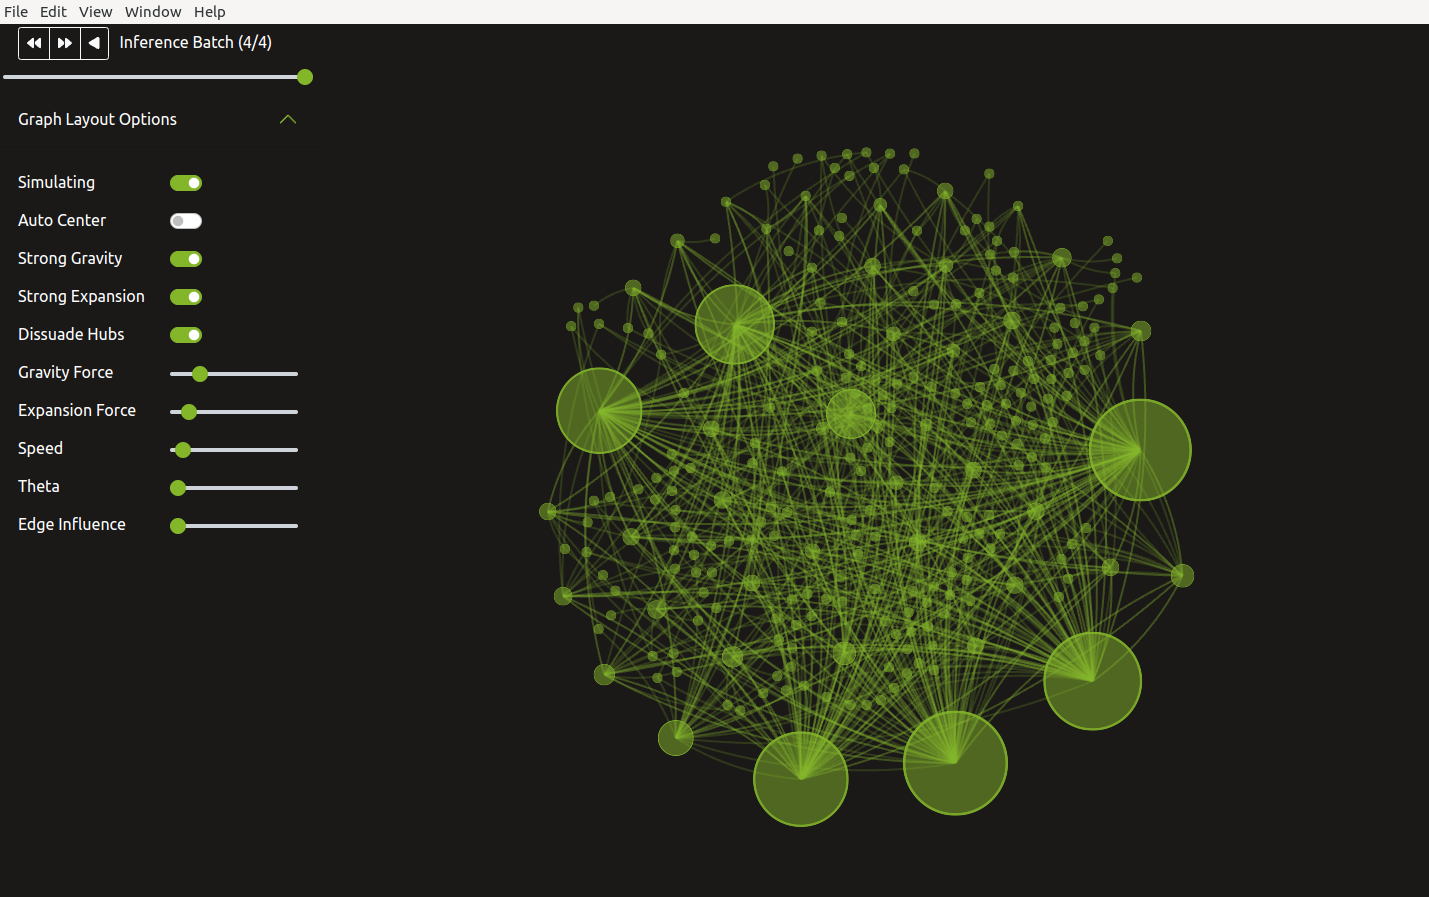
The following is a screenshot after all four batches have been processed:
Use the slider or the following buttons to step through the inferences batches in the visualization:
|
Step to previous inference batch |
|
Step to next inference batch |
|
Step through all inference batches from beginning |
|
Pause animation |


The visualization on the right shows nodes in the current inference batch represented as
green spheres. White (benign) and red (SI) packets are shown flowing between the node connections.
While the animation is running, you can click the pause button or toggle off Simulating. Once paused,
you will be able to hover over an individual packet to view its contents.
Changing the dataset does not require relaunching the GUI. Simply re-run Morpheus with the new dataset and the GUI will be updated.
It’s also possible to launch the demo using the Morpheus CLI using the following:
DEMO_DATASET="examples/data/sid_visualization/group1-benign-2nodes.jsonlines"
morpheus --log_level=DEBUG \
   run --pipeline_batch_size=1024 --model_max_batch_size=32 --edge_buffer_size=4  \
      pipeline-nlp --model_seq_length=256 \
         from-file --filename=${DEMO_DATASET} \
         deserialize \
         preprocess --vocab_hash_file=data/bert-base-uncased-hash.txt --truncation=True --do_lower_case=True --add_special_tokens=False \
         inf-triton --model_name=sid-minibert-onnx --server_url=triton:8001 --force_convert_inputs=True \
         monitor --description Inference\ Rate --unit=inf \
         add-class \
         gen-viz
Note, this launch method is more useful for showing performance than showing capability.