After a Process is Connected#
After a process is connected, it is ready to be analyzed. For many activities, a default set of windows will come up that offer an impactful set of tools for analysis that pertains to the activity. You can also add additional windows to the application by selecting a view from the menu bar. See the “User Interface Reference” section for each activity for a detailed discussion of each view and tool window for that activity.
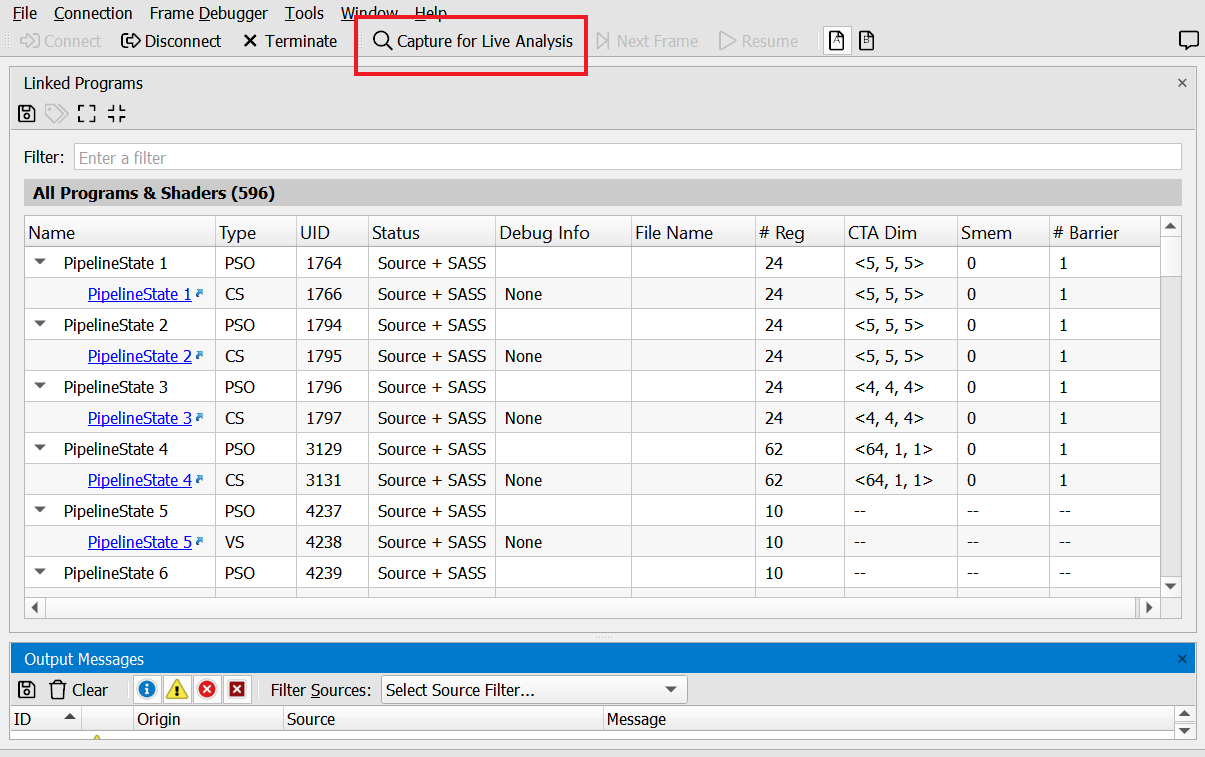
For the Frame Debugger activity that was started above, there are both live analysis and capture utilities. When capturing from this activity, done though the Target application capture hotkey or “Capture for Live Analysis,” a number of views will open. On the target application, the HUD will appear with the toolbar and scrubber. This UI allows you to view an exhaustive amount of information on the state, resources, and synchronization of your application.
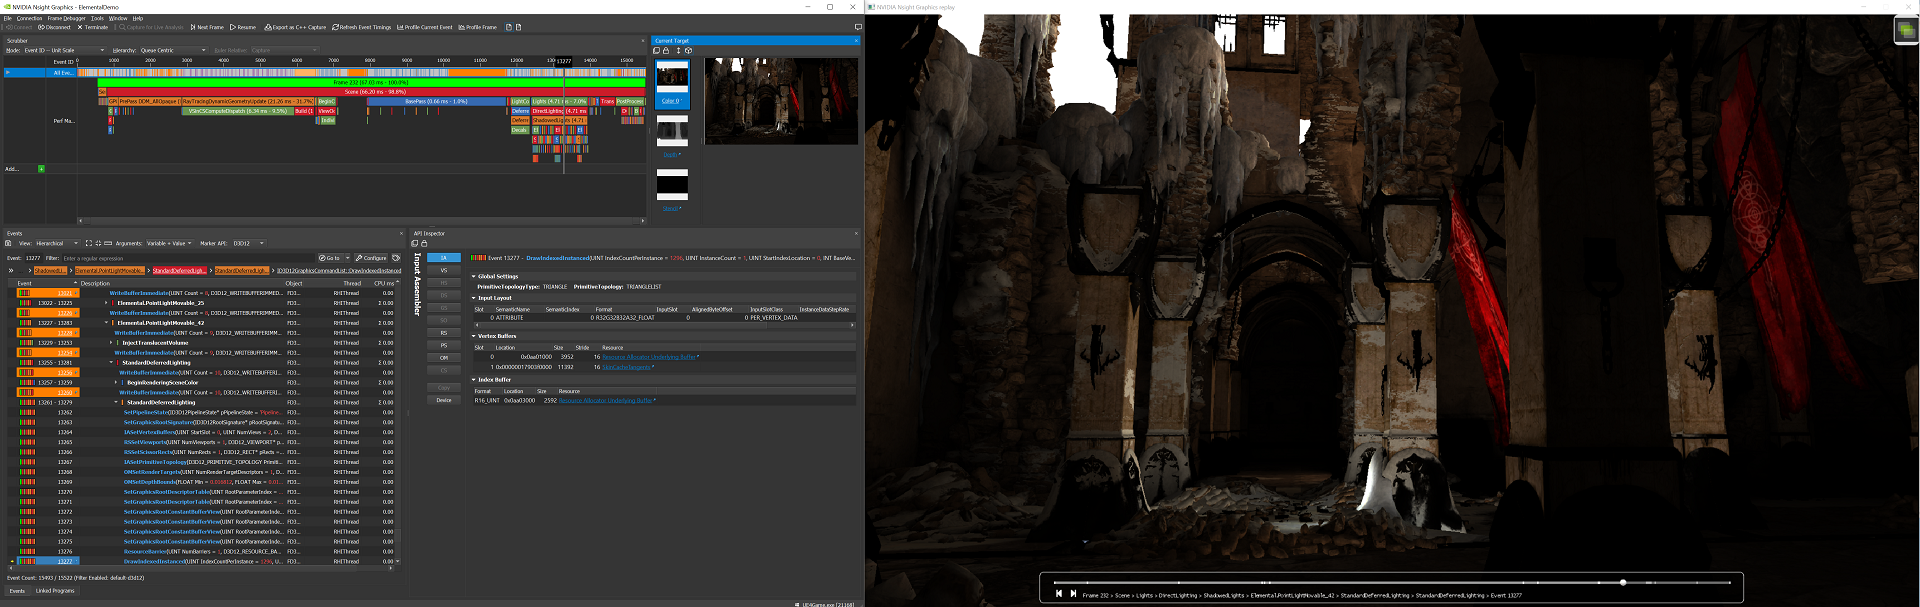
With such an expansive set of information available, debugging a rendering problem is made easier.
Choose Window To Debug#
If your application has multiple windows, each with a graphics context, you can choose the window that you want to focus your debugging and profiling efforts on. For instance, if your application has 3 different windows, each with its own view of the scene, you can easily select the window of interest to capture. When multiple windows are detected, there will be a new “Select Window” control on the top toolbar. The combo box to the right will be populated with the detected windows, including the window name and size to aid in determing the correct window.
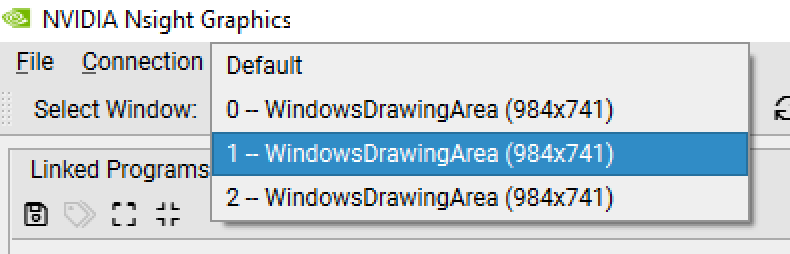
Any time that you are not currently in an active Capture/Replay, you can use the control to specify the window to capture. If you select “Default,” the most recent window to present the back buffer will be selected as the window to capture. This option is available with the Frame Debugger and Generate C++ Capture activities.
Target application capture hotkey#
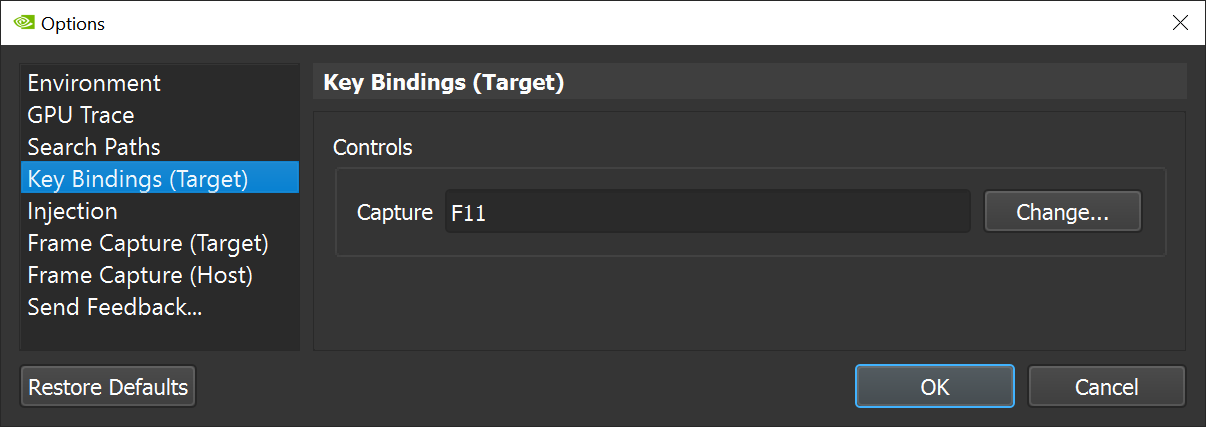
Activities support triggering capture from the Nsight Graphics UI or directly from the target application. The default capture hotkey is F11. This may be configured also in Tools > Options.