GPU Crash Dump Monitor#
GPU Crash Dump Monitor Settings#
To configure the NVIDIA Nsight Aftermath Monitor settings, left-click the NVIDIA Nsight Aftermath Monitor icon in the Microsoft Windows system notification area (system tray) or right-click the icon and select the Settings option from the pop-up menu.
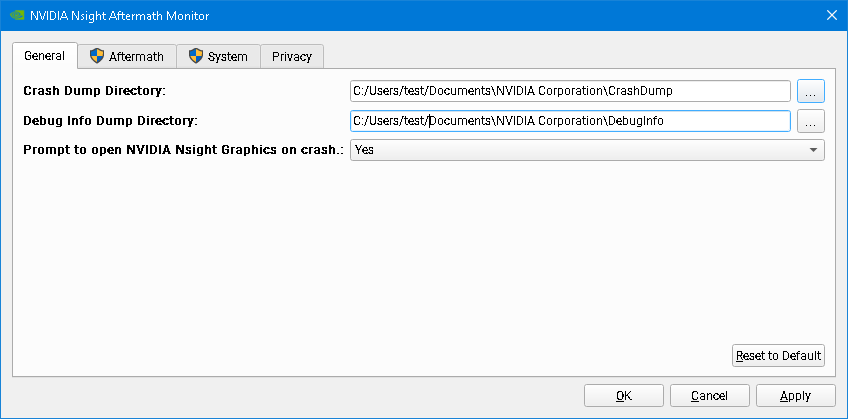
General Settings#
The General Settings page allows to configure the directory where GPU crash dumps are stored, the directory where NVIDIA shader debug information files are stored, and whether the NVIDIA Nsight Aftermath Monitor should prompt to open new crash dumps in Nsight Graphics.
Aftermath Settings#
The Aftermath Settings page allows you to configure various options that control Nsight Aftermath graphics driver features and allows you to select for which applications GPU crash dumps are captured.
Note
On Windows, modifying Aftermath graphics driver settings requires Windows Administrator privileges. Therefore, when any of these settings are modified and applied, a User Account Control confirmation window may pop-up asking for permission to modify system settings.
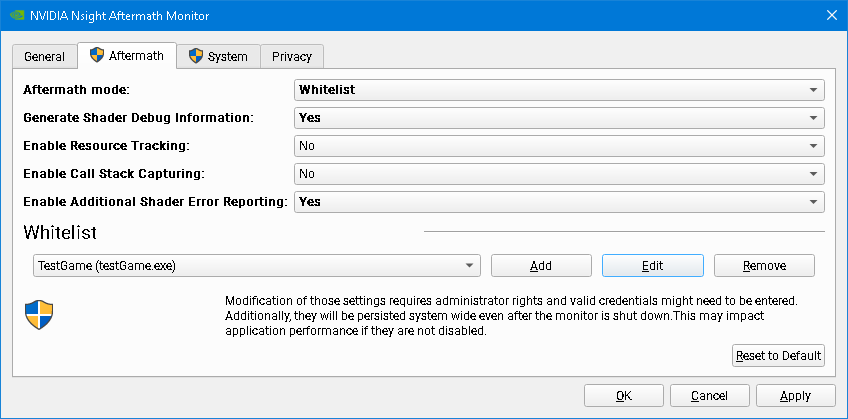
Supported Aftermath Modes are the following:
Disabled disables all GPU crash dump creation.
Global enables crash dump creation for all applications using the D3D11/D3D12 or Vulkan APIs.
Whitelist allows you to limit the GPU crash dump creation to a specific set of applications on the whitelist.
Generate Shader Debug Information enables the generation of shader debug information (line tables for mapping from the shader IL passed to the NVIDIA graphics driver to the shader microcode executed by the GPU) for all shaders loaded by the applications for which Aftermath crash dump creation is enabled.
The GPU Crash Dump Monitor stores the debug information into files with the .nvdbg extension in the Debug Info Dump Directory configured in the General Settings Tab.
The shader debug information is required for mapping shader microcode instructions of active or faulted shader warps to shader IL or shader source lines. Shader debug information is identified by a unique shader debug infromation identifier embedded into the crash dump file.
See also the section about Source Shader Debug Information for details on how to compile shader source with source-level debug information.
Note
Enabling this setting causes additional compilation overhead for generating the debug information and general driver overhead for handling the debug information during shader compilation.
Enable Resource Tracking enables driver side tracking of live and recently destroyed resources (textures, buffers, etc.) that are used to augment the GPU fault information in crash dumps.
This allows Aftermath to identify resources related to GPU virtual addresses seen in the case of a crash due to a GPU page fault. The resource information being tracked includes details about the size of the resource, its format, and the current deletion status of the resource object. D3D12 developers may also consider instrumenting their application using the GFSDK_Aftermath_DX12_RegisterResource function to register the D3D12 resources the application creates. That allows Aftermath to track additional information, such as the resources’ debug names set by the application. For Vulkan applications, the resources’ debug names set via vkSetDebugUtilsObjectNameEXT are also captured. For more detail on how to instrument an application with the Nsight Aftermath SDK, see the Nsight Aftermath SDK documentation.
Note
Enabling this feature causes additional driver overhead for tracking resource information.
Enable Call Stack Capturing enables the automatic generation of Aftermath event markers for tracking the origin of all draw calls, compute and ray tracing dispatches, ray tracing acceleration structure build operations, or resource copies initiated by the application. This data can augment the data collected via Aftermath user markers.
The automatic event markers are added into the command stream right after the corresponding commands with the CPU call stacks of the functions recording the commands as the marker data payloads.
Note
Enabling this feature causes considerable driver overhead for gathering the necessary information.
Note
When this feature is enabled, the GPU crash dump file may contain the file path for the crashing application’s executable as well as the file paths for all DLLs or DSOs it has loaded.
Enable Additional Shader Error Reporting puts the GPU in a special mode that allows the GPU to report additional runtime shader errors. This may provide additional information when debugging GPU hangs, GPU crashes, or unexpected behavior related to shader execution.
Enabling this feature may result in additional crash dumps reporting issues in shaders that exhibit undefined behavior or have hidden bugs, which so far went unnoticed because by default the hardware silently ignores them. The additional error checks that are enabled when using this option cause GPU exceptions for the following situations:
Accessing memory using misaligned addresses, such as reading or writing a byte address that is not a multiple of the access size.
Accessing memory out-of-bounds, such as reading or writing beyond the declared bounds of (group) shared or thread local memory or reading from an out-of-bounds constant buffer address.
Accessing a texture with incompatible format or memory layout.
Hitting call stack limits.
Note
This feature is only supported with NVIDIA graphics driver R515 or later.
System Settings#
The System Settings page contains the systemwide Enable SM Register Data Collection setting. On Linux, the collection of SM registers is always enabled so the System Settings page won’t be present in the monitor. On Windows, the collection of SM registers is always enabled on R550 and later drivers, so the controls for SM register collection is disabled and grayed out.
Note
On Windows, modifying Aftermath system settings requires Windows Administrator privileges. Therefore, when any of these settings are modified and applied, a User Account Control confirmation window may pop up asking for permission to modify system settings.
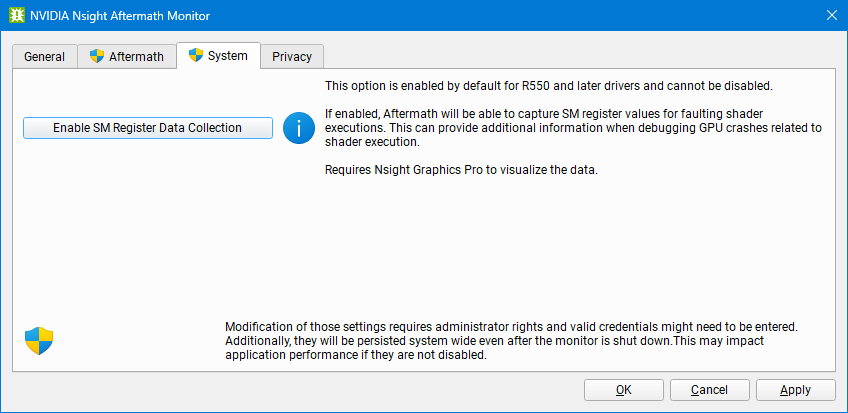
Enable SM Register Data Collection to collect SM register values when faults happen inside SMs. This can provide additional information when debugging GPU crashes related to shader execution.
Since this is a system setting, modifying it might also affect other tools such as Nsight VSE CUDA debugger and may result in unexpected behavior. On Linux, this feature is always enabled without incompability with other tools.
Note
This feature is only supported for the D3D12 and Vulkan APIs with NVIDIA graphics driver R535 or later and requires Nsight Graphics Pro to visualize the data. Register inspection of internal shaders is not supported.
Command Line Settings#
All Aftermath GPU crash dump monitor settings can also be configured through command line parameters.
The available command line flags are:
–help Print a help message with a list of the available options.
–version Print the release version of the executable.
–crashdump-dir arg Set the crash dump directory.
–debuginfo-dir arg Set the debug information dump directory.
–prompt-on-crash Prompt to open Nsight Graphics after a crash is generated.
–hostname arg The host name of the machine on which to look for already running Nsight Graphics instances.
All Aftermath settings and System settings can also be configured through a separate command line tool installed next to the crash dump monitor executable. On Windows, that command line tool is nv-aftermath-control.exe. On Linux, the tool is called nv-aftermath-control.bin.
The command line flags supported by the configuration tool are:
–mode arg Set Nsight Aftermath mode. Supported options for arg are: Disabled, Whitelist, or Global.
–whitelist arg Add application to the Nsight Aftermath whitelist. arg must be of the following form:
ApplicationName MyApp ExecutableName myApp.exe
This option can be repeated to add multiple applications to the whitelist. This option also clears a previously set up whitelist.
–debuginfo Generate NVIDIA shader debug information.
–resource-tracking Enable resource tracking.
–callstacks Enable automatic marker generation with call stack capturing.
–shader-error-reporting Enable additional shader error reporting.
–register-data-collection Enable SM register data collection. Windows only.
Note
On Windows, modifying Aftermath graphics driver settings requires Windows Administrator privileges. Therefore, when nv-aftermath-control.exe is executed, a User Account Control confirmation window may pop-up asking for permission to modify system settings.
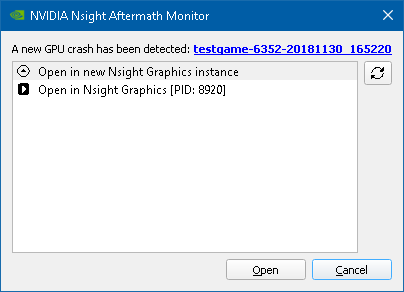
New Crash Dump Notification Dialog#
If the NVIDIA Nsight Aftermath Monitor is configured to prompt on new crash dumps, every time a new GPU crash dump file is stored to the crash dump directory, a notification dialog pops up indicating that a new GPU crash dump is available. This dialog shows the name generated for the new crash dump and also allows you to directly open it in a newly launched instance of Nsight Graphics or in an already running instance of Nsight Graphics.