App Configuration and Activity Selection UI#
Launch Tab#
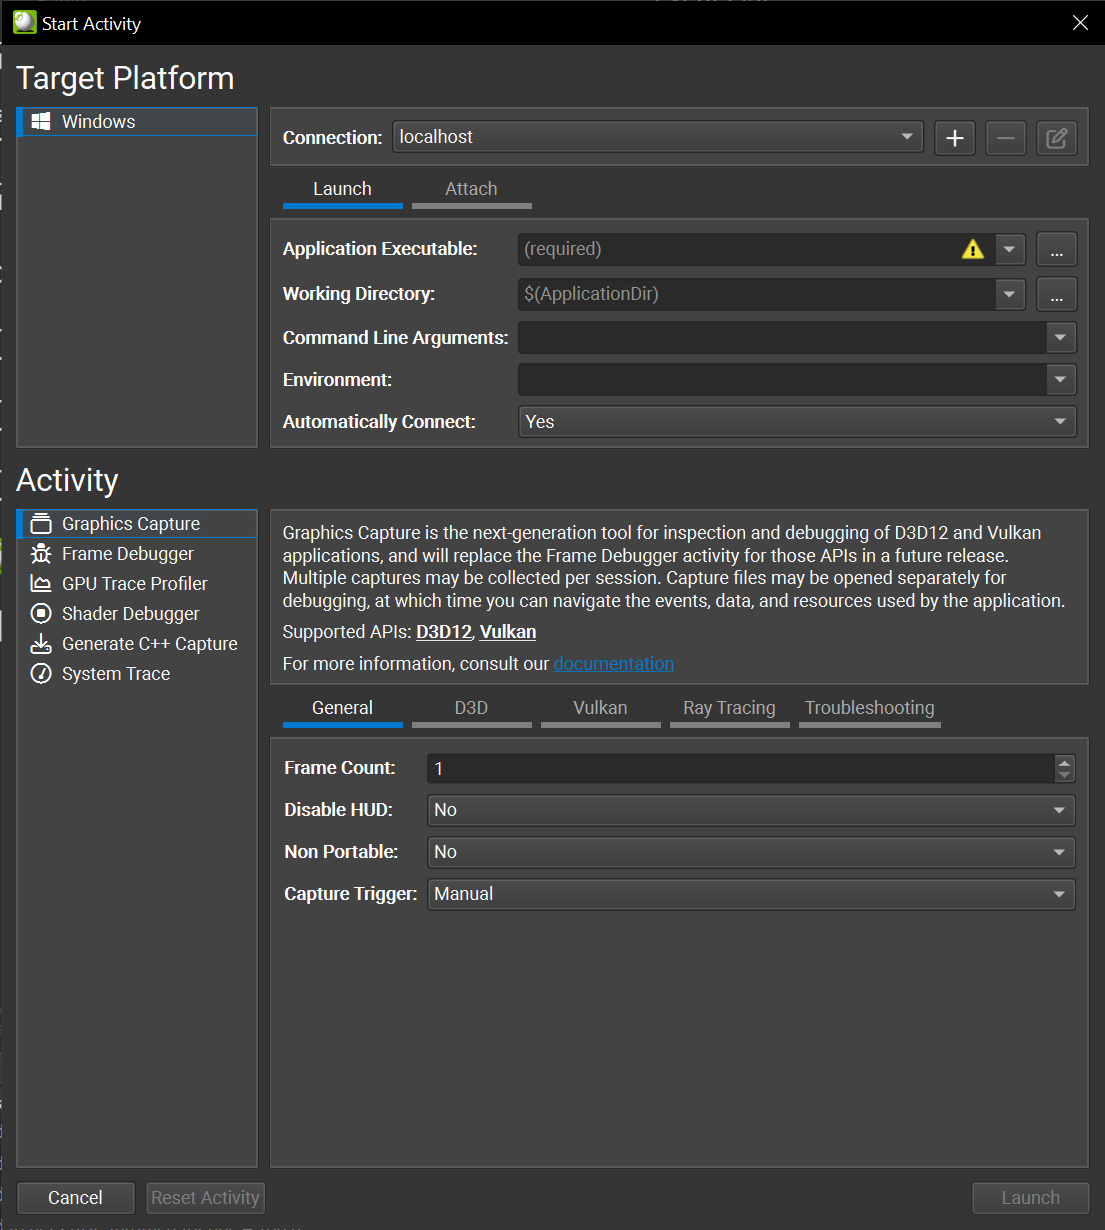
The Launch tab enables launching applications for analysis. This is where you add the basic process information to launch and subsequently connect to the application you wish to analyze.
This tab has the following controls:
Application Executable — Specifies the root application to launch. Note that this may not be the final application that you wish to analyze. Reference this field using
$(ApplicationExecutable), or its parent directory using$(ApplicationDir).Working Directory — The directory in which the application is launched. By default the working directory is set to the application directory. Reference this field using
$(WorkingDir).Command Line Arguments — Specify the arguments to pass the application executable.
Environment — The environment variables to set in the launched application.
Automatically Connect — Specifies whether the launched application should be automatically connected to. If the launched application is a launcher that creates the process that you ultimately wish to analyze, set this to ‘No.’
The following variables can be used in any of the Launch tab fields:
$(ProjectDir) — Refers to directory in which the current project is saved.
$(ApplicationExecutable) — Refers to the value in the Application Executable field.
$(ApplicationDir) — Refers to parent folder of the Application Executable.
$(WorkingDir) — Refers to the value in the Working Directory field.
Note
Several fields have a selector to allow you to cycle through recently used entries. This is a useful capability for cycling through common configurations.
Attach Tab#
To attach to an application, it must have previously been launched through the launch tab. This page will list the launched application as well as any children that the application has launched.
Note
If the host disconnects for any reason, and the target happens to still be running, you can reattach to the previously launched or even captured application by using the attach facility. The process does not have to be newly relaunched.
Activities Options#
Nsight Graphics allows for adjusting the activity with a large set of options. Options are available in the Connect window under the Additional Options section. These options are saved per-project, and per-activity, because the options for one activity may not relate to the other. Note that you may need to apply them to multiple activities if your needs for each activity are the same.
Option |
Description |
|---|---|
Capture Mode |
Select the capture mode on how to trigger a capture:
|
Enable Target HUD |
Enables the HUD on the target application, which enables:
|
Force Repaint |
Enables a periodic trigger of window invalidation, which causes applications that lazily present to repaint, such as many professional visualization applications. This is useful for providing a consistent stream of frames with which Nsight Graphics can perform its analysis. |
Option |
Description |
|---|---|
Frame Delimiter |
Select the API call used to delimit frame boundaries for OpenGL applications. This setting is useful for applications that do not necessarily present to a screen, such as offscreen rendering applications or benchmark applications. |
Option |
Description |
|---|---|
Synchronous Shader Collection |
Controls the extent of information that is collected for D3D11 shaders. Synchronous collection is necessary for some shader related statistics but may introduce increased application loading time. Synchronous collection also requires that the application has been started with administrative privileges. |
D3D12 Replay Fence Behavior |
Choose the behavior when encountering a sync point during D3D12 replay.
|
DXGI SyncInterval |
Controls the SyncInterval value passed to the DXGI Present method. The default is to disable V-Sync to allow the debugger to collect valid real-time counters. |
Enable Revision Zero Data Collection |
Controls the collection of revision zero (e.g., pre-capture) data during capture. This is potentially an expensive operation, in both memory and processing time, and some applications can replay a single frame without explicitly storing these revisions.
|
Replay Captured ExecuteIndirect Buffer |
When enabled, replays the application’s captured ExecuteIndirect buffer instead of a replay-generated buffer. Consider this option if your application has rendering issues in replay that derive from a non-deterministic ExecuteIndirect buffer; for example, one that is generated based off of atomic operations that can vary from frame-to-frame. |
Report Force-Failed Query Interfaces |
Controls whether failed query interfaces are reported to a user with a blocking message box. Nsight Graphics is an API debugger, and there may be some APIs that it does not yet support or does not yet know about. When such an interface is queried, the interception will force the failure of the operation with an E_NOINTERFACE return code. If this operation interferes with normal operation, and otherwise would result in no issues, it may be disabled for the project. |
Report Unknown Objects |
Controls whether unknown objects are reported to a user with a blocking message box. Some applications pass objects that are unknown to Nsight Graphics. These objects may be indicative of an application bug, lack of support in the product’s interception, or they may ultimately be innocuous. In many cases, such an unknown object may result in an analysis crash. To mitigate this issue, Nsight Graphics warns about this concern with a blocking message box. If this operation interferes with normal operation, and otherwise would result in no issues, it may be disabled for the project. |
Support Cached Pipeline State |
Controls whether cached pipeline state is supported. By default, Nsight Graphics will reject calls to create or load a cached pipeline state object. Setting this option to true will enable support for these objects. |
Force Minimal Shader Bind Tables |
Controls whether minimal shader bind tables are forced. By default, Nsight Graphics will create replay shader bind tables matching the size specified. in the source application. If this option is enabled, it will use the last valid, non-null record in the SBT to override the replay buffer size. This is not universally safe since indexing null records is a valid usage. |
Option |
Description |
|---|---|
Force Validation |
Force the Vulkan validation layers to be enabled. This requires the LunarG Vulkan SDK to be installed. |
Validation Layers |
Layers used when force enabling validation. This option is only visible when ‘Force Validation’ is turned on. |
Device Address C++ Support |
Enables buffer device address capture/replay support so that buffers with VK_BUFFER_USAGE_SHADER_DEVICE_ADDRESS_BIT have the same address between capture and C++ replay. Enabling this option may lead to instability due to different allocation methods used by the driver. This option is only needed to when generating C++ captures of applications that indirectly access a buffer address within a shader. |
Force Capture/Replay Device Memory |
Forces the VK_MEMORY_ALLOCATE_DEVICE_ADDRESS_BIT and VK_MEMORY_ALLOCATE_DEVICE_ADDRESS_CAPTURE_REPLAY_BIT bits to be be set on all device memory allocations. This is necessary if the application is later binding addressable buffers but incorrectly excluded the flag on the associated memory. |
Capture All Device Memory for C++ Captures |
Includes the entire contents of device memory for C++ captures, as opposed to just the bound contents. This results in larger capture but might address issues with out-of-bounds memory access. |
Enable Coherent Buffer Collection |
Controls the monitoring and collection of mapped coherent buffer updates during capture. This is potentially an expensive operation and many applications can replay a single frame without actively monitoring these changes. Use this option if your capture takes a long time but you do not straddle frames with coherent updates. |
Enable Revision Zero Data Collection |
Controls the collection of revision zero (e.g., pre-capture) data during capture. This is potentially an expensive operation, in both memory and processing time, and some applications can replay a single frame without explicitly storing these revisions.
|
Allow Unsafe pNext Values |
Allows the inspection of Vulkan structures with potentially dangerous pNext values. By default, structures with no known extensions are skipped. |
Use Safe Object Lookup |
Controls how objects are stored internally by the tool. Safe lookup are slower but may improve stability when using an unsupported extension.
|
C++ Capture Object Set |
This option controls which objects are exported as part of a Vulkan C++ capture. By default we limit the object set to only objects used in the capture but in some cases a user might want to see all objects used in the application. This typically isn’t necessary and can lead to a very large C++ project. This might also help WAR a bug where the tool incorrectly prunes an object it shouldn’t have.
|
Reserve Heap Space |
Amount of physical device heap space (MB) to automatically reserve for the frame debugger. |
Unweave Threads |
For multi-threaded applications, attempts to remove excessive context switching by grouping thread events together. May improve C++ capture replay performance of heavily threaded applications. |
Ignore DirectX/OpenGL Wrapper Libraries |
To capture an application that uses wrapper libraries atop Vulkan, for example DXVK, set this setting to ‘Yes’ to ignore the wrapper library and capture the underlying Vulkan calls. When set to ‘Auto’, Nsight Graphics will attempt to auto-detect whether wrapper libraries should be ignored. |
Enable Vulkan SC Support |
Set this setting to ‘Yes’ to launch Vulkan SC application. |
Vulkan SC Reserve Command Buffers |
For Vulkan SC applications, frame replay needs additional command buffers. The number is not fixed and must be more than the draw/dispatch count in the captured frame. It is set with a default value, you should increase it if frame capture failed. |
Option |
Description |
|---|---|
Acceleration Structure Geometry Tracking |
This option controls how geometry data is tracked for acceleration structures. There are trade-offs between performance, accuracy, and robustness of any given approach. The default setting of ‘Auto’ is most often implemented in terms of ‘Deep Geometry Copy’, which tries to match the most common application behavior whereby a deep copy is needed. For example, after building an acceleration structure, it is legal for an application to update or destroy the geometry buffers that were used in construction. In this situation, without deep copies of the original data, the tool cannot guarantee full function of the ray tracing inspector, or of C++ capture. If you know that your application does not update or destroy buffers after construction, consider a ‘Shallow Geometry Reference’ option.
|
Track Acceleration Structure Refits |
Controls whether acceleration structure refits should be tracked in addition to builds. This requires additional memory consumption but may result in a C++ capture with performance that is more representative of the original application. |
Report Shallow Report Warnings |
Controls whether warnings are issued for possible shallow reference validity issues. If an expert user knows that the original acceleration structure input data remains undisturbed they may silence warnings with this setting. |
Geometry Collection Pool |
Specifies which memory pool to collect geometry data in. Vidmem is generally more performant but may be more limited than sysmem. |
Force Ray Tracing Dimensions to Zero |
Specifies that width/height/depth dimensions should be forced to zero for ray tracing calls. This allows the acceleration structures and SBTs to be viewed without actually performing the command. This is helpful in situations where replaying the command causes a crash or device lost issue. |
Ray Tracing Validation |
Enable ray tracing validation layers. By default, the validation layers are off. You may set this option to collect 1) errors or 2) warnings and errors. Any collection information would be logged to the Output Messages window. |
Option |
Description |
|---|---|
Enable Driver Instrumentation |
Controls the enablement of capabilities that require driver support. This effectively disables:
Disabling this option is the first and best option to try if you run into capture errors as it disambiguates problems quickly given the number of subsystems it turns off. |
Collect Shader Reflection |
Controls the collection of all information reflected from shader objects. This includes source code, disassembly, input attributes, resource associations, etc. Note: dynamic shader editing is not available when this option is disabled. This option is useful if you suspect an error or incompatibility with a shader reflection tool (such as D3DCompiler.dll or SPIRV-Cross). |
Collect SASS |
Enable fetch of SASS shaders which can be used to collect shader performance stats. |
Collect Line Tables |
Enable creation of shader-to-PC line tables used by the shader profiler for source correlation. |
Collect Hardware Performance Metrics |
Enables the collection of performance metrics from the hardware. |
Ignore Incompatibilities |
Nsight Graphics uses an incompatibility system to detect and report problems that are likely to interfere with the analysis of your application. By default, these incompatibilities are reported and the user is given the option of capturing despite them (with an associated warning of the possibility of issues). Some applications may have innocuous incompatibilities however, and having to view this warning every time might be undesired. When this option is enabled, the frame will attempt to capture despite any incompatibilities. Use this option only when you are certain that the incompatibility will not impact your analysis. |
Block on First Incompatibility |
Nsight Graphics uses an incompatibility system to detect and report problems that are likely to interfere with the analysis of your application. In some cases, these incompatibilities may be the first sign of an impending failure. Accordingly, being able to block on such a reported failure may aid in triaging and understanding a crash when running under Nsight Graphics. This option defaults to ‘Auto’ so it only reports critical incompatibilities, allowing lesser incompatibilities so as not to interfere with expected operation. It may be useful to toggle to ‘Enable’ if you encounter an application crash under Nsight Graphics to force an opportunity to investigate the crash. |
Enable Crash Reporting |
Enables the collection and reporting of crash data to help identify issues with the frame debugger. While a user is always prompted before a crash report is sent, this option is available to suppress these facilities entirely. |
Enable C/C++ Serialization |
Enables the ability to serialize a capture to C/C++. By default, applications are available to create a C++ capture, but there are some cases where extra data is collected in support of this feature before it is invoked. This option allows that collection to be disabled entirely. |
Force Single-Threaded Capture |
Controls whether capture proceeds with concurrent threads or with serialized threads. Use this option if you suspect your application’s multi-threading may be interfering with the capture process. |
Replay Thread Pause Strategy |
Controls the strategy used in live analysis for pausing threads.
|
Disable All Interception |
Turns off the interception mechanisms that Nsight Graphics uses to analyze the application. This is used to disambiguate launch failures from failures caused by interception. It is useful for validating that the application settings are correct. When enabled, the associated activity is not expected to work in any way. Please disable this option once you have confirmed that your application launches successfully. |