Graphics Capture Overview#
The Graphics Capture activity offers a set of tools for intercepting a user application and capturing the application’s graphical API calls and resources. Once captured, those API calls can be replayed in a standalone manner, and can be used - alongside graphics debugging tools - to inspect events, API state, resource values, and dependencies to understand where your application might have issues.
When to Use the Graphics Capture Activity#
The Graphics Capture Activity is an evolution of Nsight Graphics’s Frame Debugging tools. It offers a streamlined and persistent experience for saving application frames and debugging them at any time.
Use this activity when:
You want to save a standalone version of your frame.
You have a render-accuracy issue.
You expect that you may have a synchronization issue.
You want to explore the performance of your application shaders (DX12 and Vulkan).
The Graphics Capture activity supports D3D12 and Vulkan APIs.
Basic Workflow#
To start this activity, select Graphics Capture from the connection dialog.
The basic workflow for the Graphics Capture activity is to capture an application into a capture file that is saved to disk. This capture file may be opened for debugging, at which time you could navigate the events, data, and resources that your application is submitting/using to identify your issue. The capture file that is saved with the activity may also be shared with others, easily allowing them to see the same application resources that you have access to.
UI and CLI Capture#
The Graphics Capture activity supports creating graphics captures through either UI-based application launch and capture or command-line-interface (CLI) based application launch and capture.
Both approaches generally offer the same set of capabilities, yet there are some differences. A summary of differences include:
The CLI can allow for unattended capture, which is not as possible in the UI.
The CLI has all available capture options, whereas the UI has a selection.
The UI has dialogs that may be more expressive than CLI dialogs.
The UI does allow for project persistence, including argument alternation, whereas for the CLI the user would typically need to use the CLI history for these concerns.
UI projects may be shared between individuals.
The UI can be more friendly with respect to string escapes; with the CLI you are responsible for ensuring proper quoting and escaping.
The UI has an ability to filter error messages in its error list.
Some users may feel more comfortable with the UI than a CLI.
The Capture Document#
The capture document is a record of a previous capture. It contains an image that represents the scene that was captured, as well as details about the capture in a “Capture Details” section. From this document, graphics debugging may be entered. Additionally, the capture may be connected to another activity for analysis or replayed on its own.
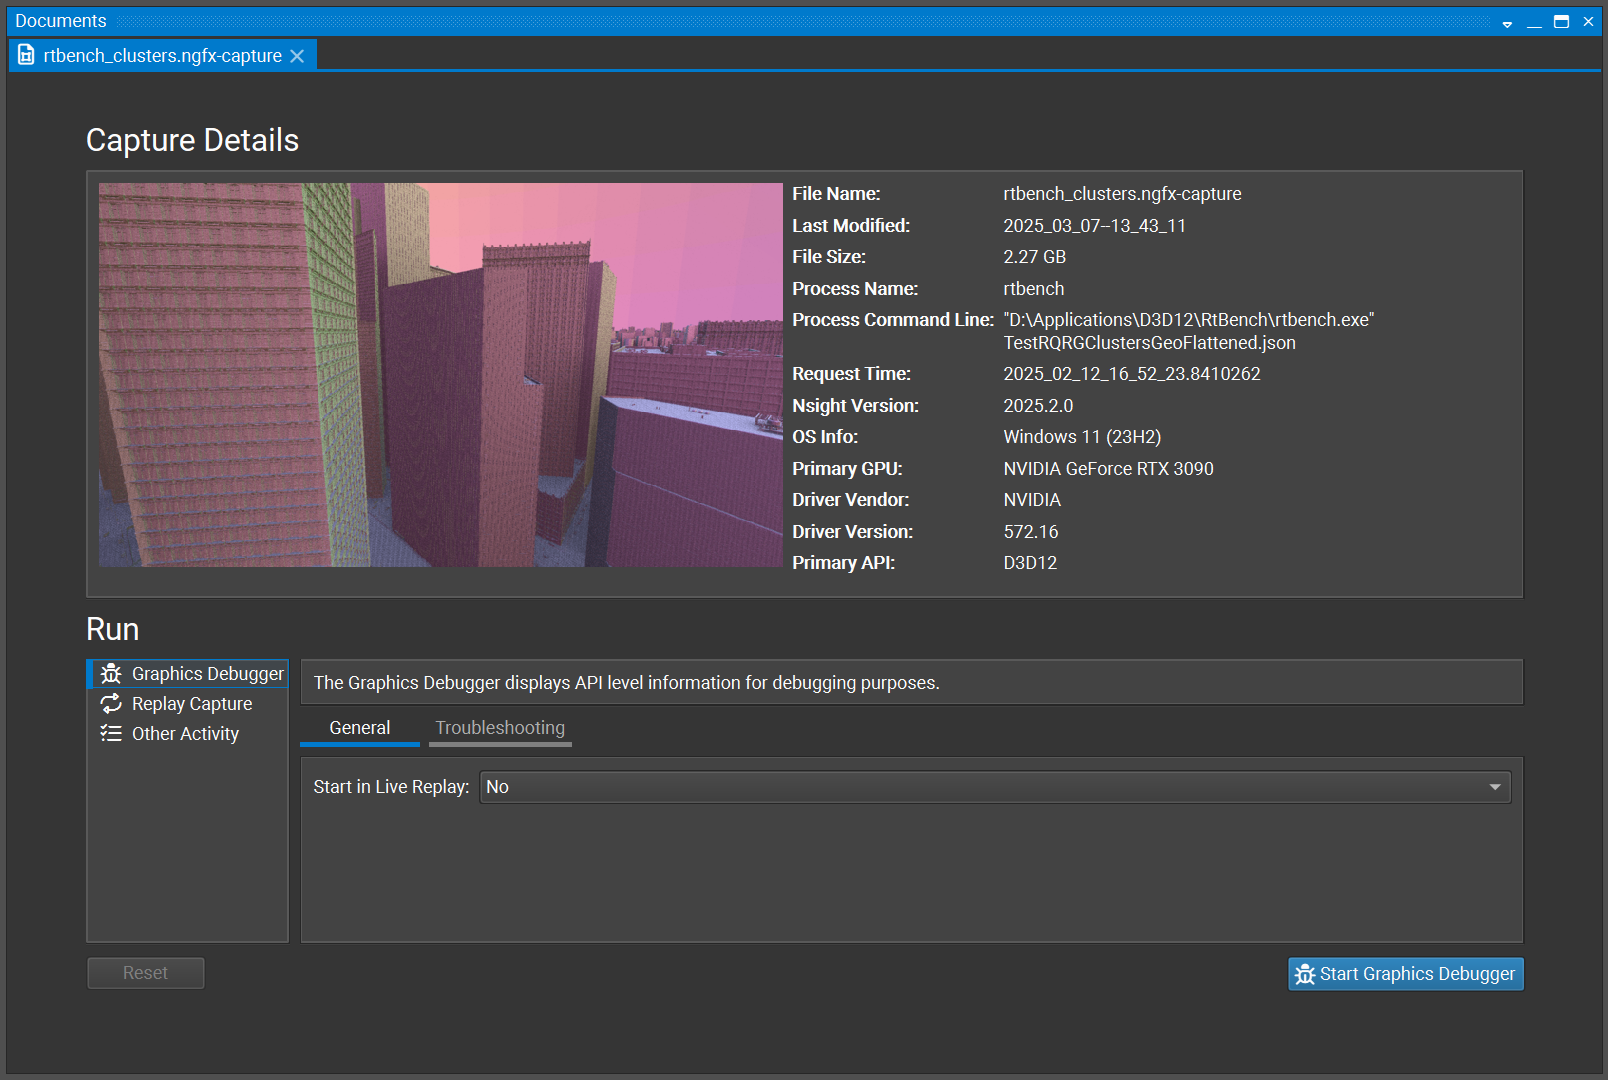
Starting Graphics Debugging#
To start Graphics Debugging, open a capture document, select the “Graphics Debugger” option under the Run list, and click the “Start Graphics Debugging” button.
Once started, the Graphics Debugger enters “Offline Replay” Mode.
Replay Modes#
The Graphics Debugger has two modes of inspection:
Offline Replay
Live Replay
These two modes of replay serve different purposes. Offline replay is fast to start and requires no device creation, but it does not have the ability to serve the full set of resources that Live replay mode can provide, as access to some resources may only be acquired via a full application replay.
Read more about each replay mode below.
Offline Replay#
In offline replay, the capture’s resources are used in a way that doesn’t create a rendering device. Because of this, the resources that may be inspected are more limited. However, because a rendering device is not created, this mode allows the capture to be investigated on nearly any system, including those that would be unable to replay the captured application. Additionally, because a rendering device and application resources are not created, offline replay starts immediately and without delay, which may be useful for quick inspections of certain classes of data.
When in offline replay, a banner is shown to indicate information that is not available until Live Replay is entered.
Live Replay#
Live Replay is a mode in which the full set of resources are available for inspection. This mode requires a user’s system to be able to replay the application in question. Note that while many attempts at portability are attempted in the Nsight Graphics binary replayer, there may be inherent requirements of the captured application that impose requirements on the end-user’s system.
Live replay is able to gather the full set of data that the Nsight Graphics Capture Debugging user interface exposes.
If a Live replay session fails while gathering data, Nsight Graphics automatically restarts the live replay session to attempt to avoid interruption in the user’s debugging session.