Shader Debugger Setup#
Note
The Shader Debugger requires to be run as Administrator on Windows or superuser (e.g. via sudo) on Linux. When running locally, this means the Nsight Graphics host must be run with these privileges, and when running remotely the Nsight Graphics Remote Monitor must have them. This is a requirement that we are working to remove in a future version.
Application Setup#
Before trying to run the Shader Debugger, you want to make sure your application is compatible. One of the engine features that can interfere is any “watchdog” timers that monitor threads to ensure they are making progress. When stopped at a breakpoint, the rendering thread does not make any progress, and the watchdog may try and close the application. This can leave the GPU hung and require a hard reboot to restore functionality. We are looking at ways to make this easier to use, but similar to Frame Debugging, it is best to disable any watchdog timers.
Shader Setup#
For any shader to be debugged at a source level, it must be compiled with debug information. Non-Semantic Debug Information is preferred, but not required. See Shader Compilation for more information on how to generate shaders with debug information.
A shader will undergo compilation multiple times in its lifetime. First, from high-level source (such as GLSL, HLSL, or Slang) to an intermediate binary format (e.g., SPIR-V), then again by the NVIDIA driver from the intermediate binary format to microcode that is executed by the GPU. A debug compilation of microcode depends on debug information included-in/along-side the intermediate binary. The Shader Debugger provides multiple modes to help facilitate if/when the shader is compiled as debug by the NVIDIA driver.
Shaders may be compiled to an intermediate binary format with optimizations, but the user should be aware that instruction step ordering, or performance may be impacted. It is advised to compile shaders with optimizations disabled for this reason. However, the Shader Debugger activity supports a JIT (or Just-In-Time) replacement mode which will allow the user to recompile the shader sources before replacement on a driver level. At this point, shaders may be compiled to skip any optimization steps that occured in the original compilation.
System Setup#
The Shader Debugger is supported in two different machine configurations: local debugging with two GPUs on one system or remote debugging using two systems, each with atleast one GPU. This is necessary because NVIDIA hardware does not support instruction level preemption for non-CUDA workloads, so when a shader hits a breakpoint on the GPU, it stops all rendering, including the desktop.
Single System Debugging#
In order to run the Shader Debugger, you need to have two or more GPUs installed in your system. One GPU must be reserved for the OS desktop environment and other GPU accelerated applications. The GPU reserved for this purpose can be any GPU, NVIDIA or other vendor, so long it supports Vulkan and an up-to-date driver can be installed. The GPU running your application must be at least NVIDIA’s Ampere microarchitecture or newer. The Nsight Graphics host eases the burden of GPU selection by allowing you to choose which GPU you intend to assign as a “host” GPU for the OS desktop environment and other GPU accelerated applications, and which as the “target” GPU for the application being debugged. Applications launched with the Shader Debugger will restrict the underlying graphics API (Vulkan) to only return the selected target GPU when enumerating devices, so further GPU configuration of the application is generally not required.
Note
Nsight Graphics will not make any effort to prevent any other applications from running on your selected target GPU.
You can use the nvidia-smi command from a terminal to display which GPU processes are running on.
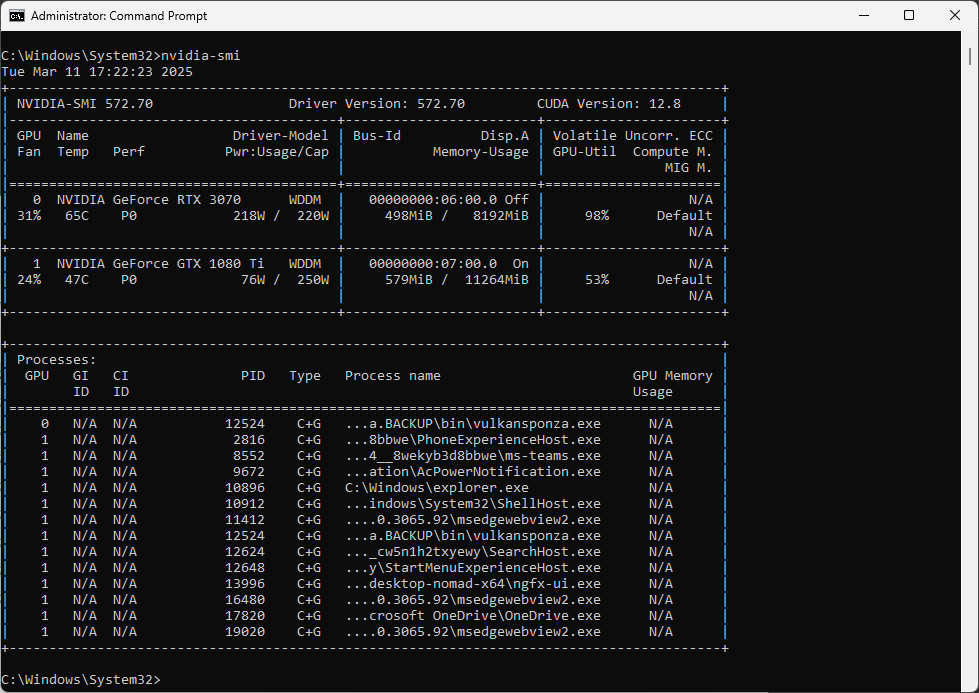
The image above shows an example of a correct setup when looking at the nvidia-smi command output: OS system processes such as ShellHost.exe are running on the GPU reserved for the OS desktop environment, while the debug process vulkansponza.exe is running on the GPU selected for debugging.
Windows Setup#
When configuring for single system, multi-GPU debugging, it is strongly advised that your target GPU is headless, or disabled for use by the OS desktop environment. Windows is known to become unstable when interacting with the desktop of a GPU that has been suspended.
When your system is configured with two or more NVIDIA discrete GPUs, and both have been selected as the host and target GPUs, Nsight Graphics will automatically configure your system to prepare for multi-GPU debugging at launch time. See Automatic Configuration (Windows Only) for more information.
The Nsight Graphics host has some features like the Focus Picker that require a Vulkan rendering context. The GPU selected for this Vulkan rendering context is dictated by the host GPU selection in the Shader Debugger activity settings. If you experience a freeze, you can confirm if the correct GPU was selected by Nsight Graphics by using the nvidia-smi tool mentioned above.
Windows provides the capability to select an applications GPU preference in the Windows Settings applet under System > Display > Graphics. However, some applications may ignore this preference and continue to render on a different GPU than what was selected, such as when there is a saved game rendering profile or the highest performance GPU is selected for rendering by default.
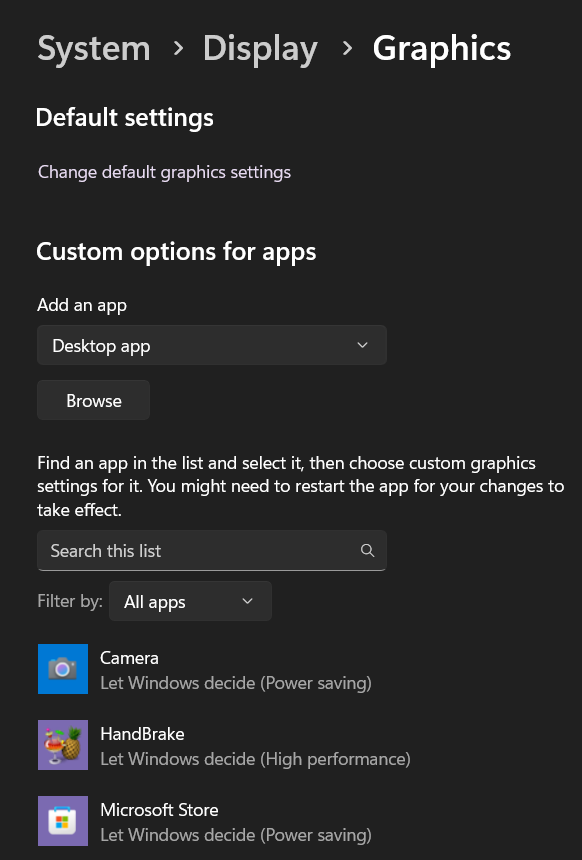
Click the Browse button to select an application.

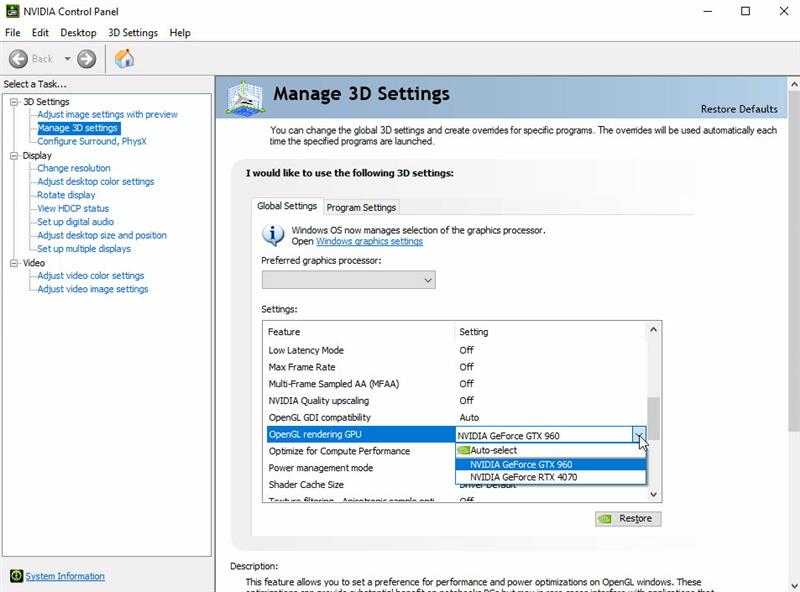
When you have a system with two or more discrete NVIDIA GPUs, Windows Graphics settings alone can sometimes be insufficient to ensure OpenGL applications select and render on the correct GPU. Selection of the preferred OpenGL rendering device can be found in the NVIDIA control panel.
Linux Setup#
In order to run on Linux, you need to run 2 separate X servers: one for each GPU. These are the steps you can use in order to do this using LightDM and Xfce
Using apt/apt-get, install lightdm and xfce.
Make sure you have 2 sets of keyboard, mouse, and display attached to the system.
Make lightdm the default DM (this is needed for DualX setup and also for x11vnc):
sudo dpkg-reconfigure gdm3
By default all devices are attached to seat0.
Use
loginctl seat-status seat0to see all devices using seat0.Attach a GPU, keyboard, and mouse to seat1 (or the corresponding USB ports):
loginctl attach seat1 /sys/devices/pci0000:00/0000:00:01.0/0000:01:00.0/0000:02:10.0/0000:04:00.0/drm/card1
loginctl attach seat1 /sys/devices/pci0000:00/0000:00:14.0/usb1/1-4
loginctl attach seat1 /sys/devices/pci0000:00/0000:00:14.0/usb1/1-5
Once you have done this, you need to reboot your system.
Multi-System Debugging#
Setting up multi-system debugging is similar on Windows and Linux.
You need to run the Nsight Graphics Remote Monitor (nv-nsight-remote-monitor) as Administrator (Windows) or superuser (Linux) on the system you run your graphics application on.
Run the Nsight Graphics host (ngfx-ui) on the second system.
From the host, set up the remote connection, including the machine name or IP address to connect to.
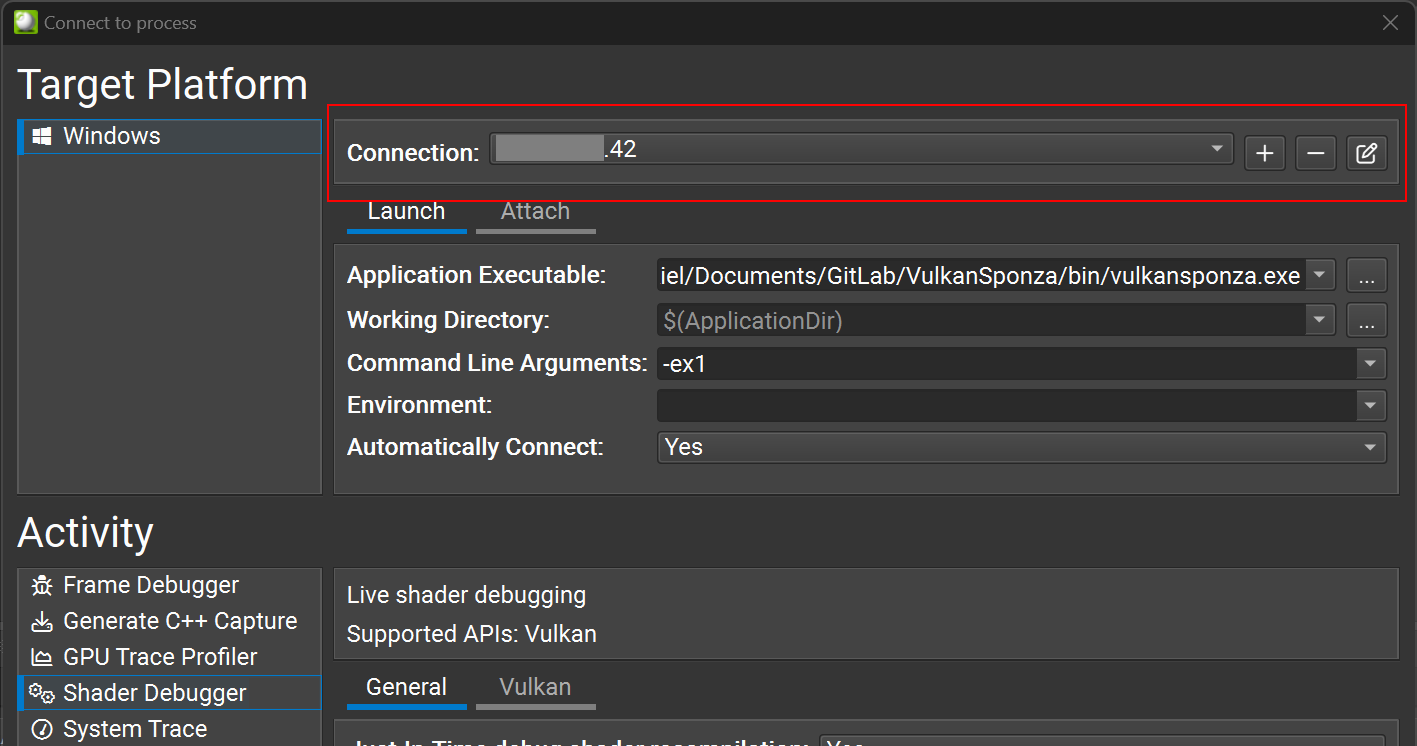
Change the Application Executable field to point to the application you want to run. Note that this and the Working Directory field are relative to the target machine, not the local machine.
Update any command line arguments or environment variables you may need.
Select the Shader Debugger activity and then press the Launch Shader Debugger button in the lower-right corner of the dialog.
The host should automatically attach to your target application once it has finished launching.
Automatic Configuration (Windows Only)#
Nsight Graphics will require one-time configuration of a target machine when first launching an application with the Shader Debugger. Some actions, such as switching target GPUs, or changing TDR settings within Nsight Graphics may require a re-configuration to occur.
The following registry changes are made by the tool:
Configuring Windows TDR Delay Learn More.
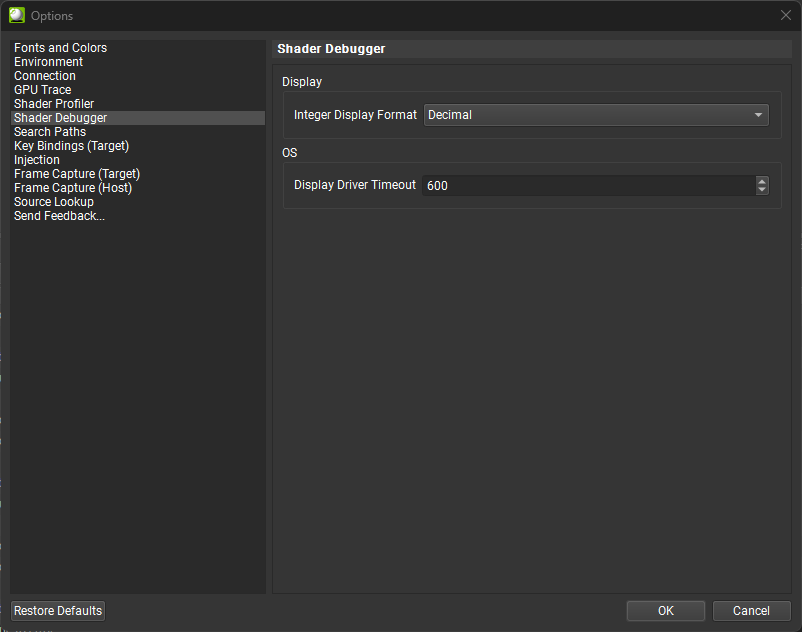
TDR Delay must be increased on the debug target system so that the application can remain stopped at a breakpoint for an extended amount of time. The increased timeout value can cause significant delays resetting the device when GPU exceptions occur, and when trying to collect a dump via Nsight Aftermath. It is advised to reset your TdrDelay setting to its default value (2s) after debugging is complete.
The Nsight Graphics default configured value is 600 seconds. This value can be changed by the user within the Nsight Graphics host settings.
Enabling the GPU Debugger
Configuring NVIDIA multi-GPU rendering (single system debugging only)
Automatic System Settings Restoration (Windows Only)#
When Nsight Graphics configures your system for shader debugging, it modifies several critical Windows registry settings to enable debugging functionality. To ensure your system returns to its normal operating state after debugging is complete, Nsight Graphics includes an automatic restoration system that safely restores your previous settings.
What Gets Modified#
During shader debugging configuration, the following system settings are temporarily modified:
Windows TDR (Timeout Detection and Recovery) Delay Learn More.
NVIDIA multi-GPU rendering settings (single system debugging only)
Before any modifications are made, Nsight Graphics automatically saves your current system settings so they can be restored later.
How Restoration Works#
The restoration system operates through either when the Nsight Graphics host application is closed, when the Nsight Graphics Remote Monitor is closed or with a Windows scheduled task at login. When a system is configured for shader debugging, this task is automatically installed and remains on your system to support multiple debugging sessions.
Persistent Installation: The restoration system remains installed between debugging sessions for convenience.
User Control: Restoration only occurs when you explicitly request it.
Automatic Monitoring: A background scheduled task checks for restoration requests at system logon.
Safe Restoration: Settings are restored in a controlled manner with appropriate system reboot handling.
When Restoration Occurs#
You will be prompted to restore your system settings in the following scenarios:
1. When Exiting Nsight Graphics Host (single system debugging only)
If you close the NVIDIA Nsight Graphics host application while debug settings are active on your local system, you will be prompted with a dialog asking if you want to restore your system settings:
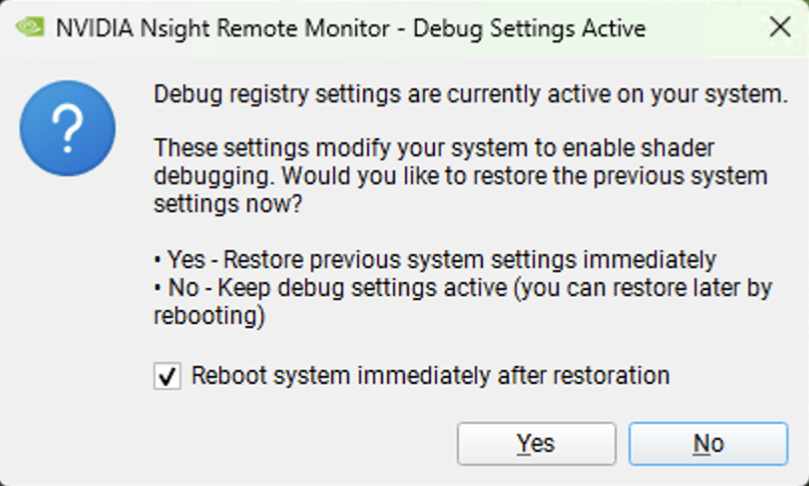
The dialog provides two options:
Yes: Restore settings immediately. You can choose whether to reboot the system automatically.
No: Keep debug settings active. Settings will remain modified until you manually trigger restoration (prompted on the next reboot, or the next exit of Nsight Graphics).
2. When Exiting Nsight Graphics Remote Monitor (multi-system debugging only)
If you close the NVIDIA Nsight Graphics Remote Monitor on the target system while debug settings are active, you will be prompted with the same restoration dialog described above.
The dialog provides the same options:
Yes: Restore settings immediately. You can choose whether to reboot the system automatically.
No: Keep debug settings active. Settings will remain modified until you manually trigger restoration (prompted on the next reboot, or the next exit of Nsight Graphics Remote Monitor).
3. Scheduled Task Restoration Dialog
A restoration confirmation dialog will appear after each system reboot until system settings are restored, except the first reboot after initial debug setting configuration:
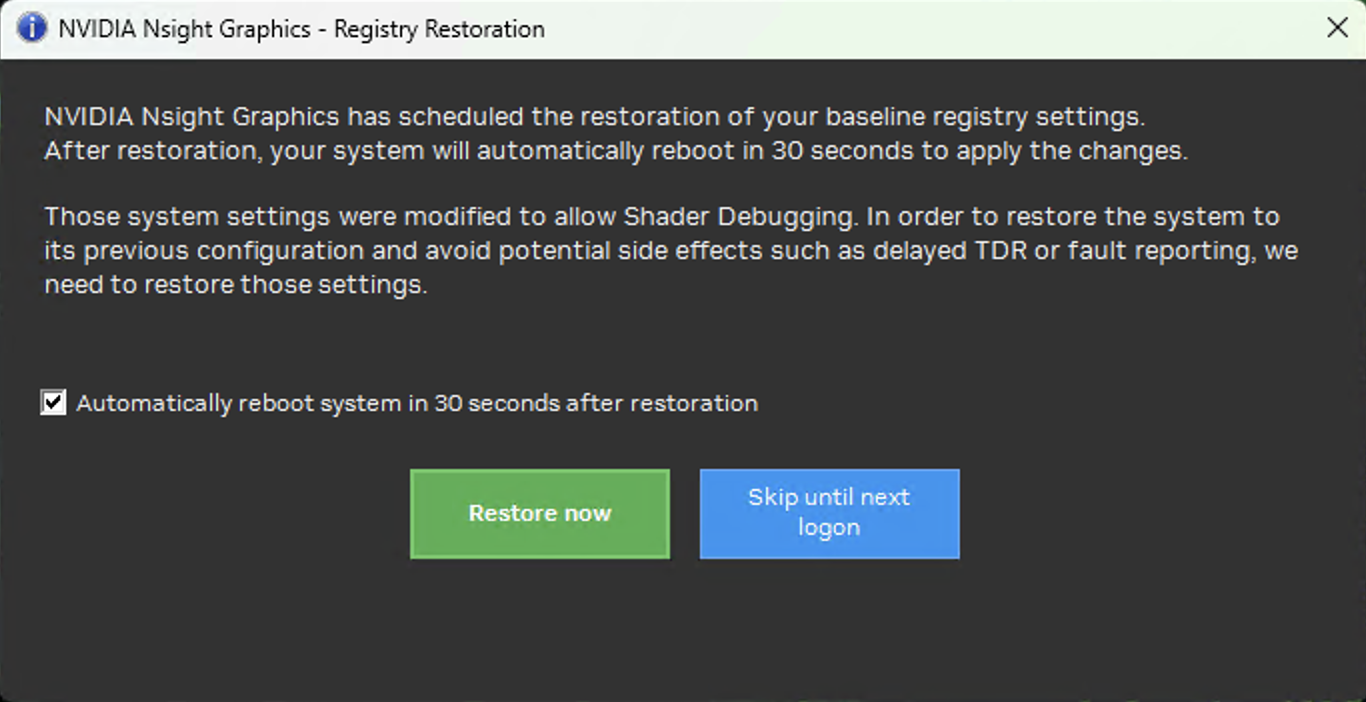
This dialog provides the following options:
Restore now: Immediately restore your baseline registry settings and optionally reboot the system.
Skip until next logon: Postpone restoration. The dialog will appear again on your next login, unless you elect to restore after closing either Nsight Graphics or the Nsight Graphics Remote Monitor.
The checkbox allows you to control whether the system reboots automatically after restoration. If you decline the automatic reboot, you must manually reboot your system later for the restored settings to take effect.