GPU Crash Dump Inspector#
The GPU Crash Dump Inspector window is comprised of two major views:
In the left part of the window, there is a set of tabs that provide summary information for the open GPU crash dump file, as well as information about the captured crash.
In the right part of the window, there is a multi-purpose area that shows detailed information based on selections made in some of the sections of the left-side tabs.
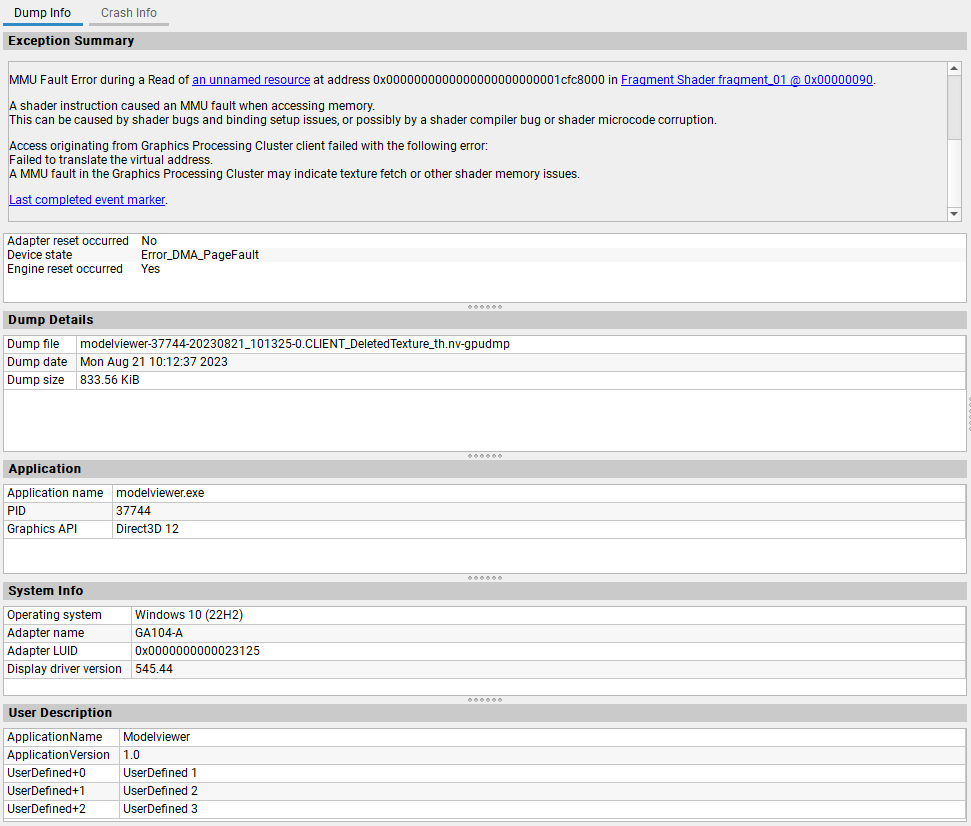
Dump Info#
The Dump Info tab provides summary information for the open GPU crash dump file and the data contained in the dump. It is comprised of the following sections:
The Dump Details section summarizes information about the GPU crash dump file, such as the file name, the date and time the dump was created, and the size of the file.
The Application section summarizes information about the application for which the GPU crash dump file was captured, like the name of the executable, the process identifier of the corresponding process, and which graphics API was used.
The Exception Summary section summarizes information about the reason for the GPU crash or GPU hang captured in the GPU crash dump file. The first section contains an analysis of any page faults or shader faults detected in the dump. This provides potential causes for these issues and includes links to any available resource information, shader locations, and relevant markers. Analysis for other crash reasons will be added in future updates. The second section shows what state the graphics adapter and D3D or Vulkan device were in when the device recovery was triggered (TDR).
The System Info section summarizes the information about the system on which the GPU crash dump file was captured. This includes information about the operating system, the graphics driver, and the GPU on which the has crash happened.
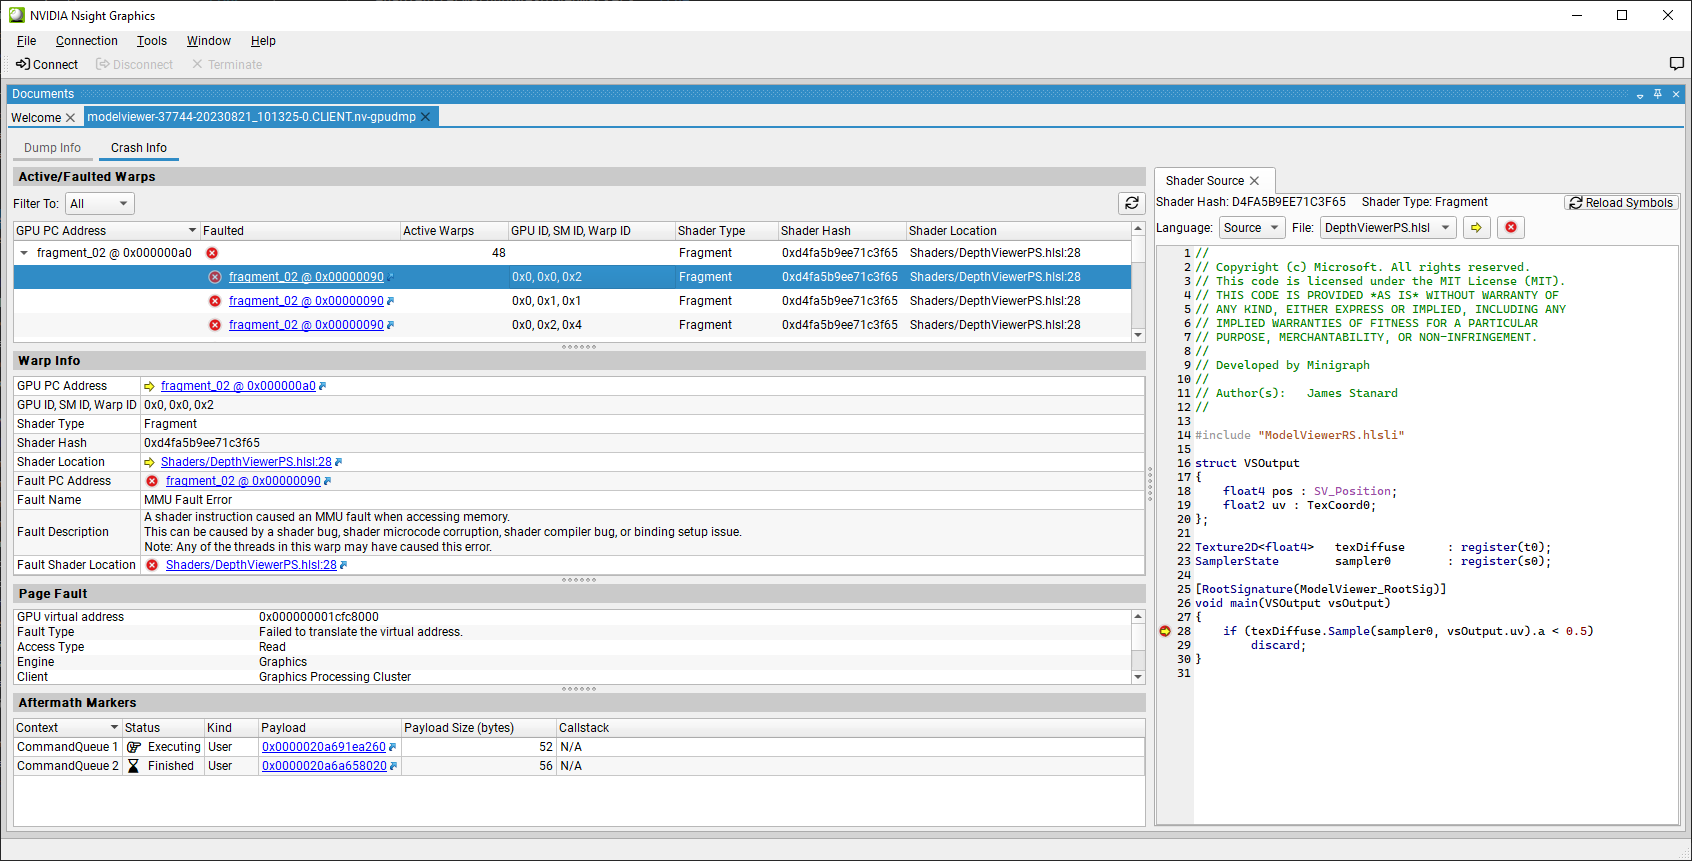
Crash Info#
The Crash Info tab provides detailed information for data captured in the open GPU crash dump file. The available sections vary based on the type of the crash and what information was captured into the crash dump.
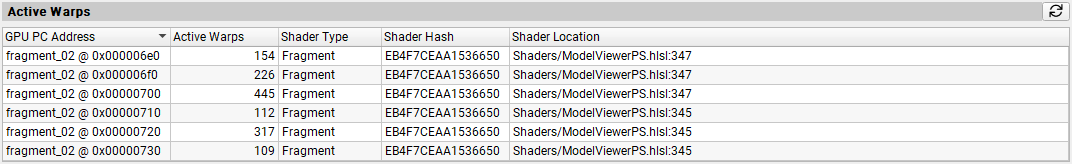
The Active Warps section, if available, shows all active shader executions at the time of the crash or hang. Each row shows the summary for all the warps executing at a specific shader address, including the number of warps, the type of the shader, the shader hash, and the corresponding location within the shader (if shader debug information is available). Clicking a row in the table opens the corresponding Shader View.
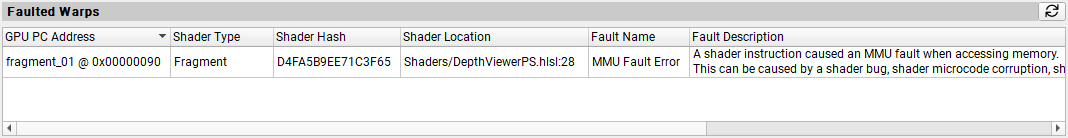
The Faulted Warps section, if available, shows all shader executions that have hit errors. Each row shows a summary of the fault hit on a specific shader address, including the error type, the type of the shader, the shader hash, and the corresponding location within the source shader (if shader debug information is available). Clicking a row in the table opens the corresponding Shader View.
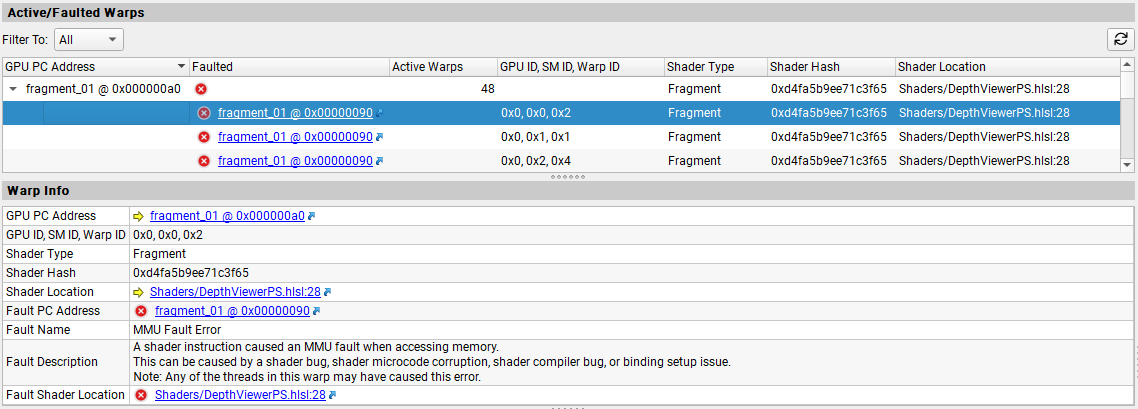
The Active/Faulted Warps section, if available, shows expandable rows each representing the group of all the warps that were executing at a specific shader address. Rows are marked as faulted if any of the warps hit a fault. The Active Warps column shows the number of warps executing at the shader address in the GPU PC Address column. The rows can be expanded to show details about the individual warps. Each entry shows the fault status of the warp, a unique identifier for the warp, the type of the shader, the shader hash, and the source or IL location within the shader (if shader shader debug information is available). Clicking a row in the table or the address link in the Faulted column opens the corresponding Shader View. The warp information is populated according to the selection and if the warp faulted, additional information such as the name of the fault, its description, and the shader address at which the warp hit that fault is also shown. Clicking on a GPU PC Address or Shader Location link opens the Shader View.
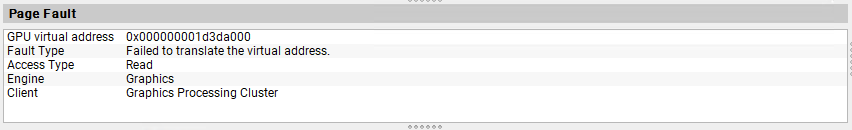
The Page Fault section, if available, shows information about the GPU page fault that caused the crash. Besides the address of the page that could not be accessed, the type of the fault, the type of the access and the GPU unit from which the page was accessed.
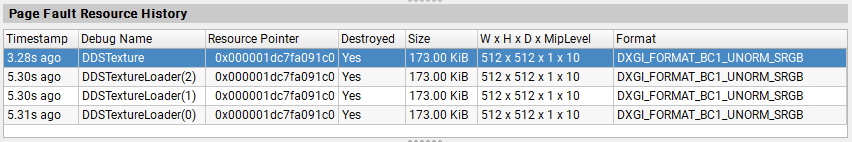
The Page Fault Resource History section, if available, shows information about the resource that is mapped or was mapped at the GPU page fault address if the Aftermath resource tracking feature was enabled.
Note
The full resource history feature is only available on R550 and later drivers. It also requires the application to integrate Aftermath SDK 2024.1 or later to properly track debug names and resource pointers. Otherwise, you may only have a debug name for the first resource and no resource pointer available.
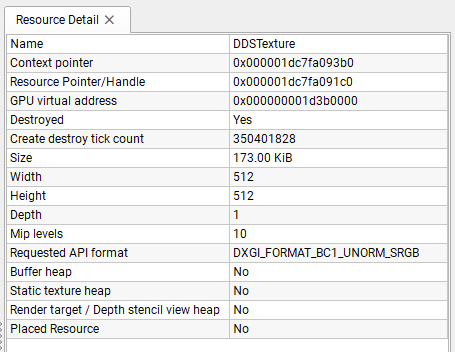
The Resource Detail view shows detailed information about a resource selected by clicking a resource entry in the Page Fault Resource History section above. The view shows the resource’s debug name, the resource’s base GPU virtual address, the resource’s size, etc.
The Fault Info section, if available, shows extra information about the error that caused the crash. This section is shown instead of the Page Fault section for certain other error types.

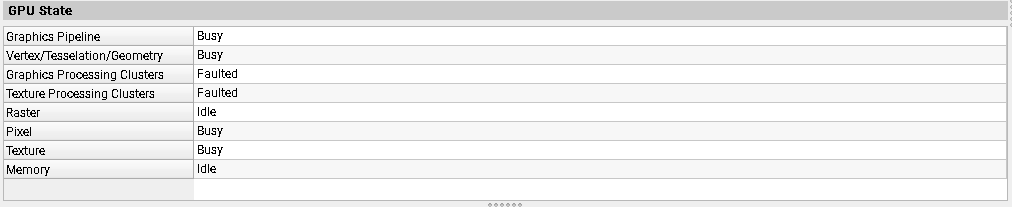
The GPU State section shows a high-level summary of the state of various parts of the GPU. This can be helpful to track down which parts of the graphics pipeline were active or have faulted in the case of a crash.
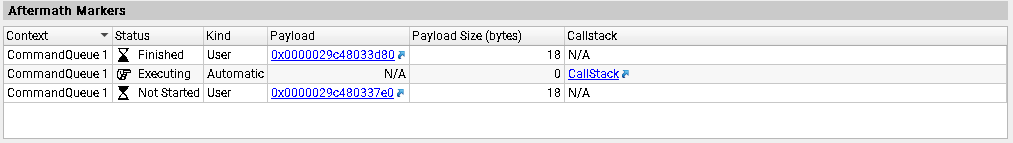
The Aftermath Markers section, if available, shows a summary of the Aftermath event markers last processed by the GPU for each of the registered Aftermath contexts. For user event markers, clicking the Payload link in the table opens the corresponding Aftermath Markers View that allows you to inspect the user-provided marker payload. For automatic event markers, clicking the CallStack link opens an Aftermath Call Stack View showing the call stack of the function that recorded the corresponding graphics command into the D3Dcommand list or Vulkan command buffer. See also the event marker documentation in
GFSDK_Aftermath.hand the Nsight Aftermath SDK documentation for more detail.
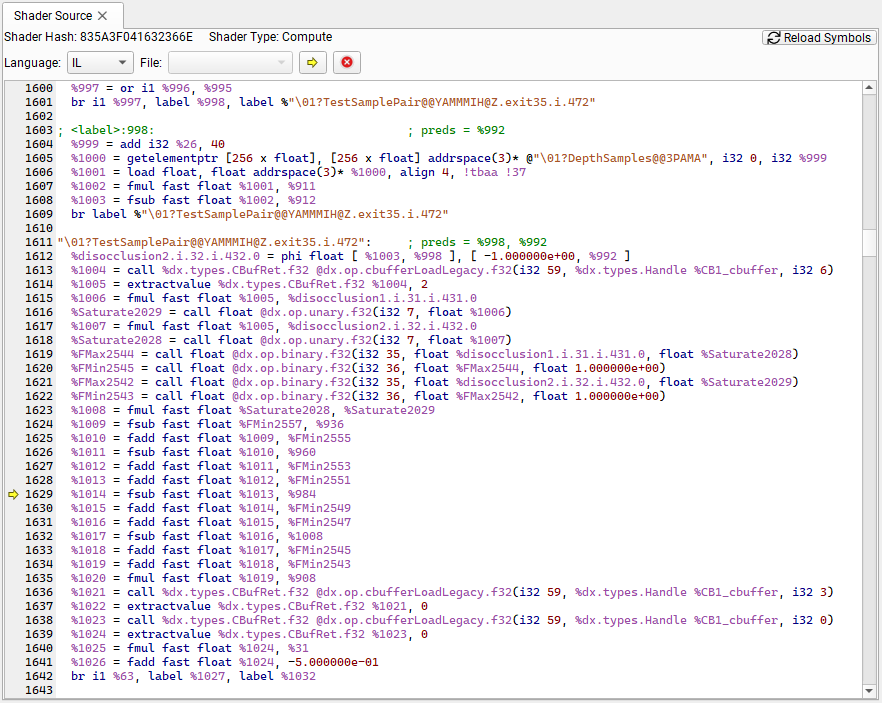
Shader View#
The Shader Source view shows the shader code related to the selection made in the Active Warps, Faulted Warps or the Active/Faulted Warps view. This requires that the appropriate information is made available by Configuring the GPU Crash Dump Inspector.
Depending on what information is available for the shader, the Language selection box provides the following options:
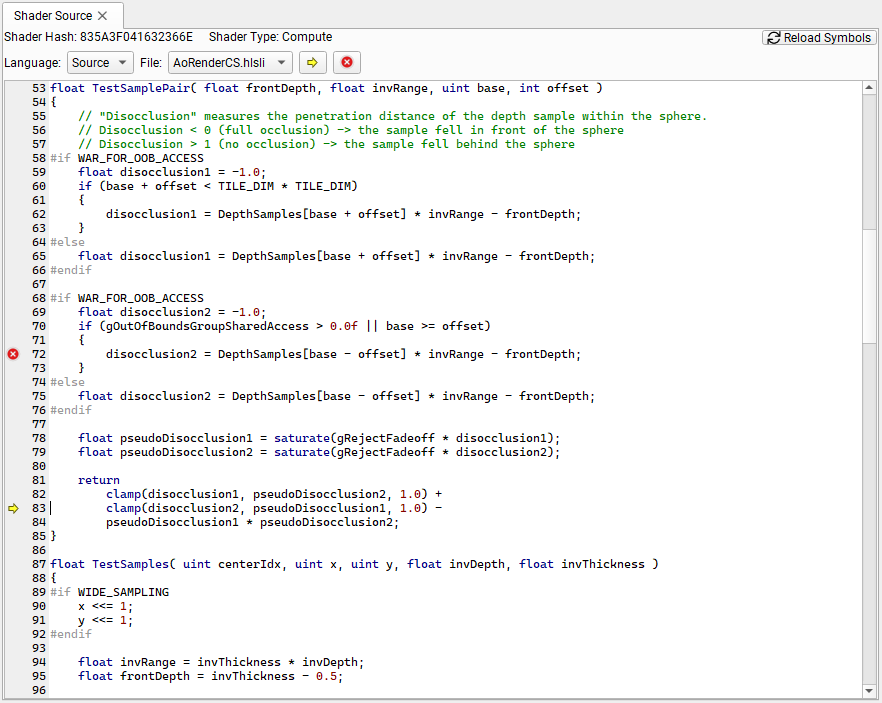
If Source is selected, the view shows the high-level shader source of the shader corresponding to the row selected in the Active Warps, Faulted Warps or the Active/Faulted Warps view. If the shader was compiled from several source files, the File selection box allows you to switch between the source files. If a row in the Active Warps or the Active/Faulted Warps view is selected, the shader source line that was executing by the selected warp when the crash dump data was captured is marked with a yellow arrow. If that warp has faulted, a red circle marks the location of the fault. If a row in the Faulted Warps view is selected, the shader source line that corresponds to the faulted instruction is marked with the red circle. The yellow arrow and red circle buttons jump directly to the corresponding marked instructions.
If IL is selected, the view shows the intermediate assembly of the shader (DXIL or SPIR-V) corresponding to the row selected in the Active Warps, Faulted Warps or Active/Faulted Warps view. If a row in the Active Warps or the Active/Faulted Warps view is selected, the intermediate language statement that was executing by the selected warp when the crash dump data was captured is marked with a yellow arrow. If that warp has faulted, a red circle marks the location of the fault. If a row in the Faulted Warps view is selected, the intermediate language statement that corresponds to the faulted instruction is marked with the red circle. The yellow arrow and red circle buttons jump directly to the corresponding marked instructions.
Aftermath Marker Data View#
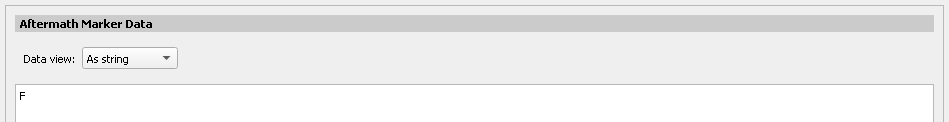
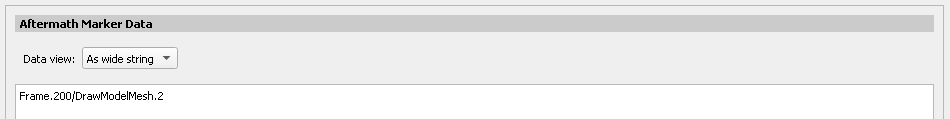
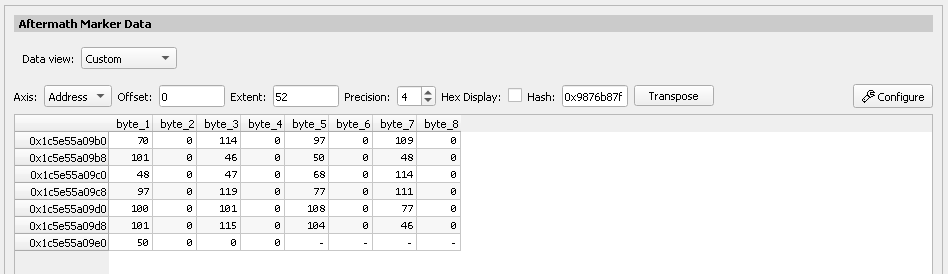
The Aftermath Marker Data view allows inspection of the Aftermath event marker data provided by the application. Since Aftermath event marker data is typeless the marker data view supports different Data view modes for interpretation of the raw data:
As string interprets the event marker data as zero-terminated UTF-8 character string.
As wide string interprets the event marker data as zero-terminated wide character string.
Custom allows you to inspect the raw event marker byte data or to provide a custom interpretation of the data using a Structured Memory Configuration.
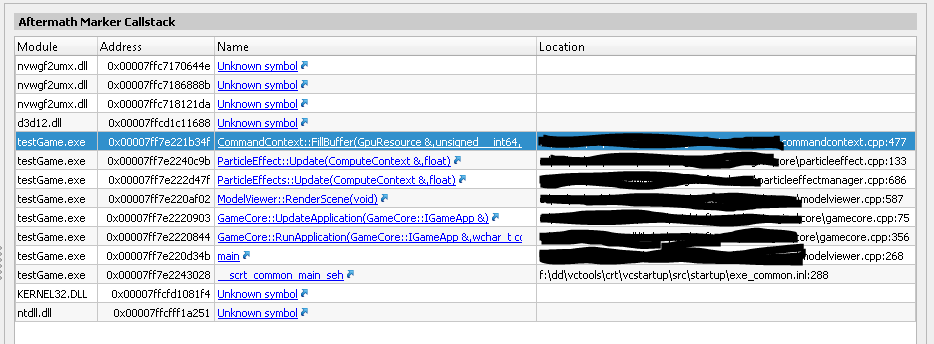
Aftermath Marker Call Stack View#
The Aftermath Marker Call Stack view shows the call stack for the last draw, dispatch, or copy call processed by the GPU. Resolving the call stack to source location requires a properly set up symbol search path in the Search Paths Settings. Alternatively, clicking the Unknown Symbol link allows to provide a symbol file for a specific call stack element.