Graphics Capture UI Reference#
Overview#
This section provides an overview of the tools that are available while debugging a graphics capture.
API Inspector#
The API Inspector is a view that offers an exhaustive look at all of the state that is relevant to a particular event to which the capture analysis is scrubbed.
To access this view, go to Graphics Debugger > API Inspector.
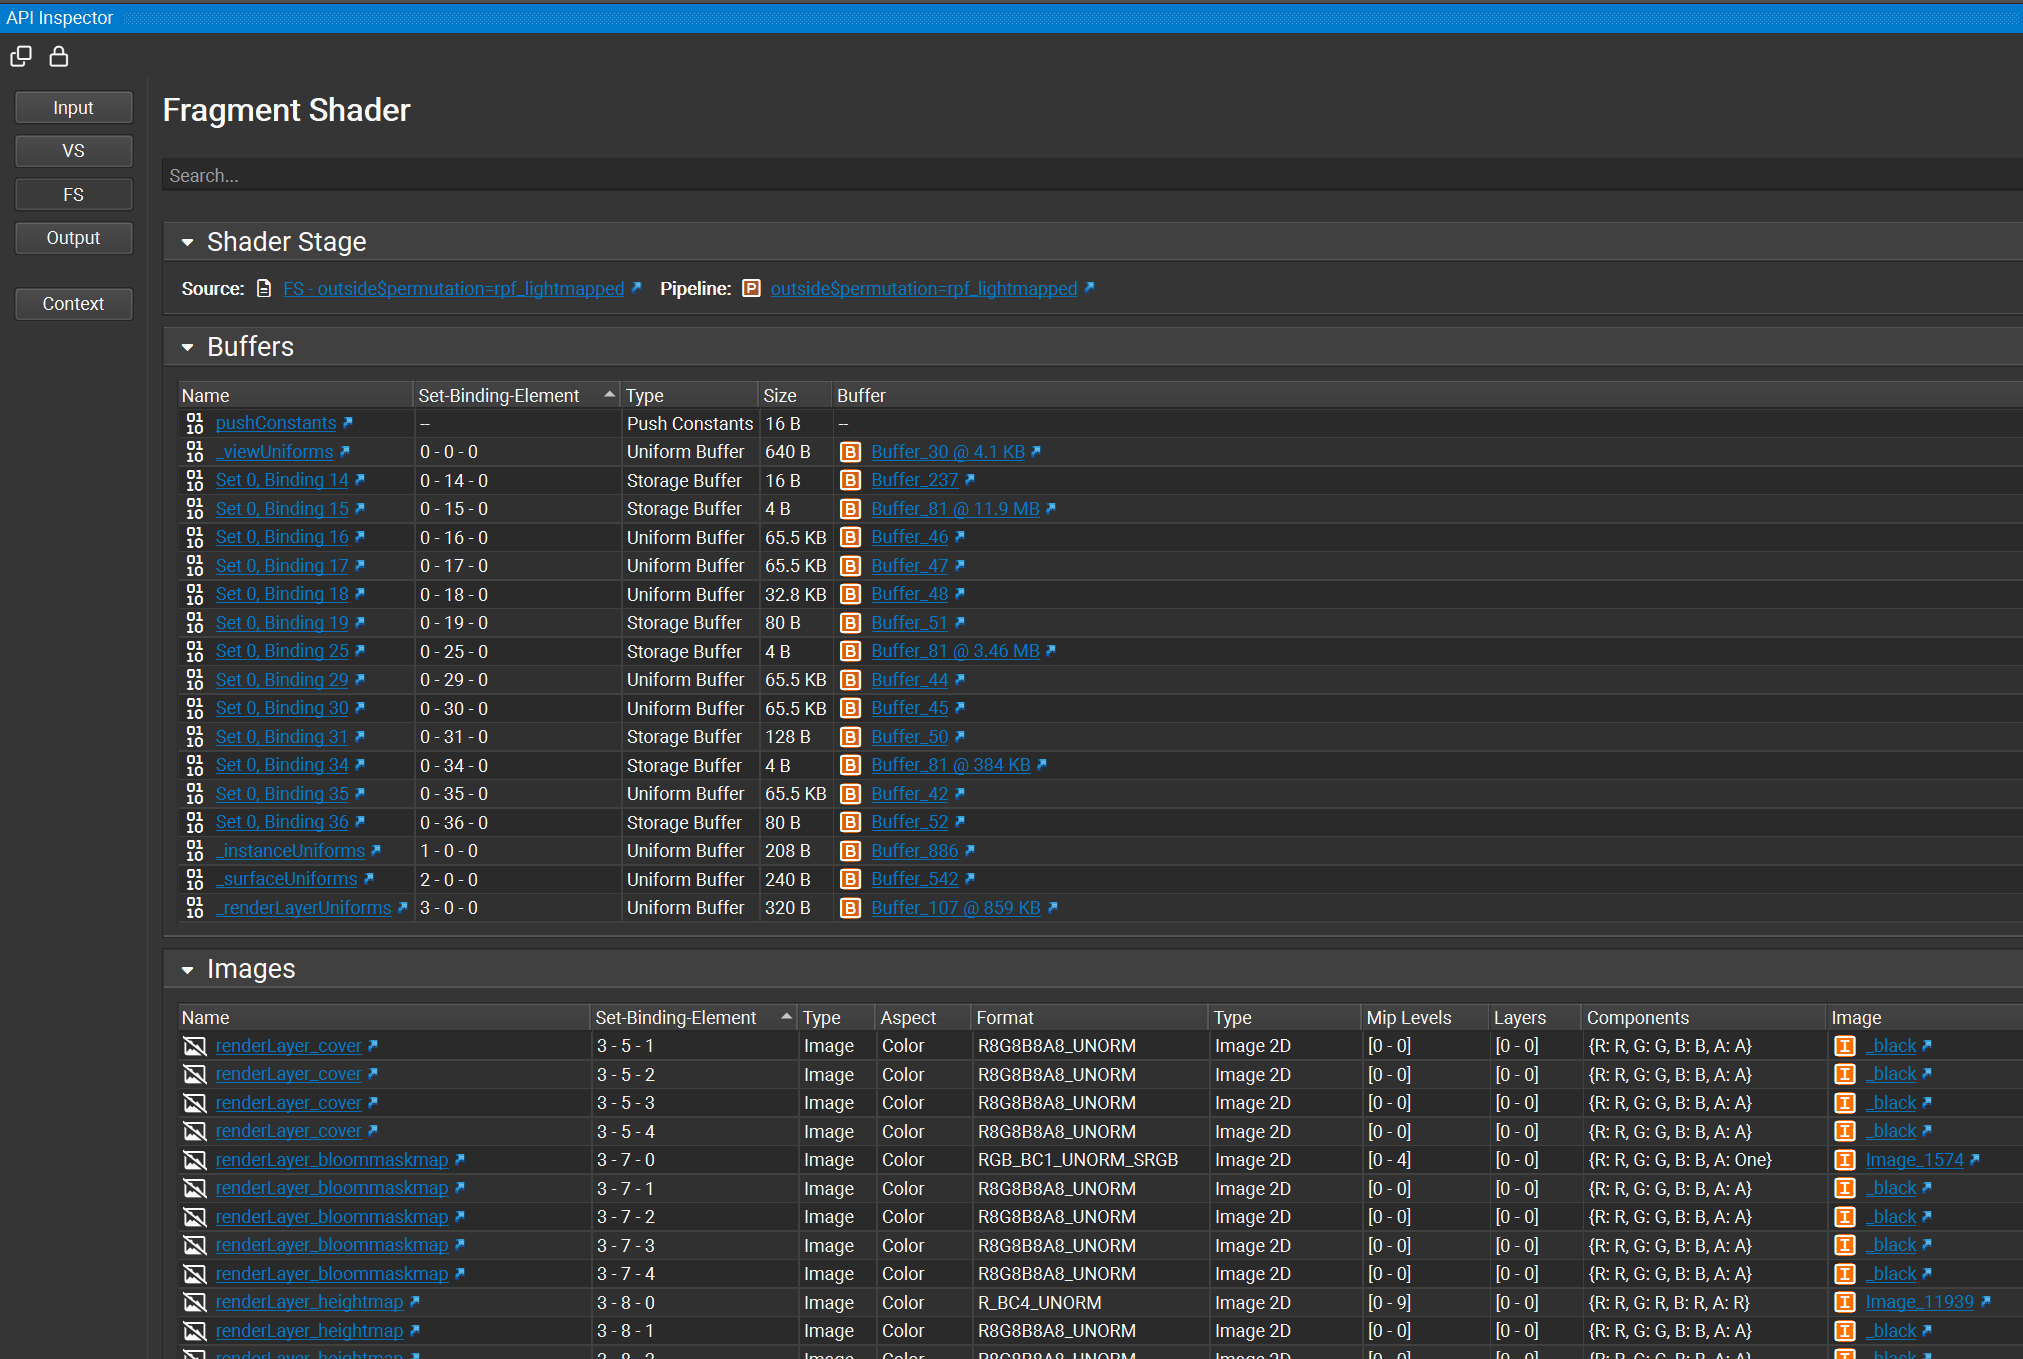
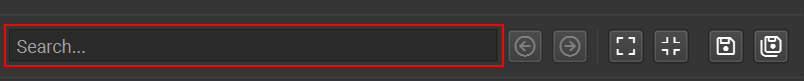
With API Inspector pages, there is a search bar that offers a quick way of finding the information you need on a particular page. The bar indicates the number of matches in each page, and forward and back navigation buttons are provided for navigating between each match. The buttons also support keybindings, with F3 for next and Shift+F3 for previous.
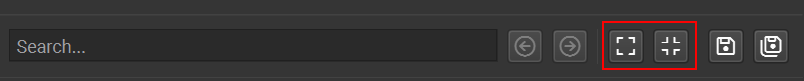
Expand/Collapse
Within an API Inspector page, there are many sections that can be expanded or collapsed to help narrow the information that is displayed to only the information you wish to see at that point in time. While each section can be individually collapsed, the UI has buttons that allow for expanding or collapsing all elements in one click.
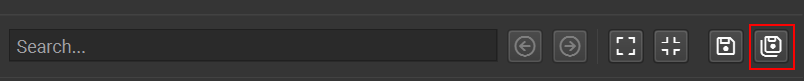
Export
Each page has the ability to be exported to structured data in a json format. This json data includes key value pairs of the data elements, as well as indirections that indicate the relationships between different kinds of data.
This data is useful in cases where you may want to export data for persistence, or perhaps to run a diff between the data of different events.

The view also has the ability to export data from all pages. The information in each is exported to a large, combined file in a structured json format. To accomplish this, use the Export All Pages to Json button.
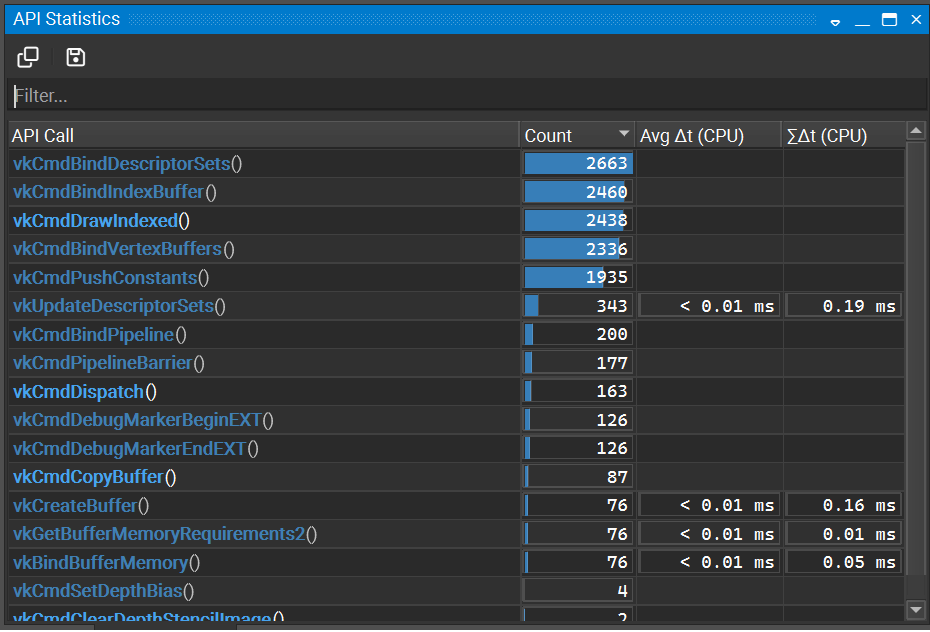
API Statistics View#
The API Statistics View is a high-level view of important API calls, and includes information to help you see where GPU and CPU time is spent.
To access this view, go to Graphics Debugger > API Statistics.
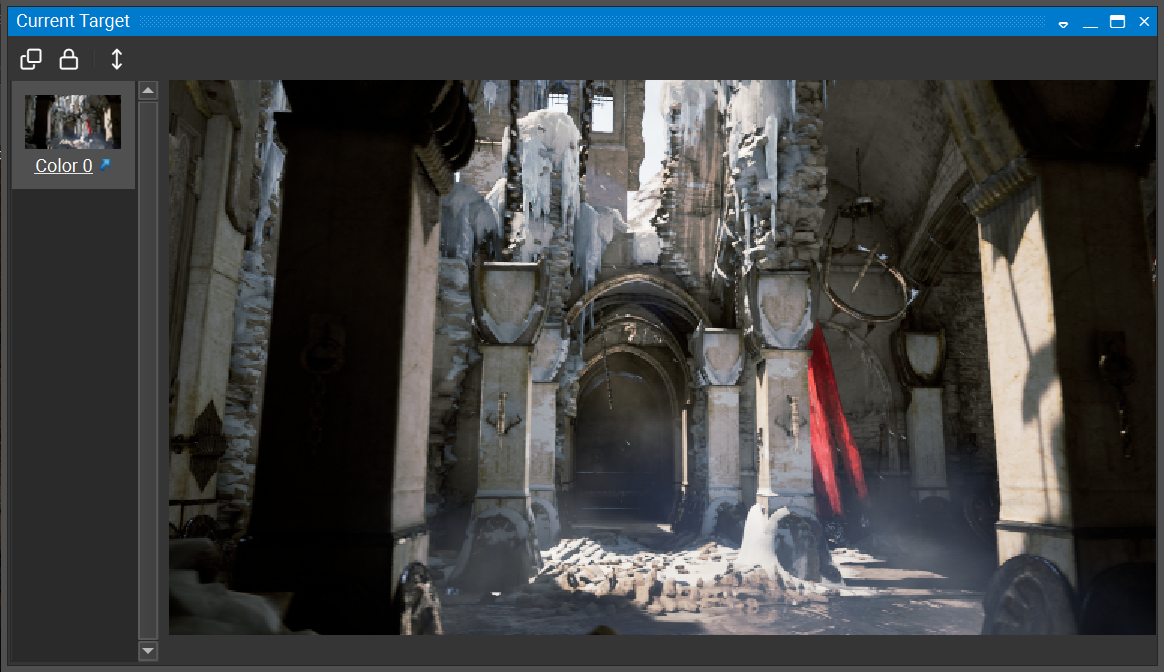
Current Target View#
The Current Target view is used to show the currently bound output targets. This can be useful because it focuses in on the bound output resources, rather than having to search for them in the All Resources view.
To access this view, go to Graphics Debugger > Current Target.
Current Target displays thumbnails along the left pane for all currently bound color, depth, and stencil targets. This view changes as you scrub from event to event. All of the thumbnails on the left can be selected to show a larger image on the right. You can also click the link below each to open the target in the Resource Viewer.
Descriptors#
The Descriptors view shows descriptors that are relevant to the current event.
To access this view, go to Graphics Debugger > Descriptors.
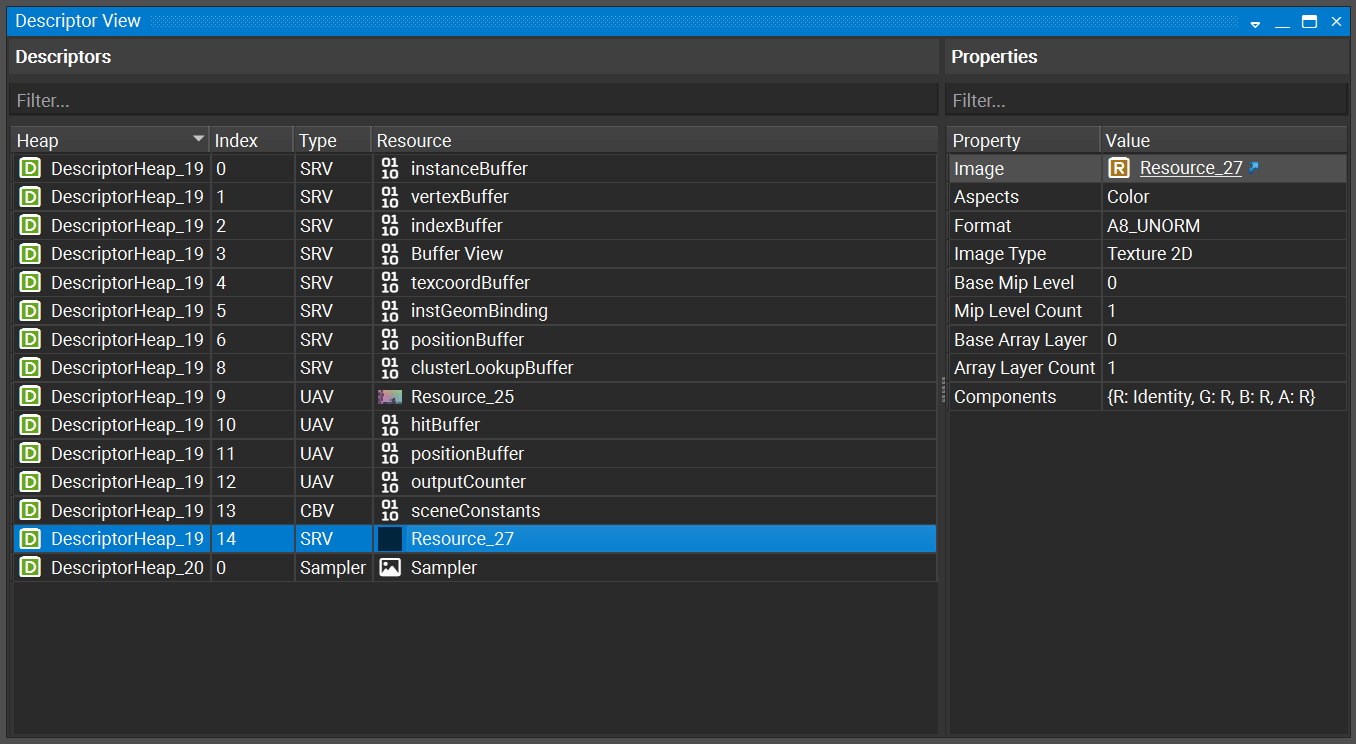
The Descriptors view shows API-appropriate Descriptor objects and the resources that they refer to. The properties of each descriptor (and the resources they refer to) are listed on the right.
Event Details#
The Event Details view shows all parameters for the current event in a hierarchical tree structure that allows for searching.
To access this view, go to Graphics Debugger > Event Details.
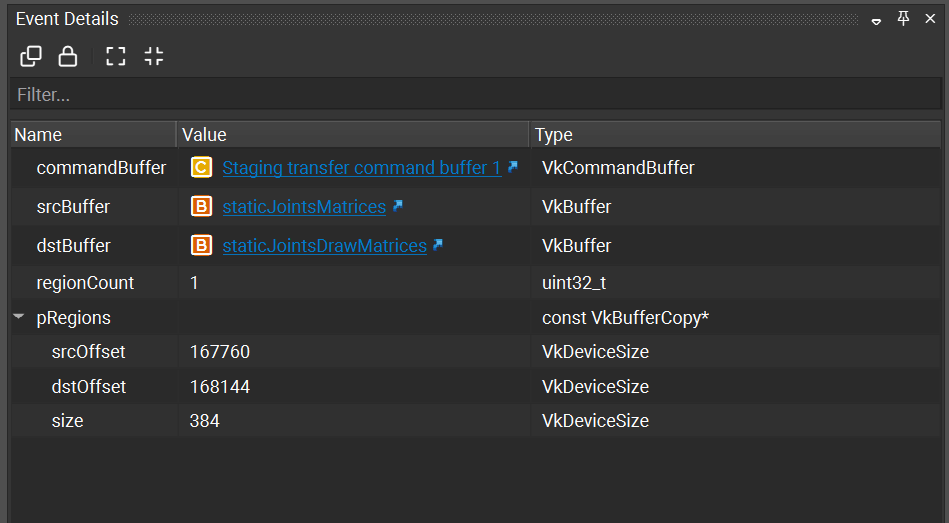
Because this window shows parameters for the current event, it changes as you navigate the scene. If you wish to keep the parameters for comparison against another call, the view supports Clone and Lock capabilities.
Column |
Description |
|---|---|
Name |
The name of the parameter or child of a parameter structure. |
Value |
The value passed in to the API call for this parameter. |
Type |
The type of the parameter in question. |
For events that reference API objects, the event details view provides a link to examine more information to that object in the Object Browser.
Event Viewer#
The Events view shows all API calls in a captured frame. It also displays both CPU and GPU activity, as a measurement of how much each call “costs.”
To access this view, go to Graphics Debugger > Events.
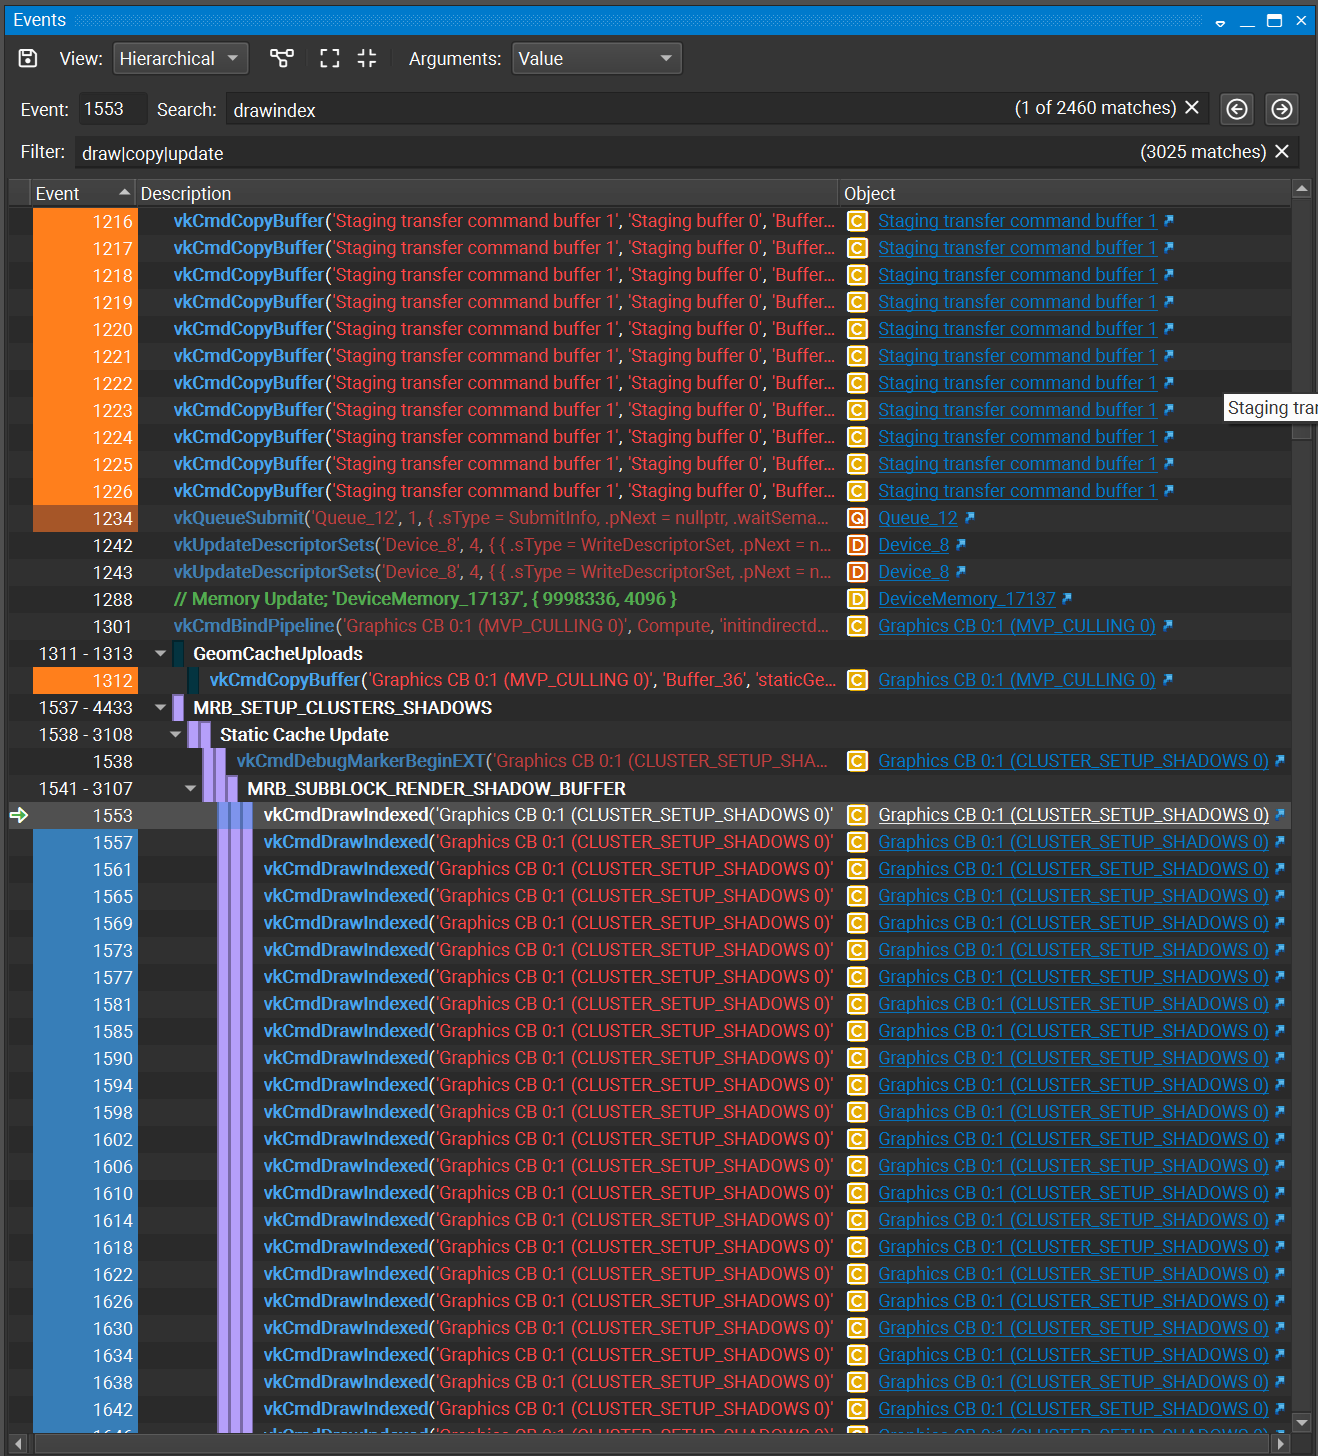
The visibility of columns can be toggled by right-clicking on the table’s header. By default some columns are hidden if they offer no unique data (e.g., single thread) for the captured frame.
Column |
Description |
|---|---|
(Indicator Column) |
Points to the currently scrubbed event |
Event |
The event ID of the API call, operation, or comment for this event. On the left-hand-side, when perfmarkers are used, a perfmarker stack is visually indicated and the ID indicates the range of events contained within this hierarchy level. Hovering over this cell shows the full perfmarker hierarchy. When the event in question is an action, the right-hand-side contains a link to open the event in the API Inspector. |
Description |
Describes the API call, operation, or comment. This column hierarchically lists the event hierarchy as controlled by the usage of Marker APIs. |
Object |
The API object (context, queue, resource, etc.) for which the event was operated on or by. |
CPU ms |
CPU timing for the event in question. When this is a perfmarker range, this indicates an aggregate summation. These timings are provided for reference, as they are not fully accurate due to the impact of capture operations on their timing. Note that tracing tools like Nsight Systems™ are targeted for higher resolution timing. |
Thread |
The thread that performed the API call, operation, or comment. |
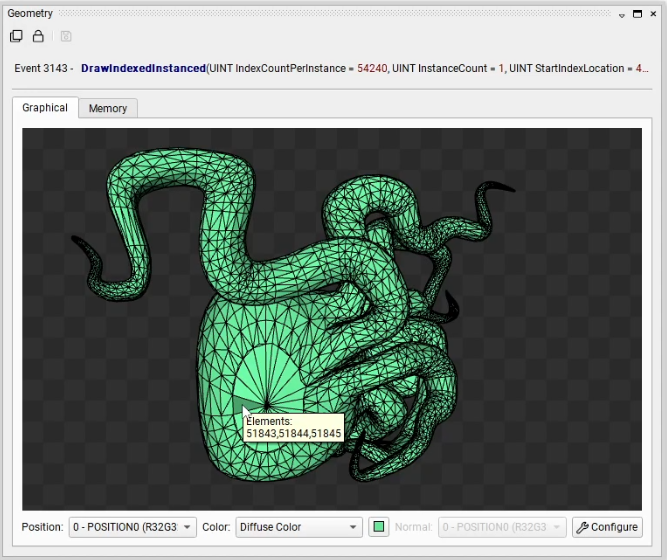
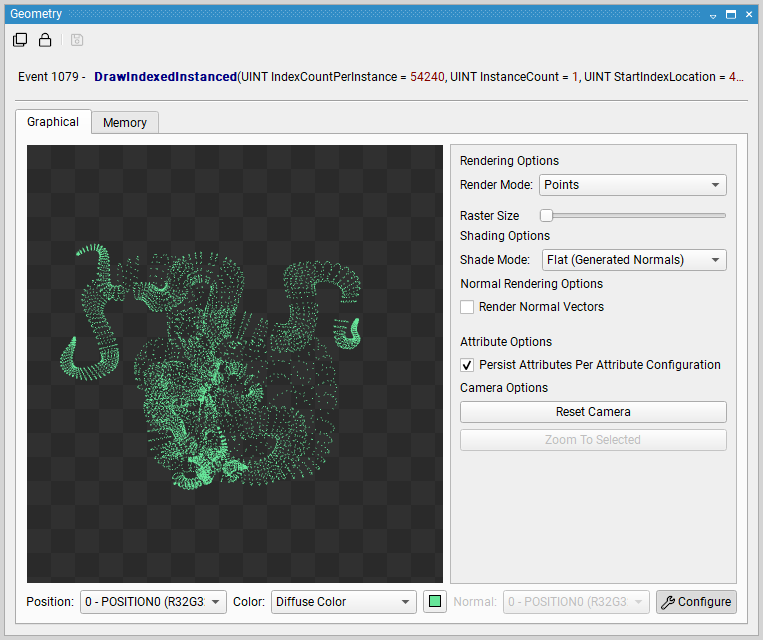
Geometry View#
The Geometry view takes the state of the Direct3D, OpenGL, or Vulkan machine, along with the parameters for the current draw call, and shows pre-transformed geometry.
To access this view, go to Graphics Debugger > Geometry.
There are two views into this data: a graphical view and a memory view.
Graphical Tab
Mouse Events
Hover — Hint the elements of the hovered primitive.
Left Click — Select the primitive or reset the selection if clicking at nothing. When selecting in the graphical viewer, the correlated rows in the memory table are also selected at the same time.
Attribute Options
Position — Specifies the vertex attribute to use for positional geometry data.
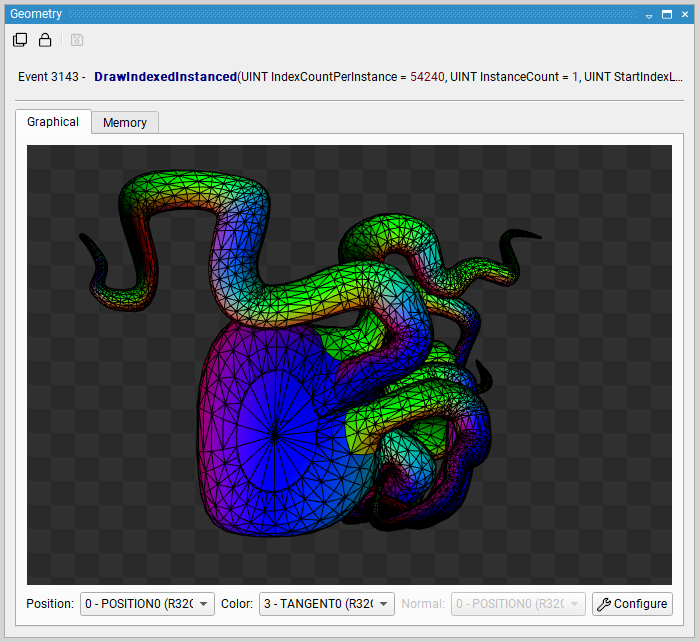
Color — Specifies how to color the geometry. If Diffuse Color is selected, the selected diffuse color swatch is used for coloring. If a vertex attribute is selected, the selected attribute is used for per-vertex coloring.
Normal — Specifies the per-vertex normal. This selection applies when using a shade mode that specifies Normal Attribute or when rendering normal vectors.
Rendering Options
Clicking Configure in the bottom right corner of the Geometry View opens up the rendering options menu.
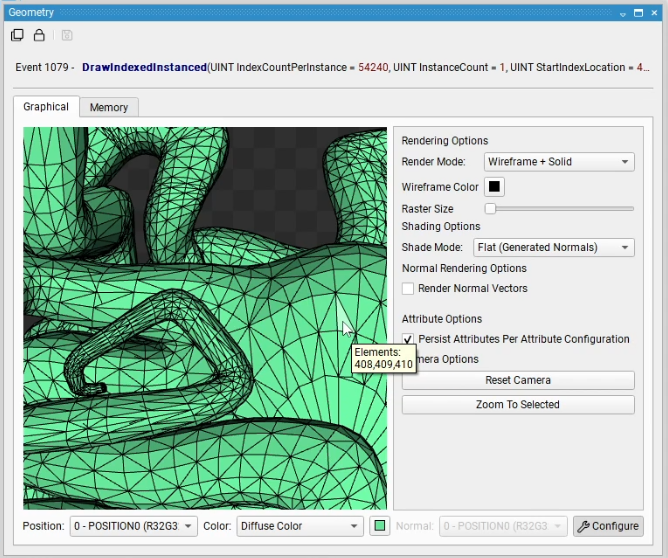
Reset Camera — Resets the camera to its default orientation. By default, the viewer bounds all geometry with a bounding sphere for optimal orientation.
Zoom To Selected — Zoom the camera to the selected primitive.
Render Mode — Determines how to render and raster geometry.
Solid: renders filled geometry.
Points: renders a vertex point cloud.
Wireframe: renders a wireframe of the geometry.
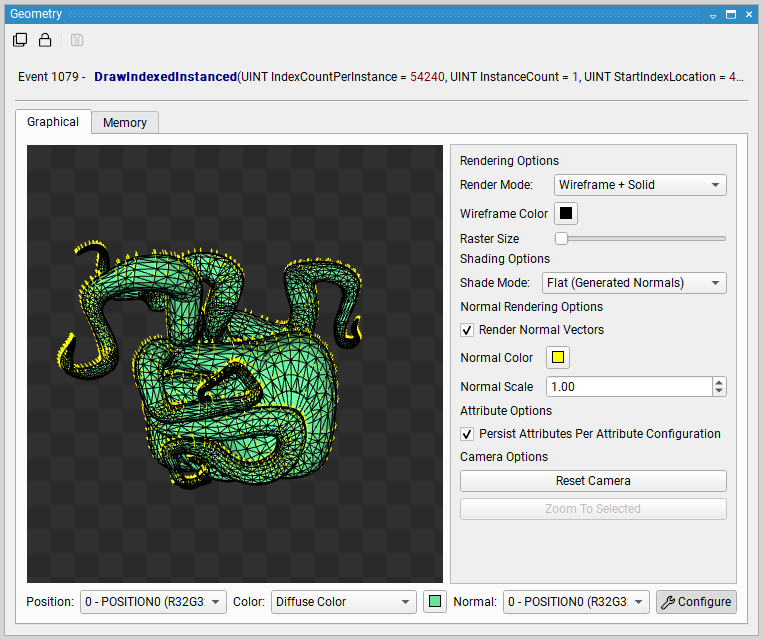
Wireframe + Solid: renders filled geometry with a wireframe on top of it.
Shade Mode — Specifies the lighting mode of the rendered image.
Selected Color Attribute: Shades with the specified color attribute
Flat Shading Using Generated Normals: Renders the geometry using flat shading with calculated normals
Flat Sharing Using Normal Attribute: Renders the geometry using flat shading with the specified Normal Attribute.
Smooth Shading Using Normal Attribute: Renders the geometry using smooth shading with the specified Normal Attribute.
Render Normal Vectors — Renders the specified normal attribute as a vector pointing from each vertex. The vector may be colored by the Normal Color selection and may be scaled by the Normal Scale selection.
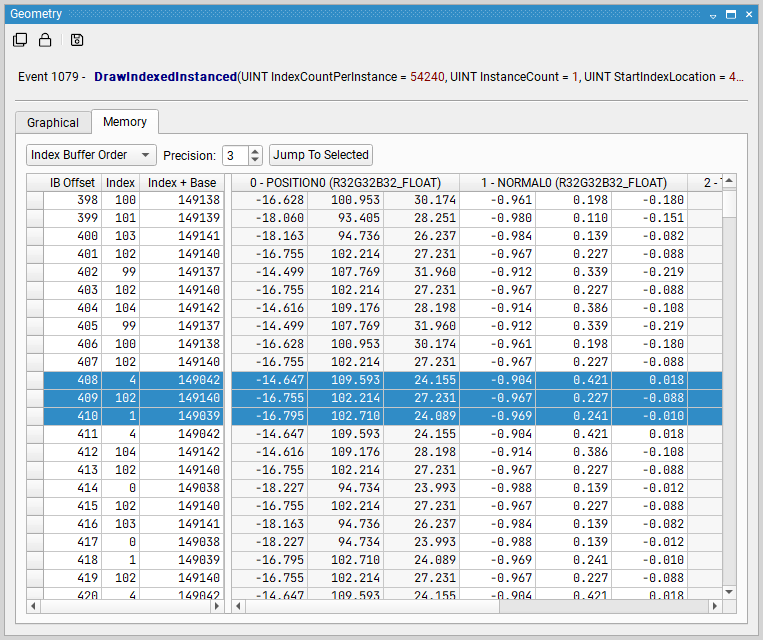
Memory Tab
The Memory tab of the Geometry View shows the contents of the vertex buffer, as interpreted by the current vertex or input attribute specification. This view is useful for seeing the raw data of your draw call. An additional capability of this view is that it highlights invalid or corrupt vertices to streamline finding problematic data. Another useful feature is that the selection linkage to the graphical viewer, where selecting a memory row also selects the associated primitive.
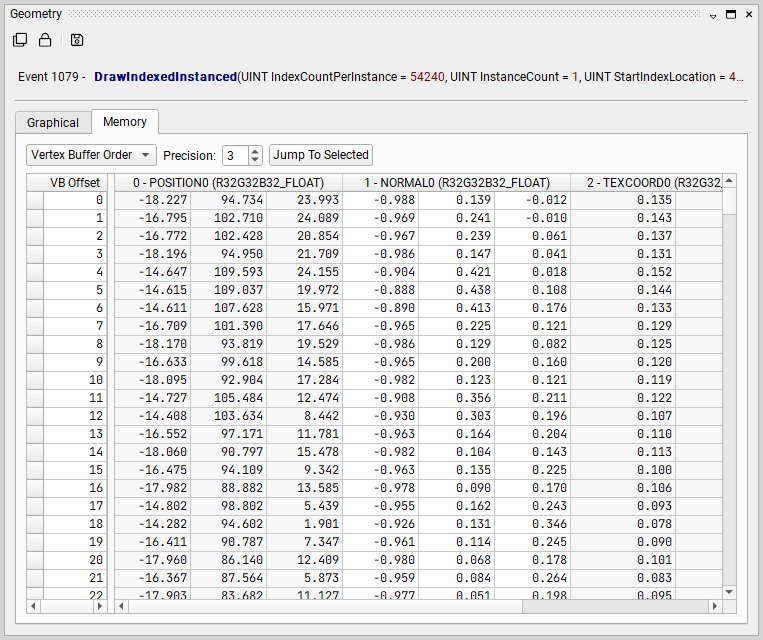
There are two modes of display for the geometry data:
Index Buffer Order shows the vertices as indexed by the current index buffer and current draw call.
Vertex Buffer Order shows the vertices as linearly laid out from the start of the vertex buffer and draw call specification.
Memory View#
The Memory view shows descriptors that are relevant to the current event.
To access this view, go to Graphics Debugger > Memory.
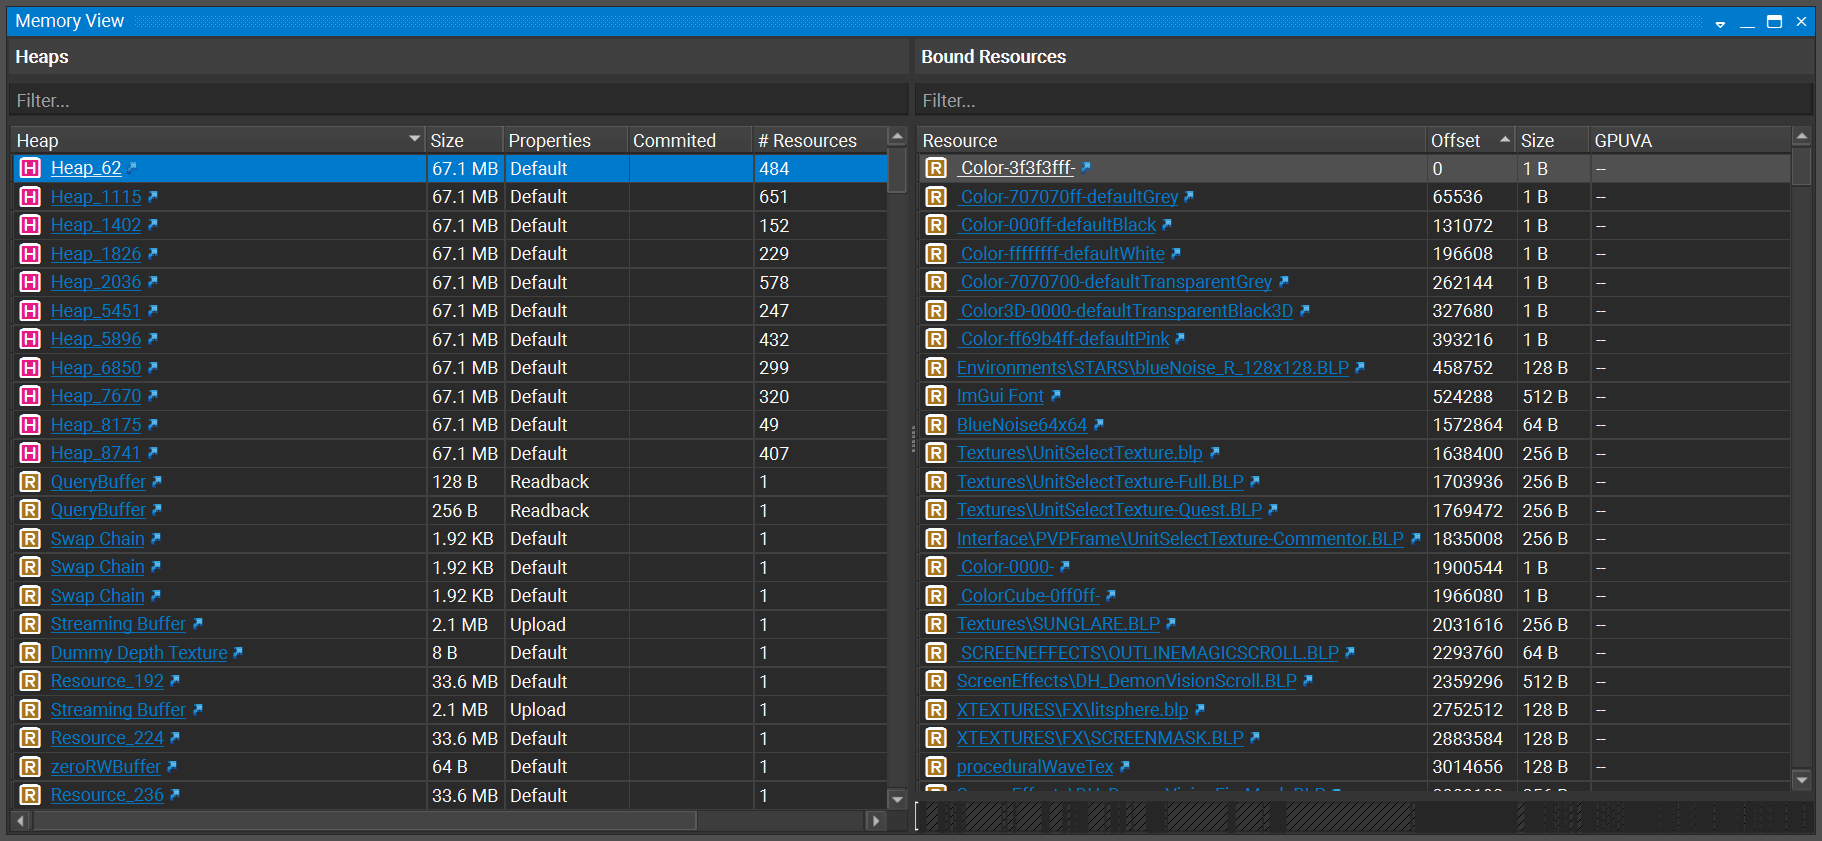
The Memory View shows memory objects created by the application. It indicates their size and properties. For resources that bind other resources, a list of resources is shown on the right-hand side. On the bottom of the right-hand side, a linear indication of the layout and placement of these resources is shown. Resources may be sorted in the table to be able to pick out important features; for example, Heaps with the most resources or resources of the greatest size.
Each resource has a link that may be clicked to gather more information about that resource in the object browser.
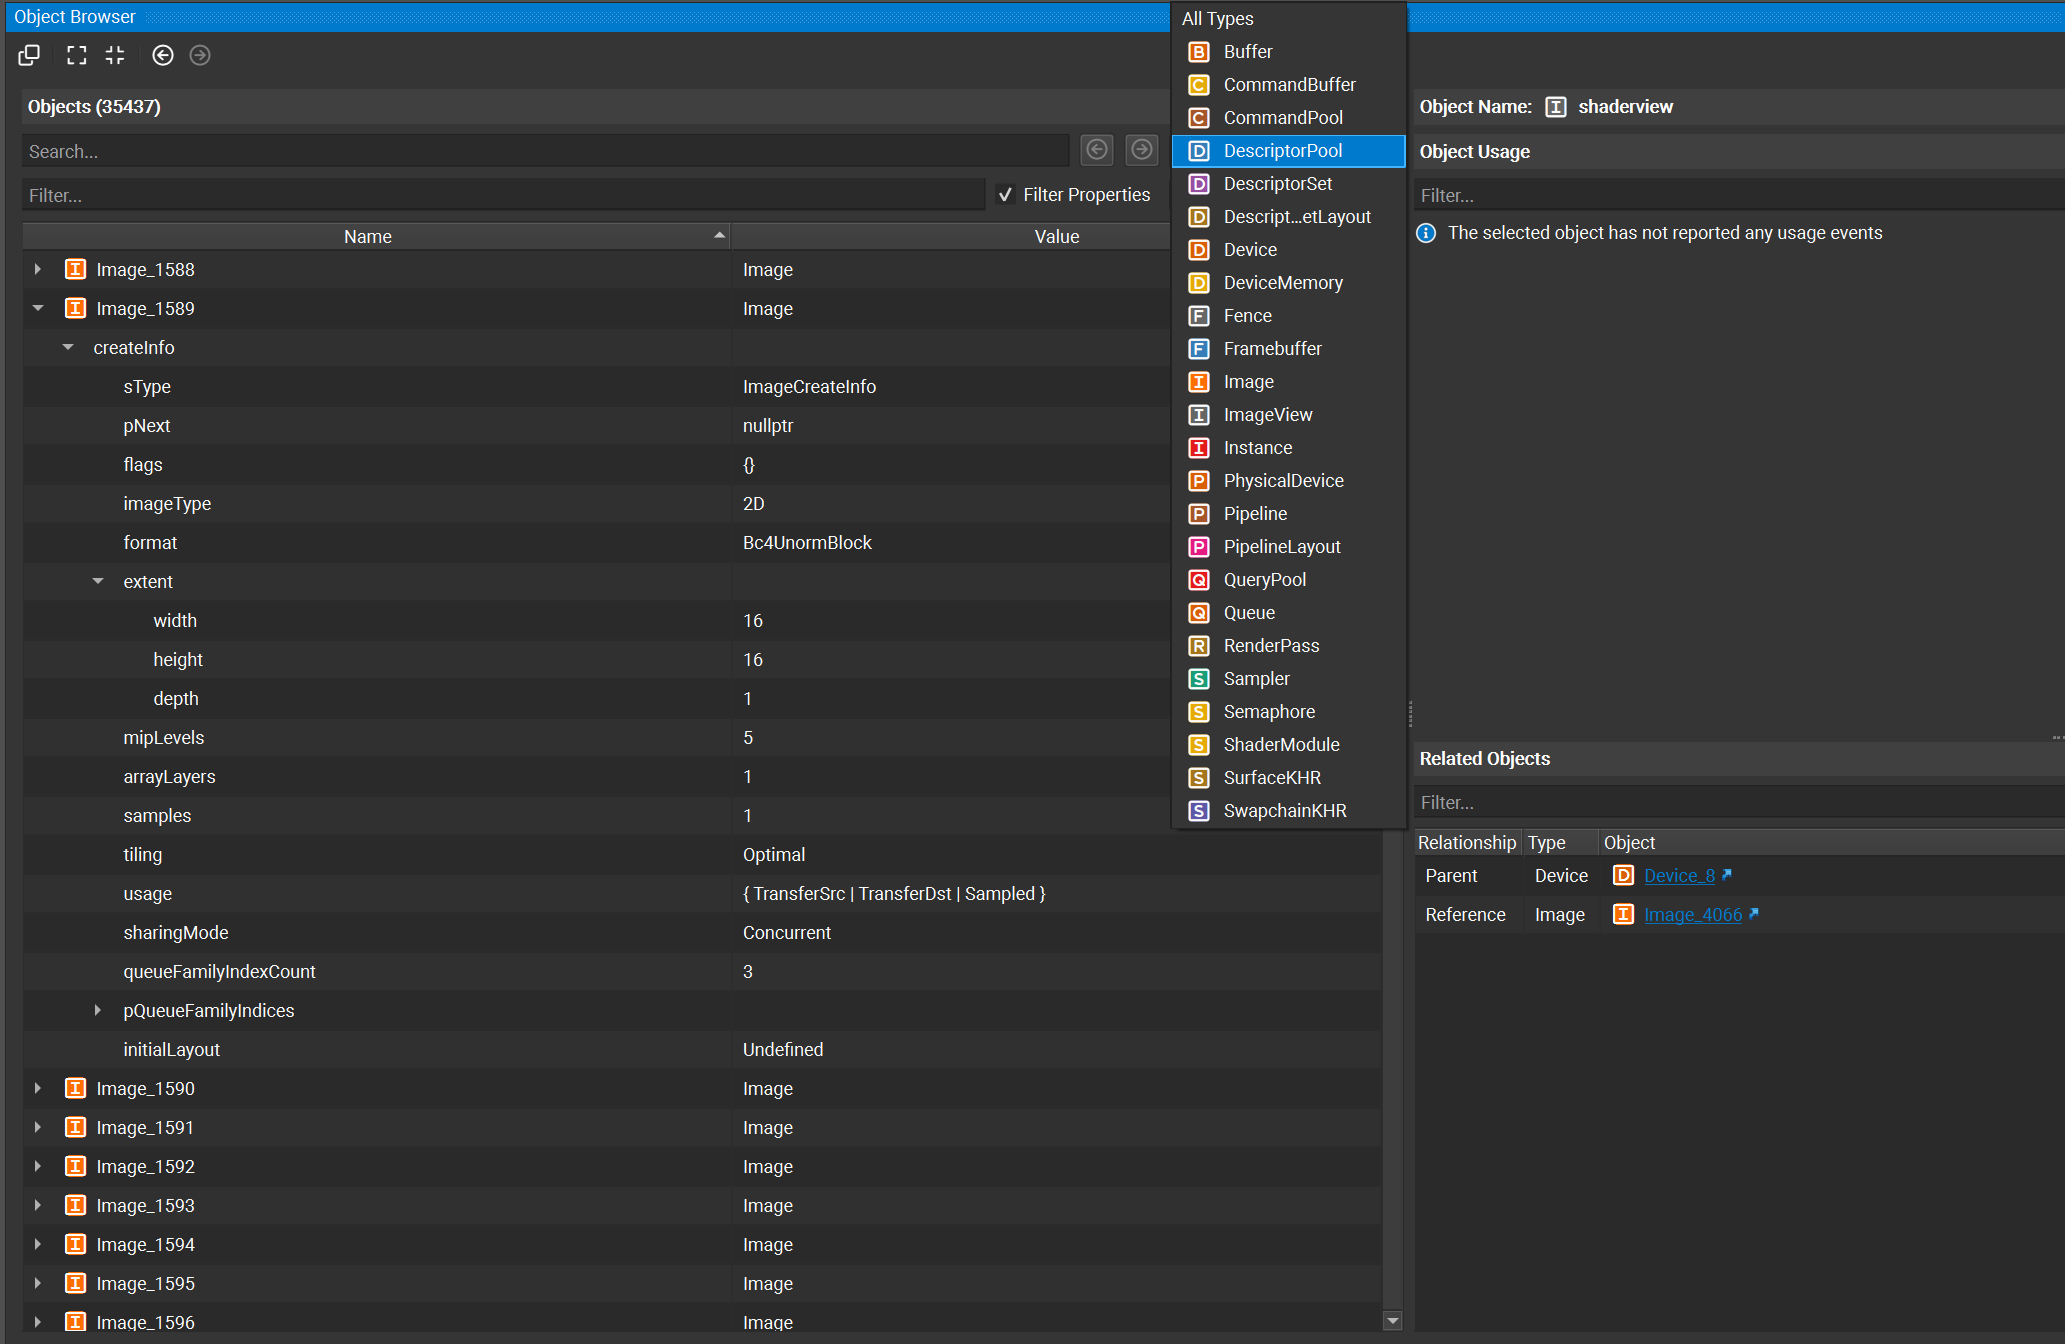
Object Browser#
The Object Browser view provides a list of all objects tracked for your frame, listed by name and by type. Beneath each object is a list of the properties and other metadata that Nsight Graphics tracks. This view is useful for finding objects that utilize a particular kind of property, for example a memory buffer with a particular flag.
To access this view, go to Graphics Debugger > Object Browser. This view is also a destination for links provided by the Event Details and Event Viewer views.
This view supports Clone capabilities. Note, however, that this view captures fixed properties and metadata for each object at the end of frame. For APIs with mutable object properties, such as OpenGL, those properties are not updated in coordination with scrubbing. As such, Lock capabilities are not applicable to this view.
This view provides two panes side-by-side. The left-hand Objects pane provides the object list as well as their properties; the right-hand pane is context-sensitive and provides additional information about the object that is selected on the left-hand side.
Objects Pane#
The objects pane (left-hand side) provides several capabilities for filtering objects:
Object names and properties can be filtered via the filter box.
Object types can be filtered via the types combo box (default is All Types).
Objects can be filtered as to whether they report usages (default is Any # of Usages).
The Filter Properties checkbox determines whether the properties of an object are considered when filtering items in the object tree view.
Object Name#
This section shows the name of the selected object.
When the selected object has a specific viewer for viewing additional information about that type, a link to that specific viewer is provided. For example, texture resources provide a link to opening the selected texture in the Resource Viewer.
Object Usage#
This section lists a table for the events in which an object is used. Each event is tagged to indicate the Usage of that object (READ or WRITE).
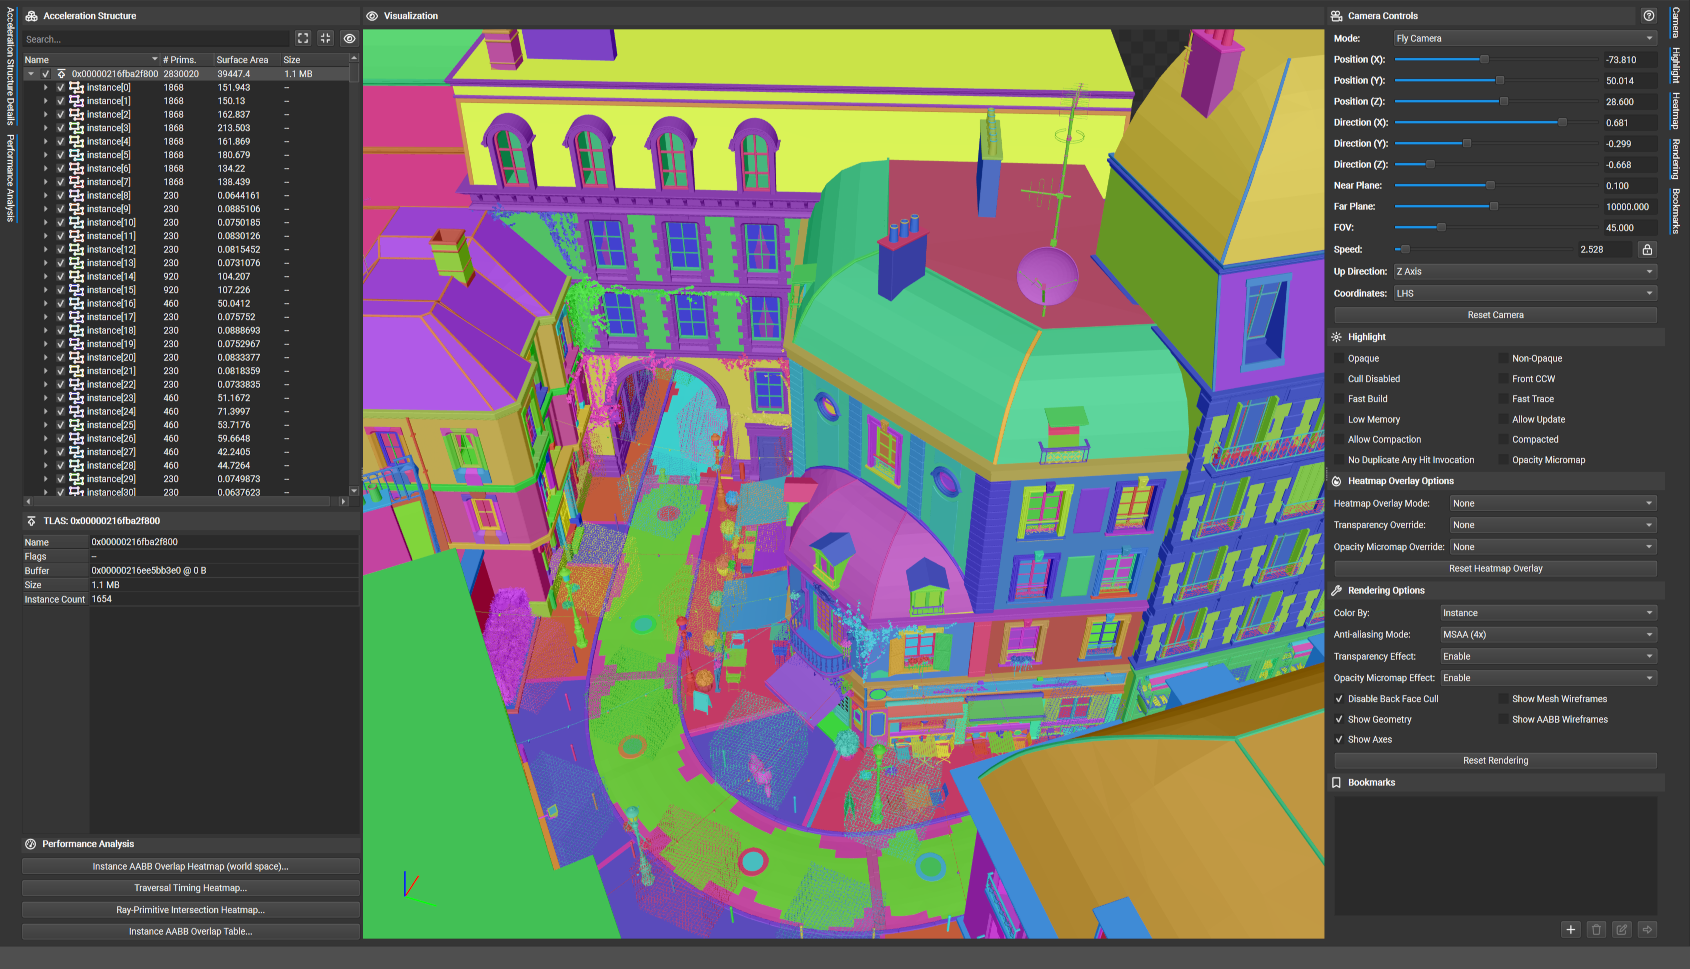
Ray Tracing Inspector#
The Ray Tracing Inspector shows the geometry that has been specified in build commands when running an application that uses ray tracing APIs. If the application does not use these APIs, the view is not available.
In Ray tracing APIs, such as DXR and NVIDIA Vulkan Ray Tracing, an acceleration structure is a data structure that describes the full-scene geometry that is traced when performing the ray tracing operation. This data structure is described in detail in the following links: https://developer.nvidia.com/rtx/raytracing/dxr/DX12-Raytracing-tutorial-Part-1 and https://developer.nvidia.com/rtx/raytracing/vkray.
This data structure is purpose-built to allow for translation to application-specific data structures that perform well on modern GPUs. While constructing this data structure, the developer has the responsibility of constructing the structure correctly and using flags to identify the functional and performance characteristics within it. Needless to say, this can be an error-prone operation.
Nsight Graphics Ray Tracing Inspector allows you to view the structures you are creating, navigate through them, and see the flags that you are using. Additionally, you can filter and colorize the structure to highlight, at a bird’s-eye view, different kinds of geometry.
The Ray Tracing Inspector is opened through links from resource thumbnails or entries in many Nsight views, for example from the API Inspector or All Resources View. For example, the Ray Tracing Inspector can be opened from the API Inspector View when scrubbed to a build event trace rays call. When scrubbed to these events, the view presents a list of the active structures with a link to open each.
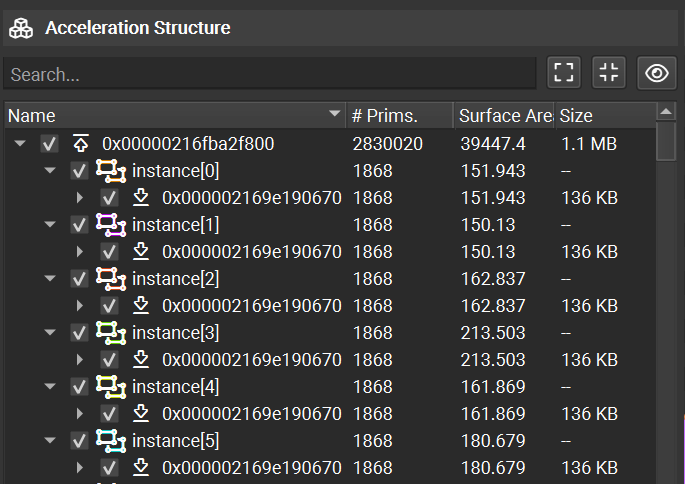
The view is multi-paned — it shows a hierarchical view of the acceleration structure on the left, a graphical view of the structure in the middle, and controls and options on the right. Additionally, a performance analysis section is present on the lower-left. With the hierarchy of the Acceleration Structure tree view, the top-level acceleration structure (TLAS), bottom-level acceleration structures (BLAS), child instances, child geometries, and memory sizes are presented. When a particular item is selected, the name, flags, and other meta-data for this entry are listed in a section on the bottom left-hand side. Each item within the tree has a check box that allows the rendering of the selected geometry or hierarchy to be disabled. Double-clicking on an item jumps to the item in the rendering view and automatically adjust the camera speed to be relative to the size of the selected object.
Column |
Description |
|---|---|
Name |
An identifier for each row in the hierarchy. Click on the check box next to the name to show or hide the selected geometry or hierarchy. Double-click on this entry to jump to the item in the rendering view. |
# Prims |
The number of primitives that make up this geometry. |
Surface Area |
A calculation of the total surface area for the AABB that bounds the particular entry. |
Size |
A calculation of the memory usage for this particular level. Hover over this entry to see a tooltip that includes a roll-up calculation of the aggregate memory usage of this hierarchical level and children below it. |
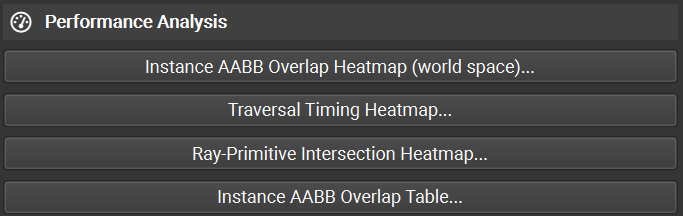
Performance analysis tools are accessible in the bottom left corner on the main view. These tools help identify potential performance problems that are outlined in the RTX Ray Tracing Best Practices Guide. These analysis tools aim to give a broad picture of acceleration structures that may exhibit sub-optimal performance. To find the most optimal solution, profiling and experimentation is recommended but these tools may paint a better picture as to why one structure performs poorly compared to another.
Action |
Description |
|---|---|
Instance Overlaps |
Identifies instance AABBs that overlap with other instances. Consider merging BLASes when instance world-space AABBs overlap significantly to potentially increase performance. |
Instance Heatmap |
Enters a heatmap mode that shows the approximate number of instances AABBs that are hit by a ray cast from each pixel within the current viewport. This mode offers a convenient way to scan your scene for potentially problematic geometries. |
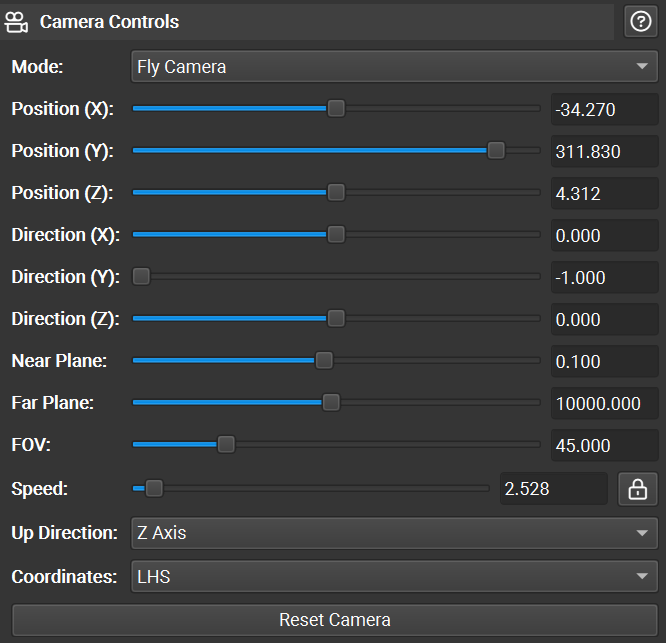
Navigation#
The Ray Tracing Inspector supports multiple navigation modes. The navigation mode can be changed using the combo box in the camera controls pane, to the right of the rendering pane. The keyboard and mouse bindings for each mode are as follows:
Binding |
Fly Camera |
Dolly Camera |
Orbit Camera |
|---|---|---|---|
|
Move forward, backward, left, right |
Move forward, backward, left, right |
Track (Move up, down, left, right) |
|
Move up/down |
Move up/down |
n/a |
|
Increase/decrease field of view |
Increase/decrease field of view |
Increase/decrease field of view |
|
Move faster/slower |
Move faster/slower |
Move faster/slower |
|
Zoom in/out |
Zoom in/out |
Zoom in/out |
|
Rotate in place |
Rotate left/right, move forward/backward |
Rotate around the geometry |
|
Zoom in/out |
Rotate in place |
Zoom in/out |
|
Track (Move up, down, left, right) |
Track (Move up, down, left, right) |
Track (Move up, down, left, right) |
|
Temporarily switch to Orbit Camera |
Temporarily switch to Orbit Camera |
n/a |
|
Focus on the selected geometry |
Focus on the selected geometry |
Focus on the selected geometry |
Based on the coordinate system of the input geometry, you may need to change the Up Direction setting to Z-Axis or the Coordinates setting to RHS. To reset the camera to its original location, click Reset Camera.
There are also a selection of Camera Controls for fast and precise navigation. To save a position, use the bookmarks controls. Each node within the acceleration structure hierarchy can also be double-clicked to quickly navigate to that location.
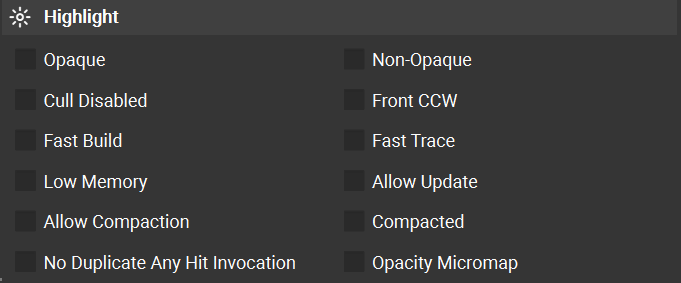
Filtering and Highlight#
The acceleration structure tree view supports geometry filtering as well as highlighting of data matching particular characteristics. The checkboxes next to each geometry allow individual toggling between full rendering, wireframe rendering, and no rendering. Combining this capability with search allows you to identify the geometry of interest (by name when the application has named its resources) and display only that geometry.
Geometry instances can also be selected by clicking on them in the main graphical view. Additionally, right-clicking in the main graphical view gives options to hide/show all geometry, hide the selected geometry, or hide all but the selected geometry.
Beyond filtering, the view also supports highlight-based identification of geometry specified with particular flags. Checking each Highlight option identifies those resources matching that flag, colorizing for easy identification. Clicking an entry in this section dims all geometry that does not meet the filter criteria, allowing items that do match the filter to stand out. Selecting multiple filters requires the passing geometry to meet all selected filters (e.g., AND logic). Additionally, the heading text is updated to reflect the number of items that meet this filter criteria.
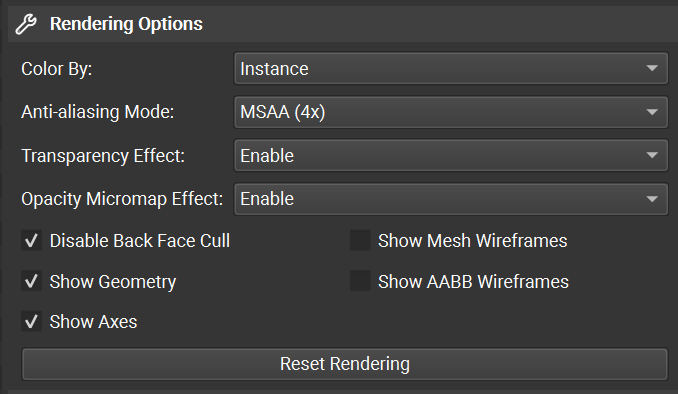
Rendering Options#
Under the highlight controls, additional rendering options are available. These include methods to control the geometry colors and the ability to toggle the drawing of AABBs.
Performance Analysis#
The Ray Tracing Inspector has a number of tools that support performance analysis of your accelerations structures.
Navigation |
|
|---|---|
|
Disable the current performance analysis mode |
|
Enable Instance AABB Overlap Heatmap (world space) |
|
Enable Traversal Timing Heatmap |
|
Enable Ray-Primitive Intersection Heatmap |
|
Enable Instance AABB Overlap Table |
|
Alternate between the current and previous performance analysis mode |
Instance AABB Overlap Heatmap (world space)
This tool helps identify world-space AABB overlaps with the goal of helping a developer reduce expensive overlap.
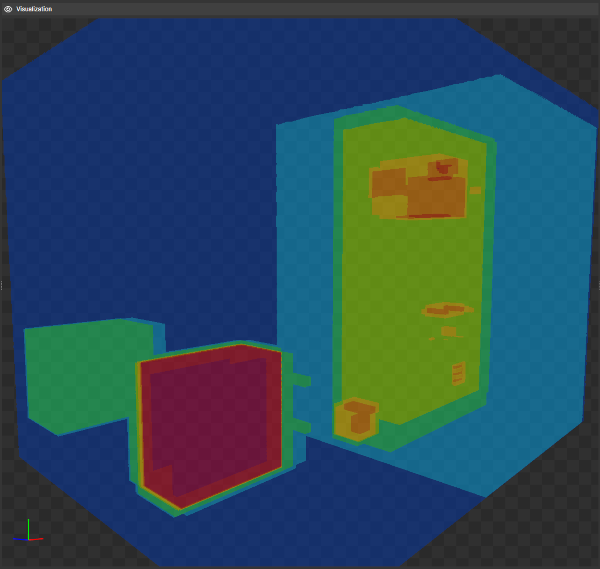
This heatmap overlay shows the maximum number of instance AABBs that overlap in world space for any direction within the current viewport. The more instances hit, the hotter the color. The heatmap threshold can be controlled by “Heatmap Overlay Options -> AABB Threshold” and depends on the number of instance AABBs overlapping.
When world-space AABBs of instances overlap, unnecessary BLAS traversal maybe required. If these overlaps are caused by empty space within a BLAS, consider splitting the BLAS such that this empty space is minimized. If these overlaps are caused by non-opaque geometries, minimize the area not marked as opaque to increase performance.
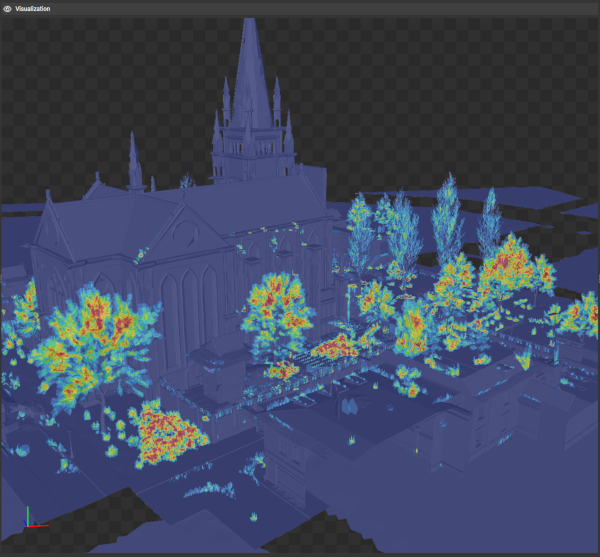
Traversal Timing Heatmap
This tool provides a heatmap of ray traversal time with the goal of identifying expensive geometry.
This heatmap overlay shows the number of GPU clock cycles required to trace a ray from the center of each pixel in the viewport to the closest geometry hit. The heatmap threshold can be controlled by “Heatmap Overlap Options -> Timing Threshold” and depends on the traversal speed of the current acceleration structure.
To determine how certain geometry affects the ray traversal speed, geometry can be hidden in which case it is ignored by this algorithm. Additionally, setting “Heatmap Overlay Options -> Opacity Override” to “Force Opaque” traverses the acceleration structure as if all geometry is opaque.
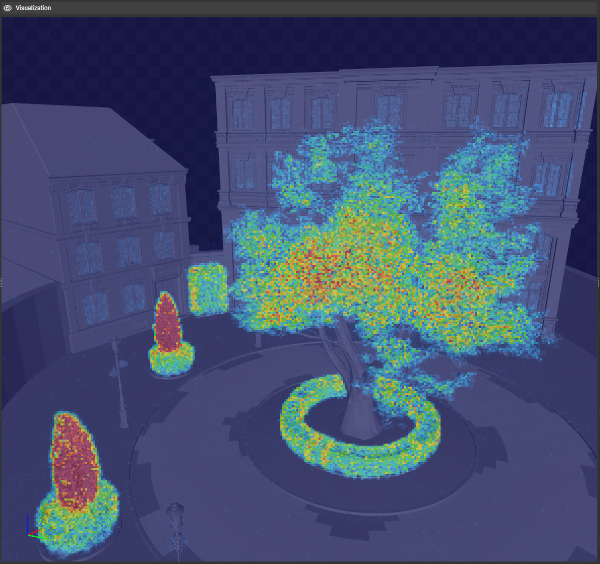
Ray-Primitive Intersection Heatmap
This tool provides a heatmap of ray geometry intersection with the goal of identify expensive geometry.
This heatmap overlay shows the number of surfaces hit by a ray traced into the scene from the center of each pixel. The more surfaces hit, the hotter the color. In this mode, opaque geometry terminates a ray. The heatmap threshold can be controlled by “Heatmap Overlay Options -> Intersection Threshold.” When geometry is not marked as opaque, a ray must be traced through all surfaces of that geometry until an opaque surface is hit. To minimize intersection tests, use the opaque geometry flag wherever possible, or use opacity micromaps the mask off opaque sections of non-opaque geometry.
Instance AABB Overlap Table
This table provides information on overlap to allow you to consider merging BLASes when instance world-space AABBs overlap significantly.
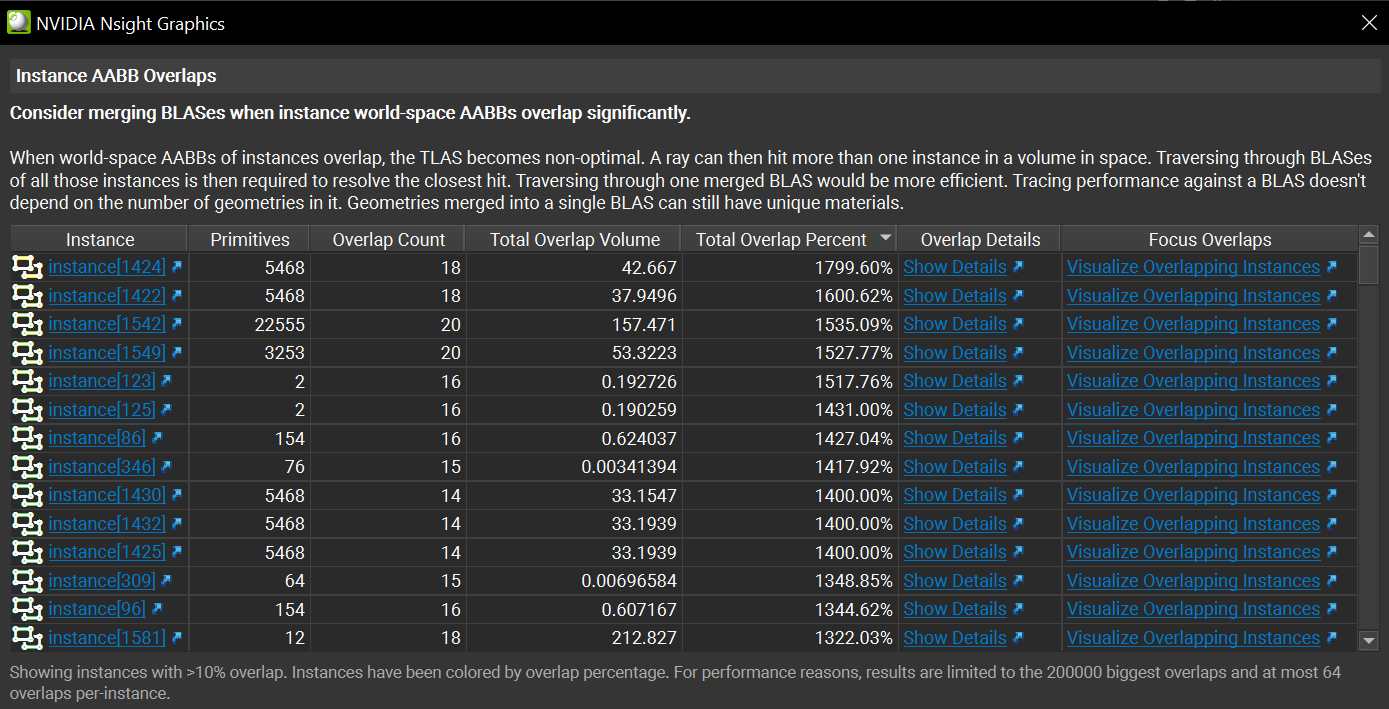
When world-space AABBs of instances overlap, the TLAS becomes non-optimal. A ray can then hit more than one instance in a volume in space. Traversing through BLASes of all those instances is then required to resolve the closest hit. Traversing through one merged BLAS would be more efficient. Tracing performance against a BLAS doesn’t depend on the number of geometries in it. Geometries merged into a single BLAS can still have unique materials.
Export#
Exporting the view, by clicking on the Save (disk) icon in the upper left of the view toolbar, allows for persisting the data you have collected beyond the immediate analysis session. This capability is particularly valuable for comparing different revisions of your geometry or sharing with others. Bookmarks are persisted as well. An example use case is identifying sub-optimal geometry, bookmarking it, and passing this document to a level designer or artist for correction.
Resource Viewer#
The Resource Viewer allows you to see all of the available resources in the scene. This view is brought up by clicking resource links in any graphics debugging view.
The Resource Viewer is opened through links from resource thumbnails or entries in many Nsight Graphics views, for example from the API Inspector.
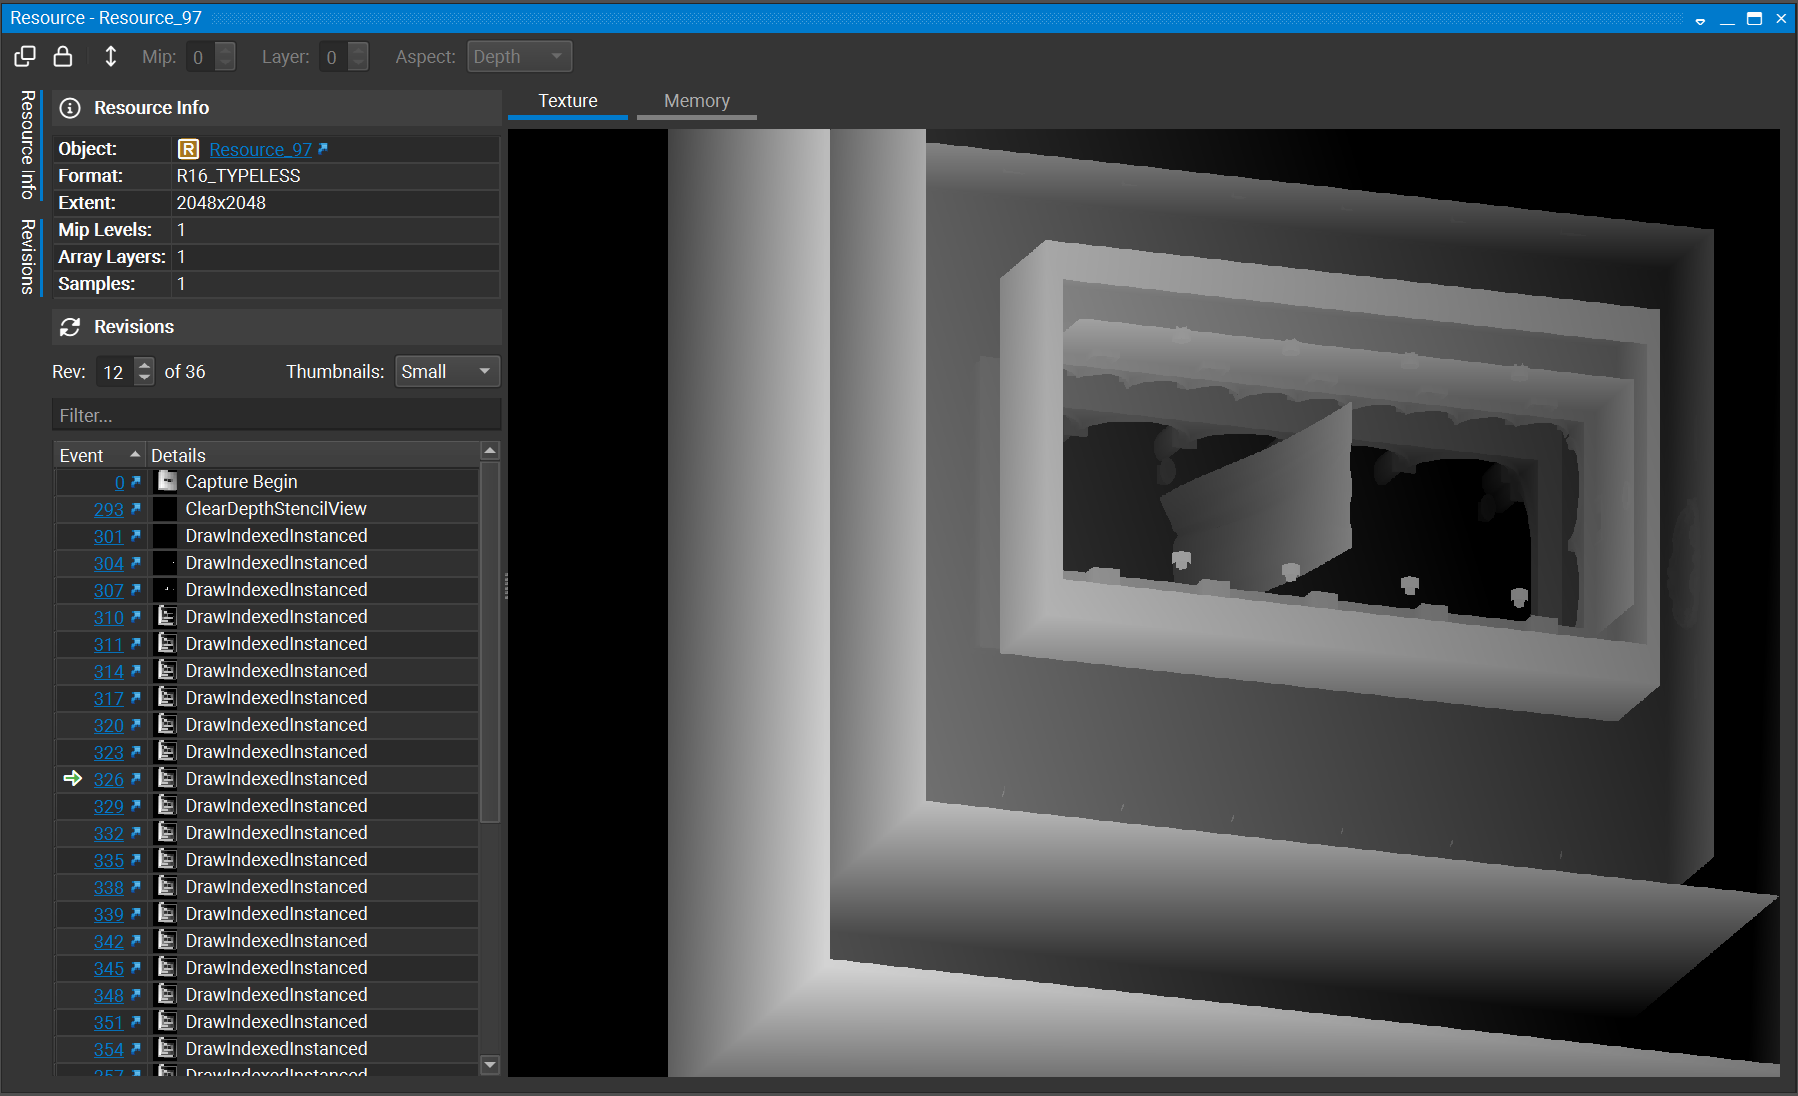
On the left-hand side, there is a Resource Info panel that shows properties of the resource, and below it a Revisions panel that shows revisions of the data and allows scrubbing between them.
On the right-hand side, there are two tabs available:
Graphical
Memory
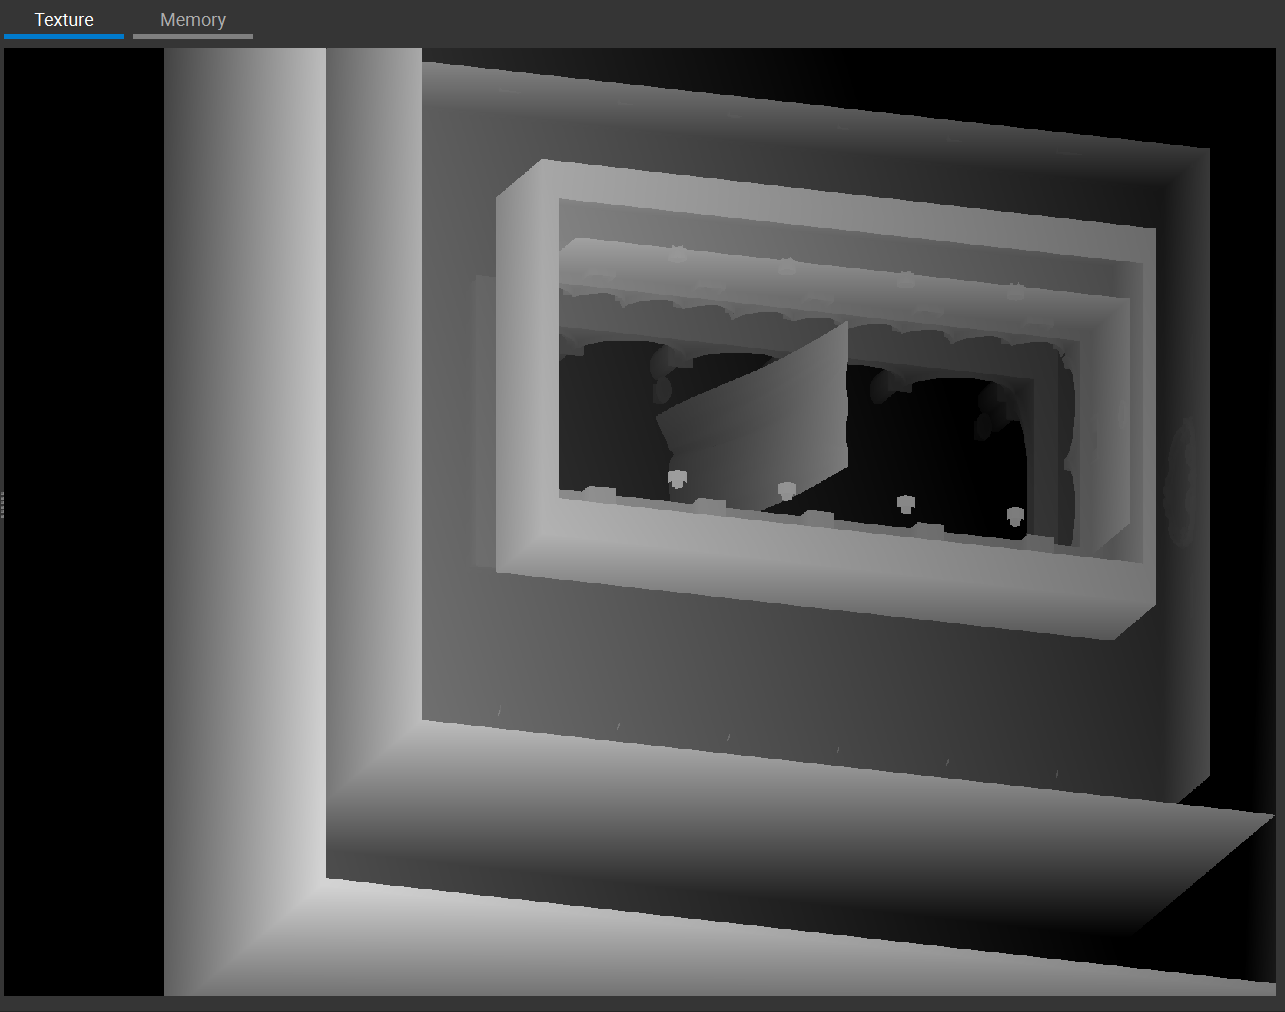
Graphical Tab
The Graphical tab allows you to inspect the resource, pan using the left mouse button to click and drag, zoom using the mouse wheel, and inspect pixel values. Also, this is where you can save the resource to disk.
Within the Graphical tab, there is a panel on the right-hand side that contains the following sections: Visualization, Histogram, and Pixel Info.
Visualization
The Visualization panel contains controls to set the data format, color channels and blending strategy, as well as zoom, flip, and gamma.
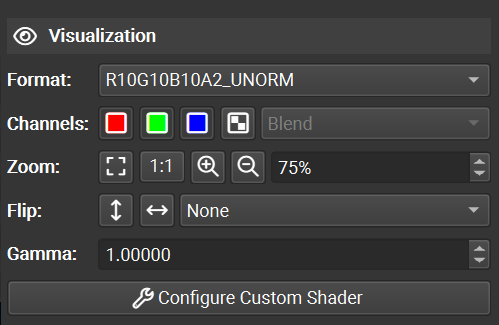
Each of these controls allows you to adjust the visualization of the resource to best meet your needs. Additionally, the panel contains an ability to configure a custom shader to visualize your resource. At present, this custom shader only supports GLSL, but may receive future updates to support further shading languages.
Histogram
The Histogram panel contains a histogram of each of the color channels of the resource.
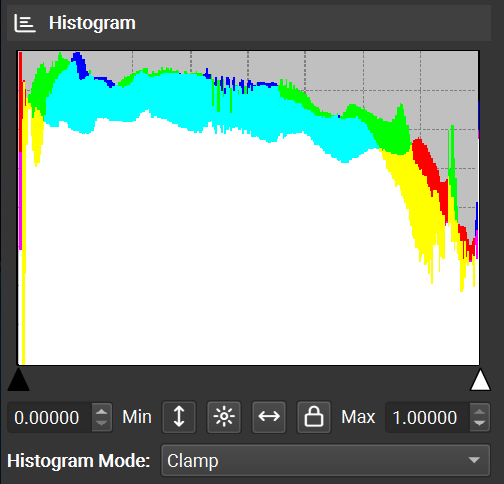
To modify the histogram view, the following options are available:
You can set the minimum and maximum cutoff values via the sliders under the histograms, or by typing in values in the Minimum and Maximum boxes.
You can change the scale by using the Log button.
The Luminance button allows you to visualize luminance instead of color values.
The Clamp button can preset the minimum and maximum values to the extents of the data in the resource.
Pixel Info
The Pixel Info panel contains a viewer that shows a selected pixel alongisde its neighbors.
This panel is useful for investigating pixel values and their positions.
Pixel History
Pixel history enables the detection of the events that contributed to the change in a pixel’s value.
To run a pixel history test, right-click to select a pixel of interest. Then, click the Pixel History button. The Pixel History view comes up with a loading bar and presents the results once they are complete.
Memory Tab
The Memory tab shows a dump of the resource data.
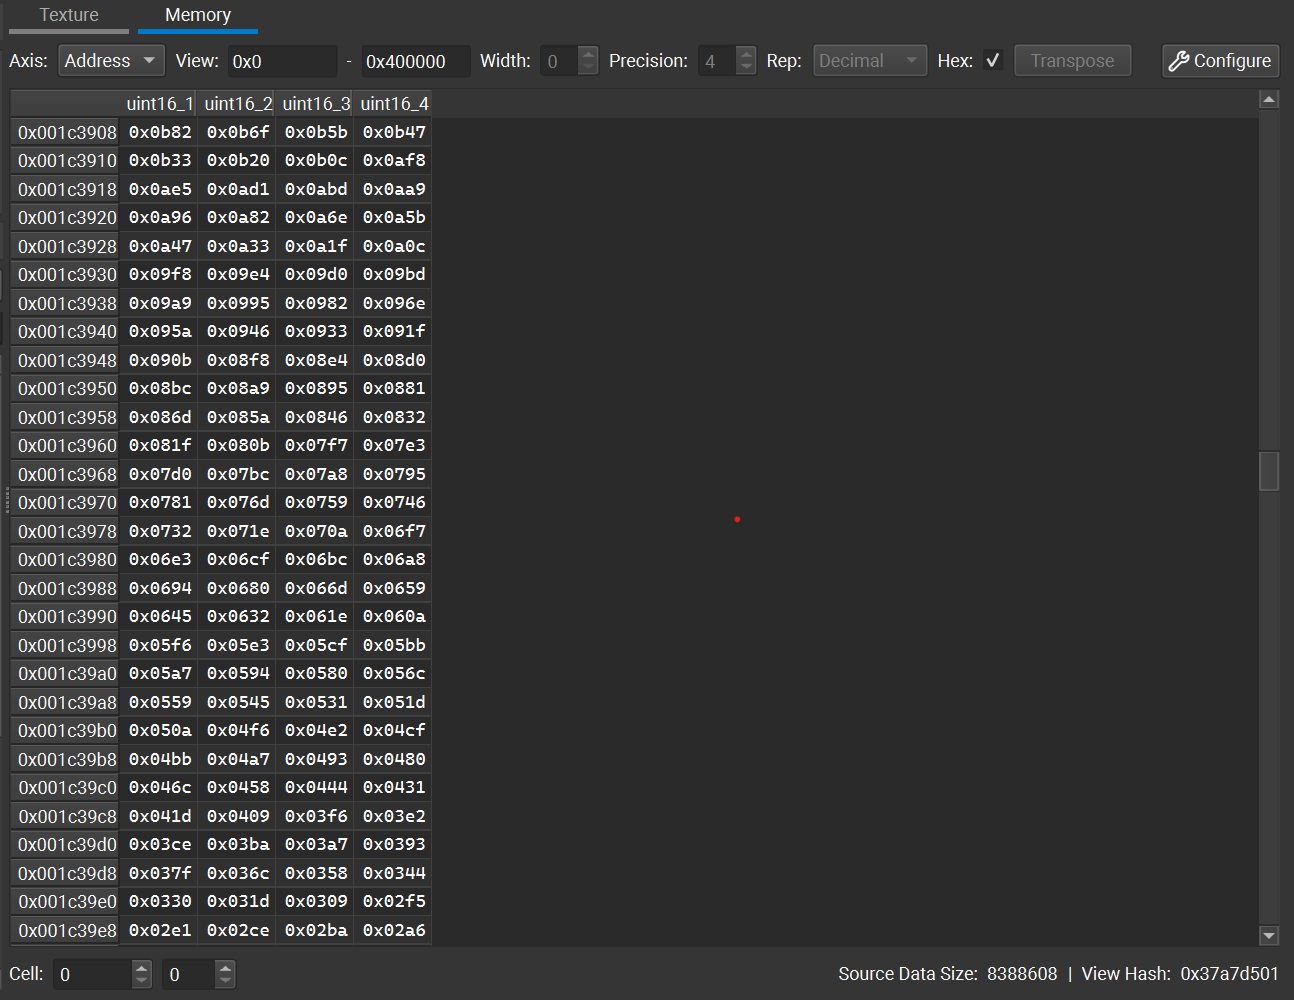
You can use multiple options to configure how this memory is displayed:
The Axis drop-down changes between address (memory offset) and index (array element) views.
The Offset entry limits the view to an offset within the given resource.
The Extent entry limits the view to a maximum extent within the given resource.
The Precision spin box controls the number of decimal places to show for floating point entries.
The Hex Display toggles between decimal (base-10) and hex (base-8) display formats.
Hash shows a hash value representative of the given memory resource within the current offset and extent. This is useful for comparing memory objects or sub-regions.
The Transpose button swaps the rows and columns of the data representation.
The Configure button opens the Structured Memory Configuration dialog.
Additional Capabilities
There are a number of additional capabilities in this view. At the top of the viewer, there is a toolbar:
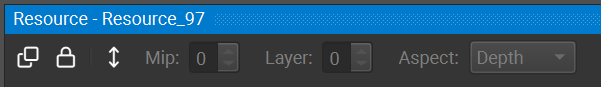
Clone — makes a copy of the current view, so that you can open another instance.
Lock — freezes the current view so that changing the current event does not update this view. This is helpful when trying to compare the state or a resource at two different actions.
Mip — Change the viewed mip level of the resource.
Layer — Change the viewed layer of the resource.
Aspect — Change the viewed aspect of the resource.
Root Parameters#
The Root Parameters view displays all of the root parameters bound for the current event. This allows you to quickly change the state of what you’re sampling from, constants, and other descriptors at a lightweight, faster rate than past APIs.
To access this view, go to Graphics Debugger > Root Parameters.
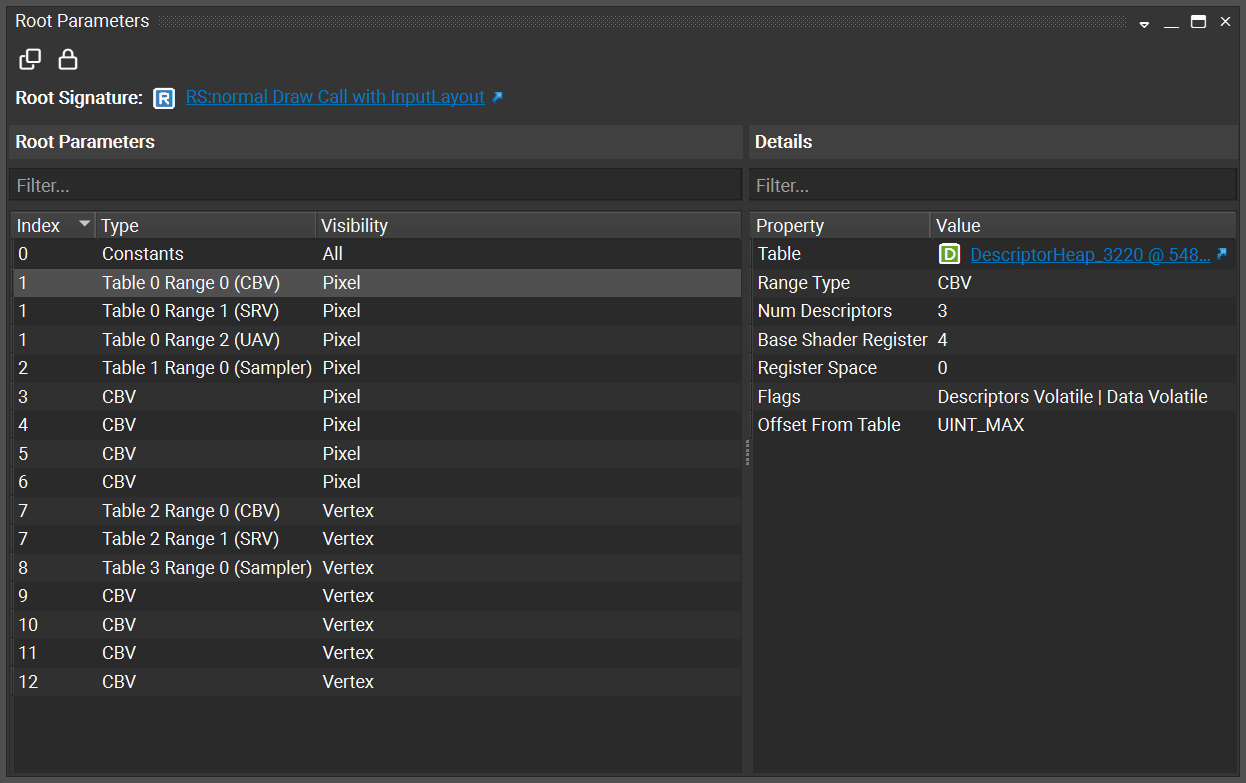
The root signature displays the structure definition of what’s bound at that moment. Root parameters fill in that structure with the values you’re sampling from and the constants you’re using.
The view can link out to other object-specific viewers, such as the descriptor view, the resource view, the object browser, or memory views.
Scrubber#
The Nsight Graphics Capture Debugger Scrubber allows you to visually identify your frame(s) characteristics and select events to analyze.
To access this view, go to Graphics Debugger > Scrubber.
Understanding the Frame Scrubber#
For the sake of discussion when it comes to graphics debugging, it helps to note some common terminology.
An event is a single call to the API. It could be a triangle draw call, or backbuffer clear, or a less obvious call, like configuring buffers. A snapshot is a sequence of events.
An action is a subset of the event types. It can be one of the following: (1) Draw Call, (2) Clear, or (3) Dispatch. Actions are interesting since they explicitly change data which may result in visual changes.
When you debug your graphics project, the Scrubber window shows the perf markers you implemented. When working with user-defined markers, the Scrubber window uses the color and label that you defined for the perf marker.
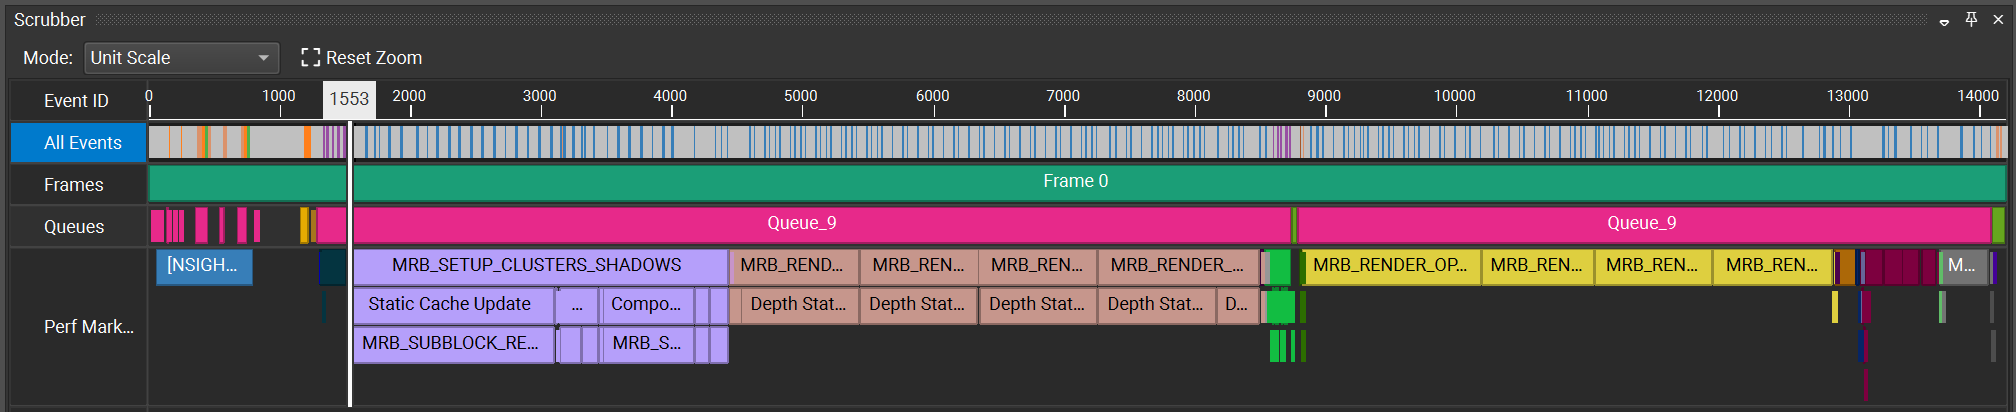
On the Scrubber, you can select one performance marker and it automatically creates a range of all of the draw calls that occurred within that time frame. Clicking on it again causes the scrubber to automatically zoom to that range of events. You can zoom in on a nested/child marker the same way.
To zoom out, click the parent performance marker, or use CTRL + mouse wheel.
Performance markers are also displayed on the HUD, color-coded the same way that they are on the Scrubber. However, on the HUD, the information is condensed, and you must hover your mouse over the selected performance marker to get its details.
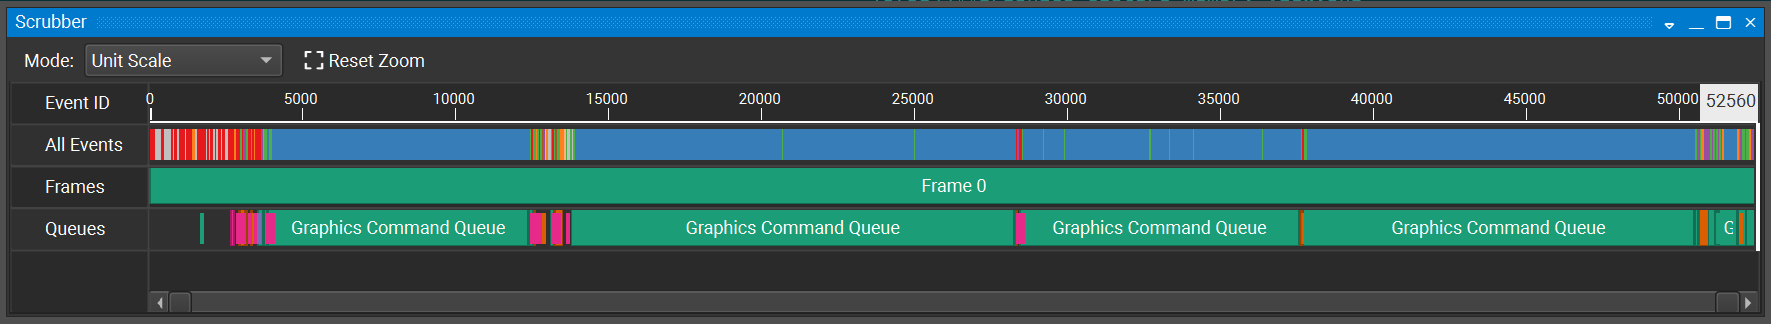
The Scrubber has several visualization modes. To change the visualization mode, choose one of the following from the Mode dropdown menu:
Unit Scale is the default view, which simply shows the actions and events on the timeline.
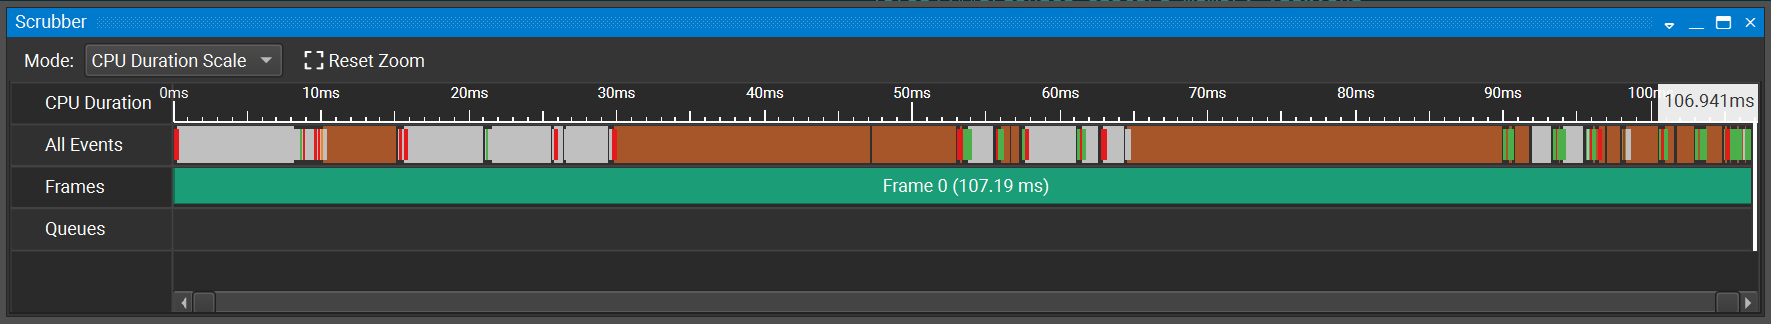
CPU Time Scale displays the CPU activity and how much each event or action cost the CPU.
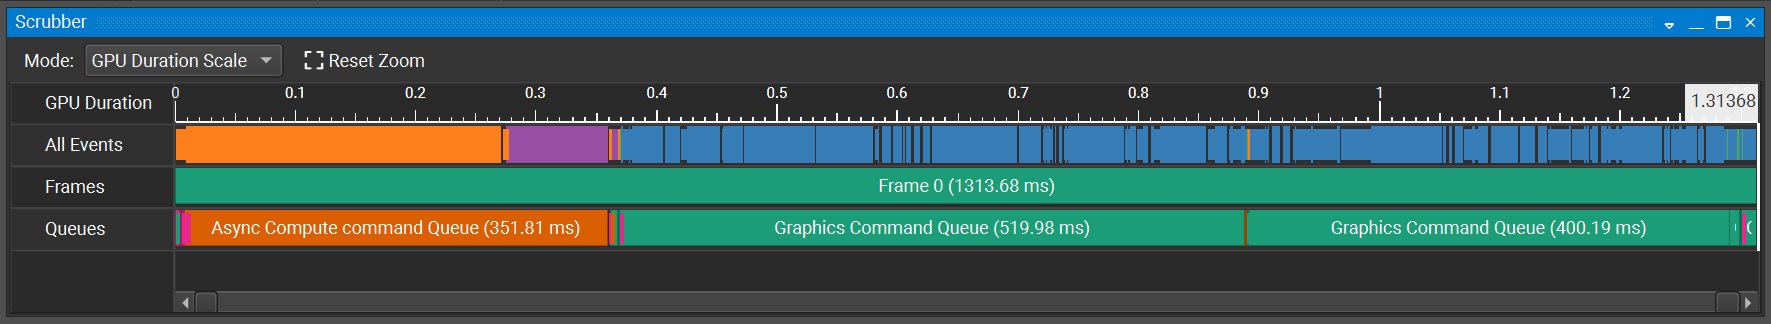
GPU Time Scale displays the GPU activity and how much each event or action cost the GPU. This mode is only available when in Live Replay and event timings are colleted.
Using Hotkeys to Scrub Through a Frame
When the scrubber has focus, you can use the following hotkeys to move the scrubber cursor from one event to another.
Navigation |
|
|---|---|
|
Go to the first event. |
|
Go the last event. |
|
Go to the previous event. |
|
Go to the next event. |
|
Expand the current event group (HUD only). |
|
Collapse the current event group (HUD only). |
|
Current event: show less information (HUD only). |
|
Current event: show more information (HUD only). |
Zooming and Panning |
|
|
Zoom in X-axis |
|
Zoom out X-axis |
|
Reset zoom |
|
Increase row height (all rows) |
|
Decrease row height (all rows) |
|
Pan |
|
View zoom window |
Cursor and Selection |
|
|
Set cursor(Places cursor at closest point to the start of a range.) |
|
Select row (The selected row is highlighted in orange.) |
|
Make range selection |
|
Zoom to range |
|
Open API Inspector |
CTRL + A |
Select all events |
For the purpose of moving the scrubber cursor, the following are considered action events:
Draw methods
Clear methods
Dispatch methods
Present methods
For example, if you are looking for the next draw method that was called, you can press the CTRL + RIGHT ARROW on the keyboard to skip over events that are not typically of interest, and only stop on events that are considered action events.
Shader Browser#
The Shader Browser lists all of the shaders in your application.
To access this view, go to Graphics Debugger > Shader Browser.
For programs or pipeline objects, you can view the individual shaders by pressing the ► button to the left of the program/pipeline name. When expanded, you can select the link to open a text view of the shader source (when available).
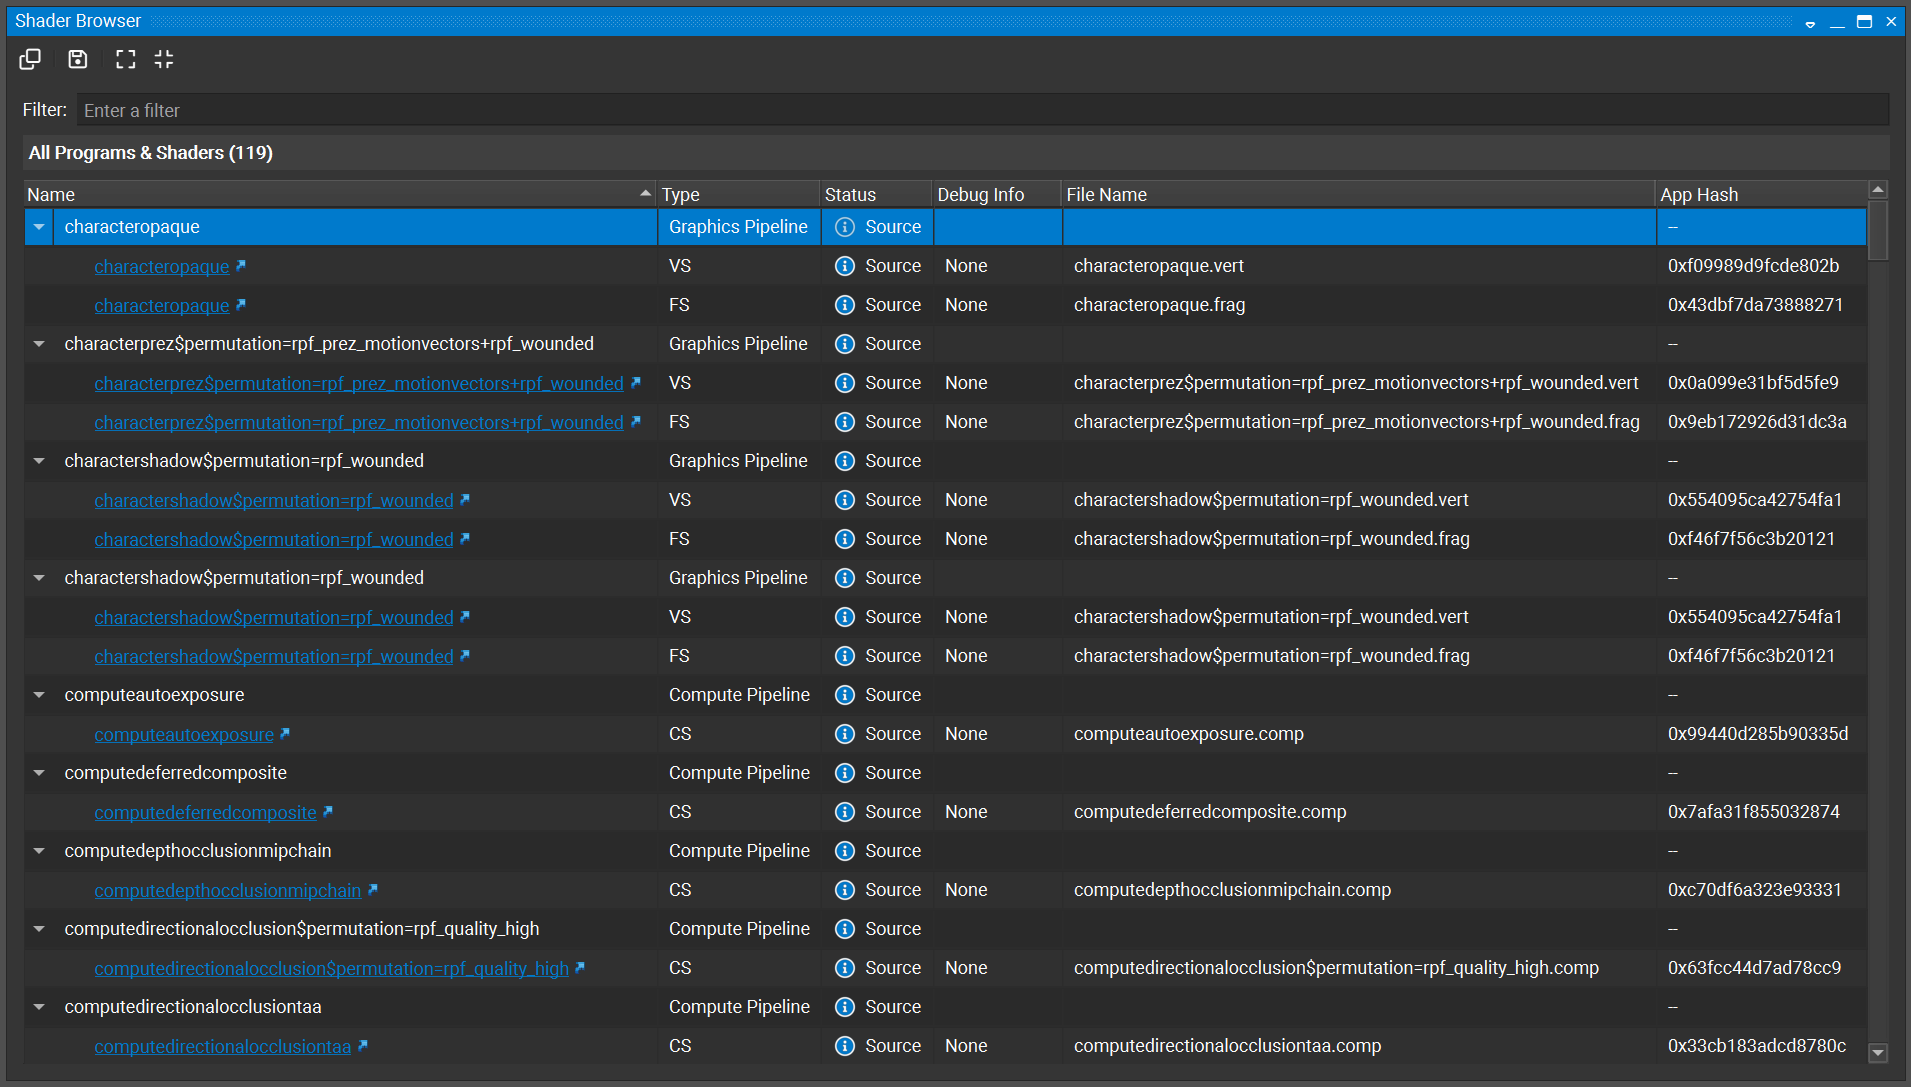
Name
This is the name of the shader. This name is either generated internally, or can be assigned by the user per API.
Type
The type of the shader: Vertex, Pixel, Compute, etc.
UID
Indicates a unique object ID for the associated pipeline or shader.
Context
Indicates to which of the application’s contexts this shader is owned. Shown only on multi-context OpenGL applications.
Status
This column displays the current status of the shader. The status includes Source or Binary, to denote whether or not source code is available for this shader. Also, if the microcode text is included, this means that we have driver-level binary code that is necessary for gathering shader performance metrics.
Debug Info
This column indicates the availability and load status of debug information for the associated shader.
File Name
Lists the file name from which the shader was compiled for those shaders with debug info that provide this information.
App Hash
This column displays a unique hash of application level shader information (e.g., bytecode).
Shader View#
The Shader View provides a source code view of an individual shader, along with a capability of editing a shader to see how changes to the shader affect rendering.
To access this view, click a link to a shader from either the Shader Browser or the API Inspector.
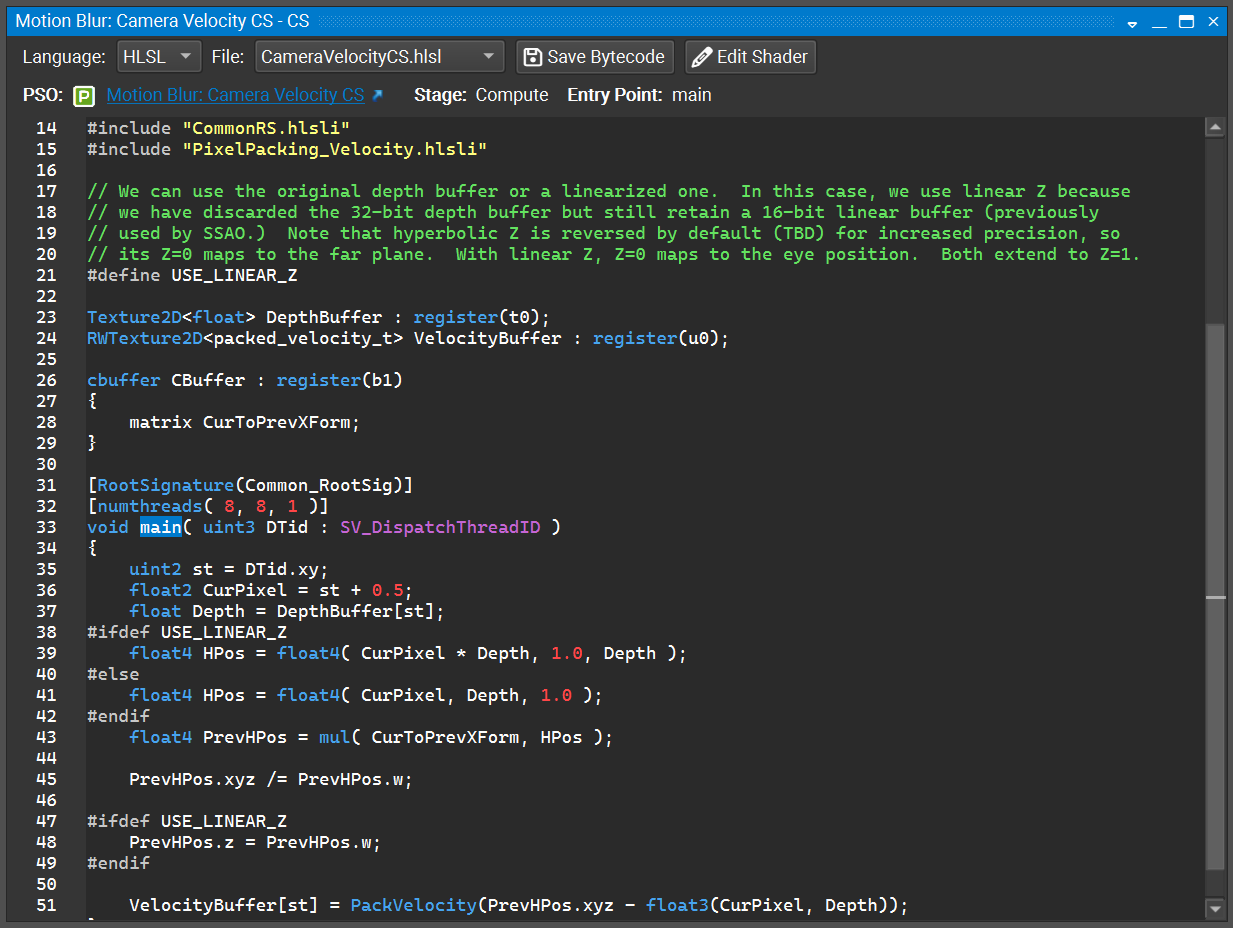
The Shader View gives an indication of the language a shader is written in, as well as links to the pipeline that the shader is associated with. Shaders that are composed from multiple files will have a combo box that lists all of the files that make up the shader, allowing you to switch between them.
Shader Editing#
Shaders may be editing to see how changes to the shader affect rendering.
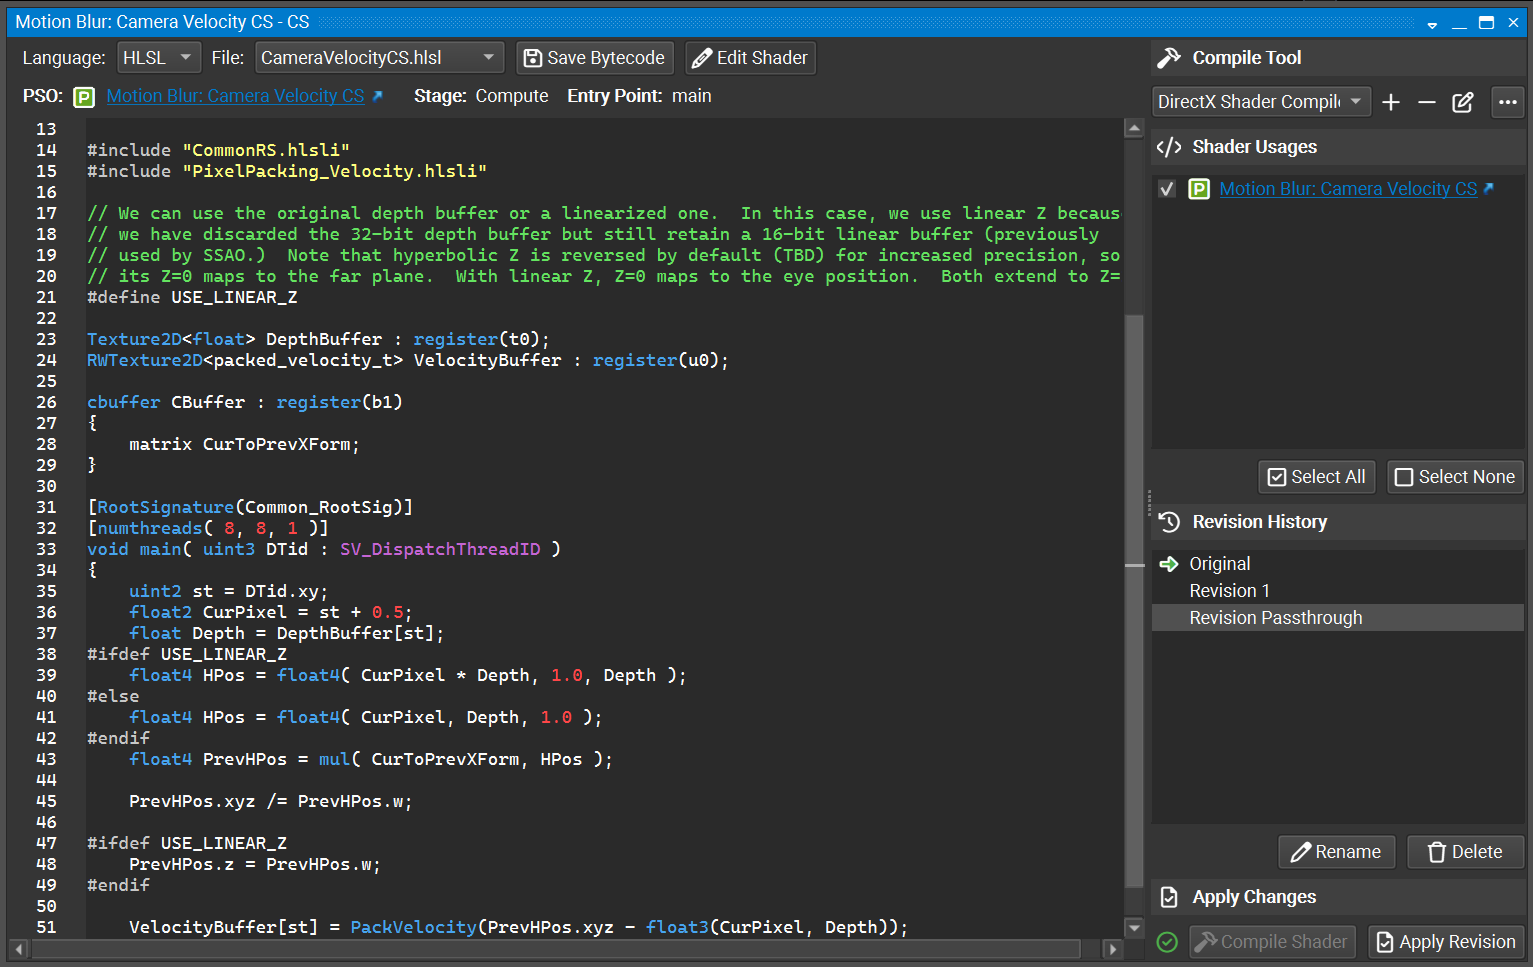
To edit a shader, enter Live Replay and click the Edit Shader button on the toolbar. This will enable editing mode, allowing you to modify the shader source code. After making changes, click the Compile Shader button to compile, then click Apply Revision to apply the modified shader. If there are any compilation errors, they will be displayed in a panel below the shader source code.
When applying shader edits, there is a Shader Usages panel that lists the usages of that shader and allows you to select which usages to apply the edited shader to. This is useful for cases where a shader may be used in multiple places, and you want to see how the changes affect specific usages.
Shader editing mode provides a list of revisions that have been compiled for the shader in a Revision History panel. You can switch between revisions by selecting them from this list. This allows you to compare different versions of the shader and see how changes affect rendering, toggling back and forth.
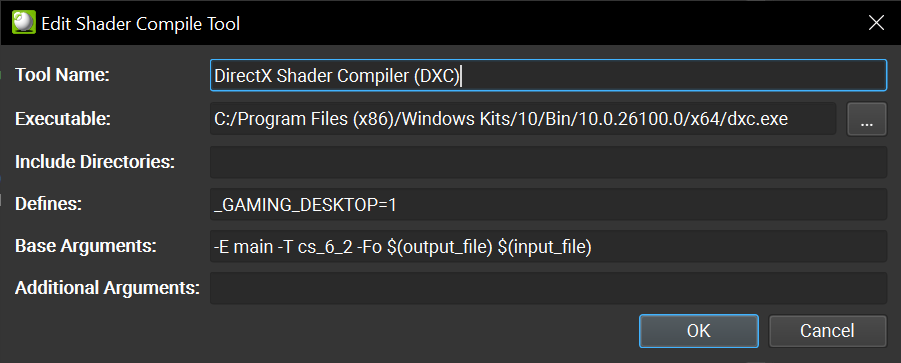
You may have to configure a compile tool if the default compile tool does not work for your application. This can be the case when the compiler has evolved over time, for example if different kinds of argument have risen to become a requirement for newer versions of the compiler or if newer argument are unknown to an older compiler. You may also adjust the command line flags that get passed to the compiler by adjusting the compiler settings.
Note
Shader editing requires that the application has debug information available for the shader being edited. See Shader Compilation for more information on enabling debug information.