Frame Debugger UI Reference#
The Frame Debugger activity is a capture-based activity. There are two classes of views in these activities - pre-capture views and post-capture views. Pre-capture views generally report real-time information on the application as it is running. Post-capture views show information related to the captured frame and are only available after an application has been captured for live analysis. For an example of how to capture, follow the example walkthrough in How to Launch and Connect to Your Application.
All Resources View#
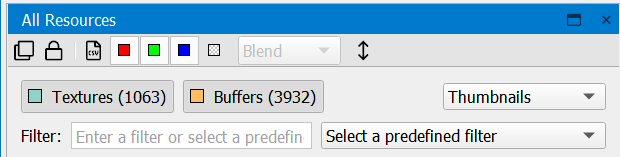
The All Resources View allows you to see all of the available resources in the scene.
To access this view, go to Frame Debugger > All Resources.
This view shows a grid of all of the resources used by the application. For graphical resources, these resources will be displayed graphically. For others, an icon is used to denote its type. When a resource is selected, a row of revisions will be shown for that resource. Clicking on any revision will change the frame debugger event to the closest event that generated or had the potential of consuming that revision.
Clicking the link below a resource, or double-clicking on the resource thumbnail, will open a Resource Viewer or Ray Tracing Inspector on that resource.
There are a number of additional capabilities in this view. At the top of the All Resources view, you’ll find a toolbar:
Clone — makes a copy of the current view, so that you can open another instance.
Lock — freezes the current view so that changing the current event does not update this view. This is helpful when trying to compare the state or a resource at two different actions.
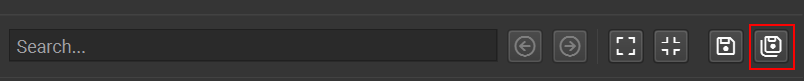
Save — saves the captured resources to disk.
Red, Green, and Blue — toggles on and off specific colors.
Alpha — enables alpha visualization. In the neighboring drop-down, you can select one of the following two options:
Blend — blends the alpha with a checkerboard background.
Grayscale — alpha values are displayed as grayscale.
Flip Image — inverts the image of the resource displayed.
Below the toolbar is a set of buttons for high-level filtering of the resources based on type. Next to that, there is a drop-down menu that allows you to select how you wish to view the resources: thumbnails, small thumbnails, tiles, or details.

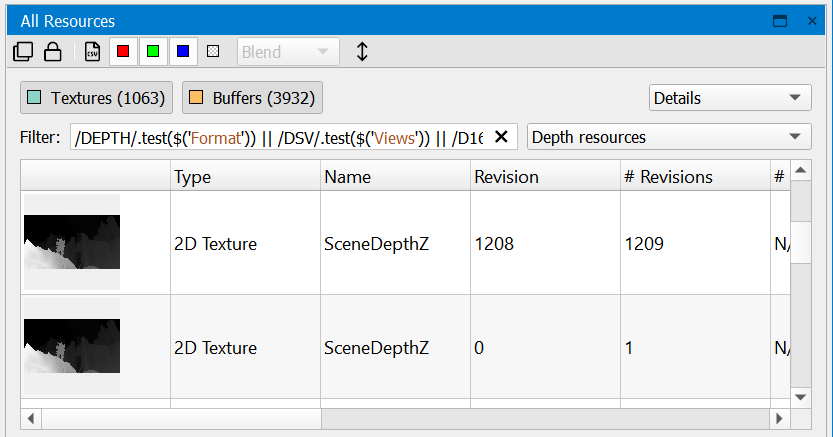
If you select the Details view, you can sort the resources by the available column headings (type, name, size, etc.).
Filtering#
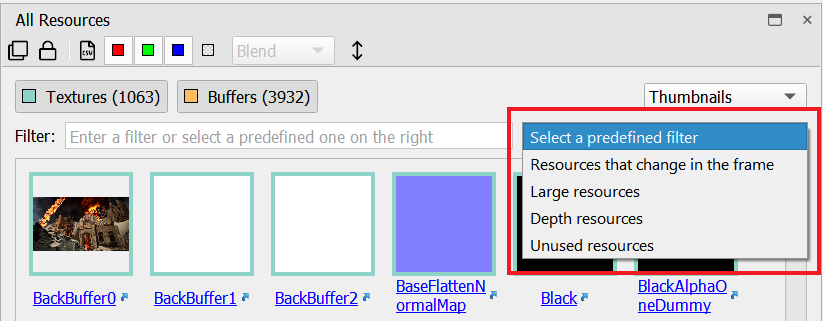
There are three ways to filter the available resources.
For high-level filtering, there are color coded buttons to filter based on resource type. All resource types are visible by default, and you can filter the resource list by de-selecting the button for the type you don’t want to see. For example, if you’d like to see only textures, you can click the other buttons to de-select them and remove them from the list of resources.
You can manually type in a search string to filter the list of resources.
You can choose from the drop-down of predefined filters to view only large resources, depth resources, unused resources, or resources that change in the frame. Selecting one of these fills in the JavaScript string necessary for the requested filter, which is also useful as a basis to construct custom filters.
Application HUD#
The Application HUD is a heads-up display which overlays directly on your application. You can use the HUD to capture a frame and subsequently scrub through its constituent draw calls on either the HUD or an attached host.
All actions that occur either in the HUD or on the host — such as capturing a frame or scrubbing to a specific draw call — are automatically synchronized between the HUD and the host, and thus you can switch between using the HUD and host UI seamlessly as needed.
The HUD has two (2) modes:
Running: Interact with your game or application normally, while the HUD shows an FPS counter. When you first start your application with Nsight Graphics, the HUD is in Running mode. This mode is most useful for viewing coarse GPU frame time in real-time while you run your application.
Frame Debugger: Once you have captured a frame, you can debug the frame directly in the Nsight Graphics HUD (as well as from the host). The HUD allows you to scrub through the constituent draw calls of a frame, to view render targets with panning and zooming, and to examine specific values in those render targets.
Running Mode
In this mode, your application can interact with the game or application normally, and the HUD shows frame-time overlaid on the scene. When you first start your application with Nsight Graphics, the HUD is in Running mode.
Frame Debugger Mode
There are two different methods to pause the application, which causes it to enter Frame Debugger mode.
Press Target application capture hotkey, as mentioned above; or
Go to the main toolbar in the Nsight Graphics UI and select Pause and Capture Frame.
Once you have captured a frame, you can debug the frame directly in the HUD. While you can also debug the frame on the host, the HUD allows you to scrub through the constituent draw calls of a frame, to view render targets with panning and zooming, and to examine specific values in those render targets.
The HUD scrubber can be clicked to navigate between events. Additionally, the view has several controls to aid in your resource investigation.
Hot Keys |
Action |
|---|---|
Left-click + drag on the scrubber bar |
Navigate to a particular draw call in your frame. When the desired draw call is active, release the left mouse button. The geometry for the currently active draw call will be highlighted, as long as it is on screen. |
Home |
Navigate to the first event |
End |
Navigate to the last event |
CTRL + Left |
Navigate to the next event |
CTRL + Right |
Navigate to the previous event |
CTRL + Plus (+) |
Zoom in |
CTRL + Minus (-) |
Zoom out |
CTRL + Zero (0) |
Makes the current texture fit to screen. |
Left-click + drag on a render target |
Pans and zooms the currently displayed render target. Use the mouse wheel to zoom in to a particular portion of the render target. |
N |
Cycles between the currently available render targets, depth targets, and stencil targets. |
W |
Cycles between wireframe modes (off, red, animated). |
To switch the display to another active render target:
Click the Select Render Target button on the HUD toolbar.
A drop-down menu will appear, showing all valid choices for the current draw call. Select the desired render target.
Note that if a selected render target is not still active for a different draw call, the display will automatically switch to an active render target.
You can also toggle between available render targets using the Ctrl+N hotkey.
HUD ICON |
DEFINITION |
|---|---|

|
Navigate to the next event. |

|
Navigate to the previous event. |

|
Cycles between the currently available render targets, depth targets, and stencil targets. |

|
Cycles between wireframe modes (off, red, animated). |
API Inspector#
The API inspector is a common view to all supported APIs that offers an exhaustive look at all of the state that is relevant to a particular event to which the capture analysis is scrubbed.
To access this view, go to Frame Debugger > API Inspector.
While the view is common, the state within it is particular to each API. See the section below that relates to your API of interest.
Search
With API Inspector pages, there is a search bar that offers a quick way of finding the information you need on a particular page. The bar will indicate the number of matches in each page, and forward and back navigation buttons are provided for navigating between each match. The buttons also support keybindings, with F3 for next and Shift+F3 for previous.
Expand/Collapse
Within an API Inspector page, there are many sections that can be expanded or collapsed to help narrow the information that is displayed to only the information you wish to see at that point in time. While each section can be individually collapsed, the UI has buttons that allow for expanding or collapsing all elements in one click.
Export
Each page has the ability to be exported to structured data in a json format. This json data will include key value pairs of the data elements, as well as indirections that indicate the relationships between different kinds of data.
This data is useful in cases where you may want to export data for persistence, or perhaps to run a diff between the data of different events.

The view also has the ability to export data from all pages. The information in each will be exported to a large, combined file in a structured json format. To accomplish this, use the Export All Pages to Json button.
D3D11 API Inspector#
The API Inspector view has an API-specific pipeline navigator that allows you to select a particular group of state within the GPU pipeline. From here, you can inspect the API state for each stage, including what textures and render targets are bound, or which shaders are in use in the related constants. Note that if a stage is not active (either there is nothing bound to that stage or it doesn’t apply for the current action) it will be grayed out, but you can still click on it to inspect the state.
Pipeline Stages#
The following table shows the stages that are available for inspection:
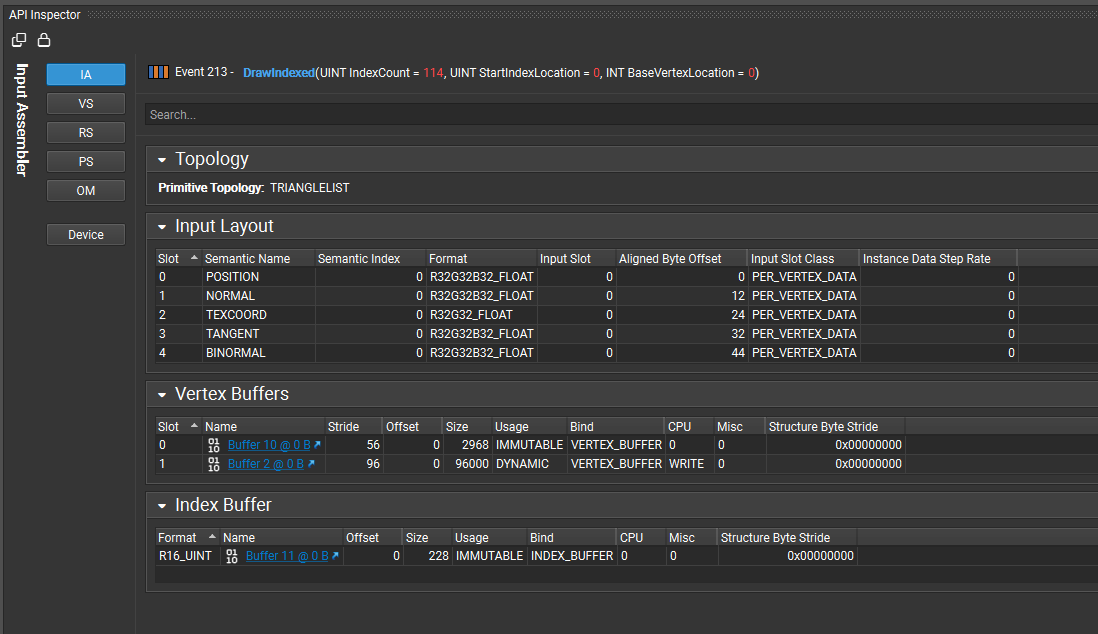
IA — The Input Assembler shows the layout of your vertex buffers and index buffers.
VS — Shows all of the shader resource views and constant buffers bound to the Vertex Shader stage, as well as links to the HLSL source code and other shader information.
HS — This shows all of the shader resource views and constant buffers bound to the Hull Shader stage, as well as links to the HLSL source code and other shader information.
DS — This shows all of the shader resource views and constant buffer bound to the Domain Shader stage, as well as links to the HLSL source code and other shader information.
GS — Shows all of the shader resource views and constant buffers bound to the Geometry Shader stage, as well as links to the HLSL source code and other shader information.
SO — Shows the resources bound for Stream Output.
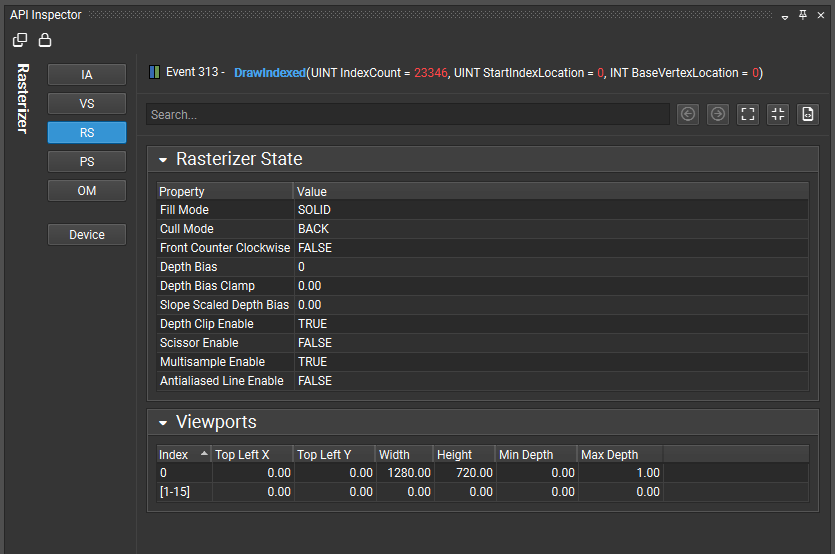
RS — Shows the Rasterizer State parameters, including culling mode, scissor and viewport rectangles, etc.
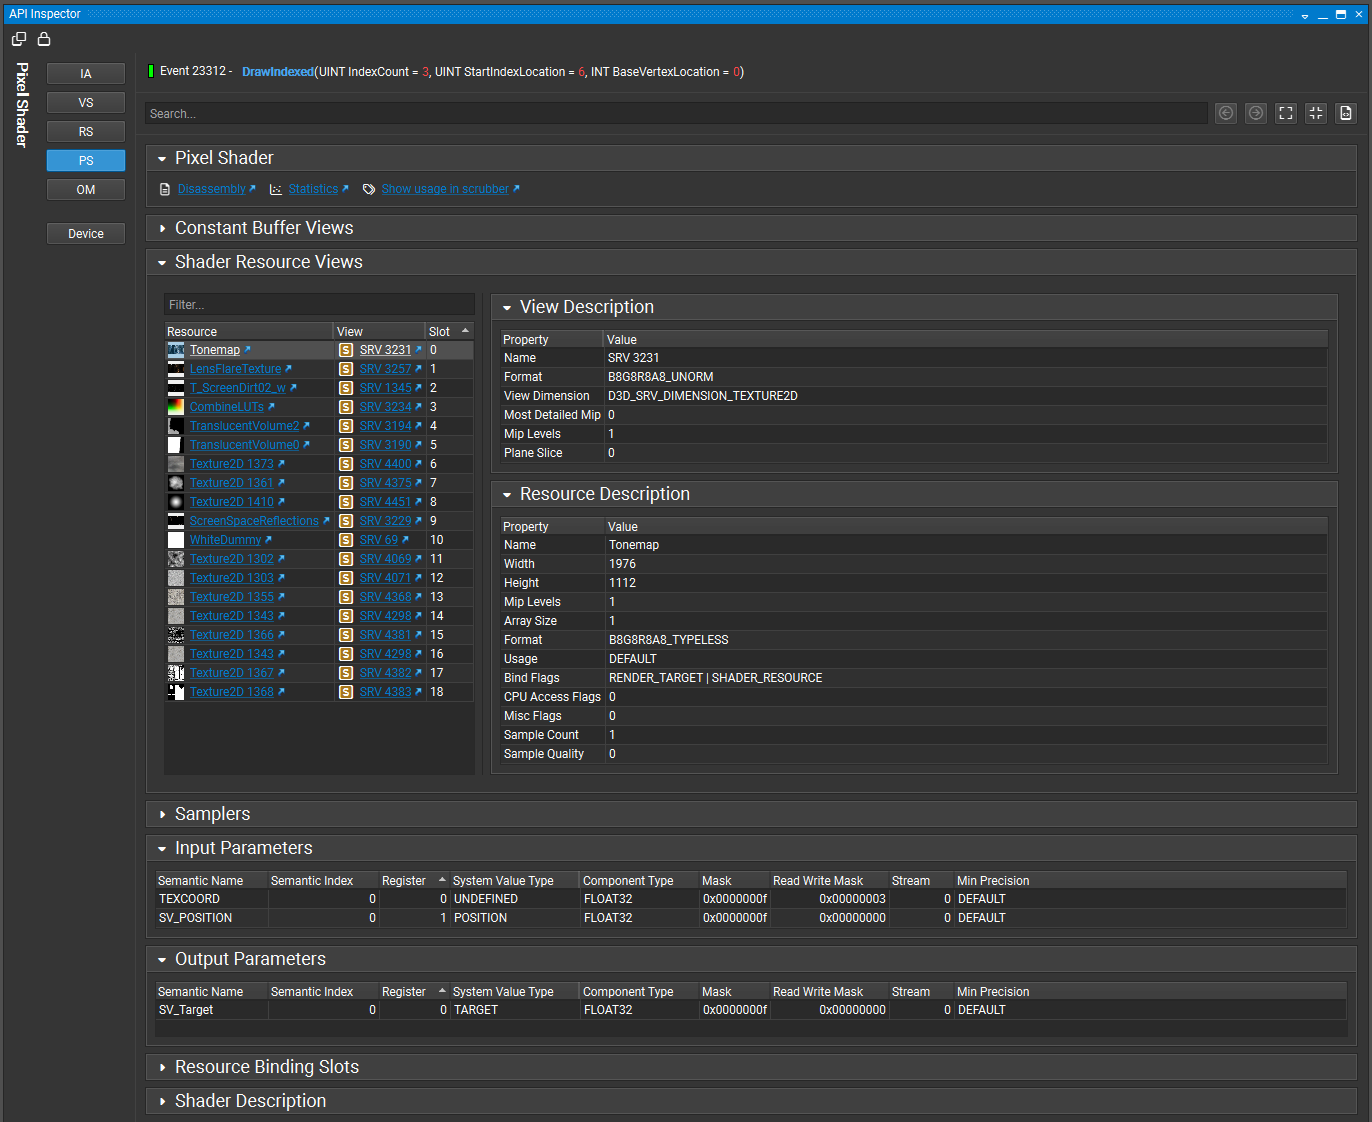
PS — Shows all of the shader resource views, constant buffers, and render target views bound to the Pixel Shader stage, as well as links to the HLSL source code and other shader information.
OM — Shows the Output Merger parameters, including blending setup, depth, stencil, render target views, etc.
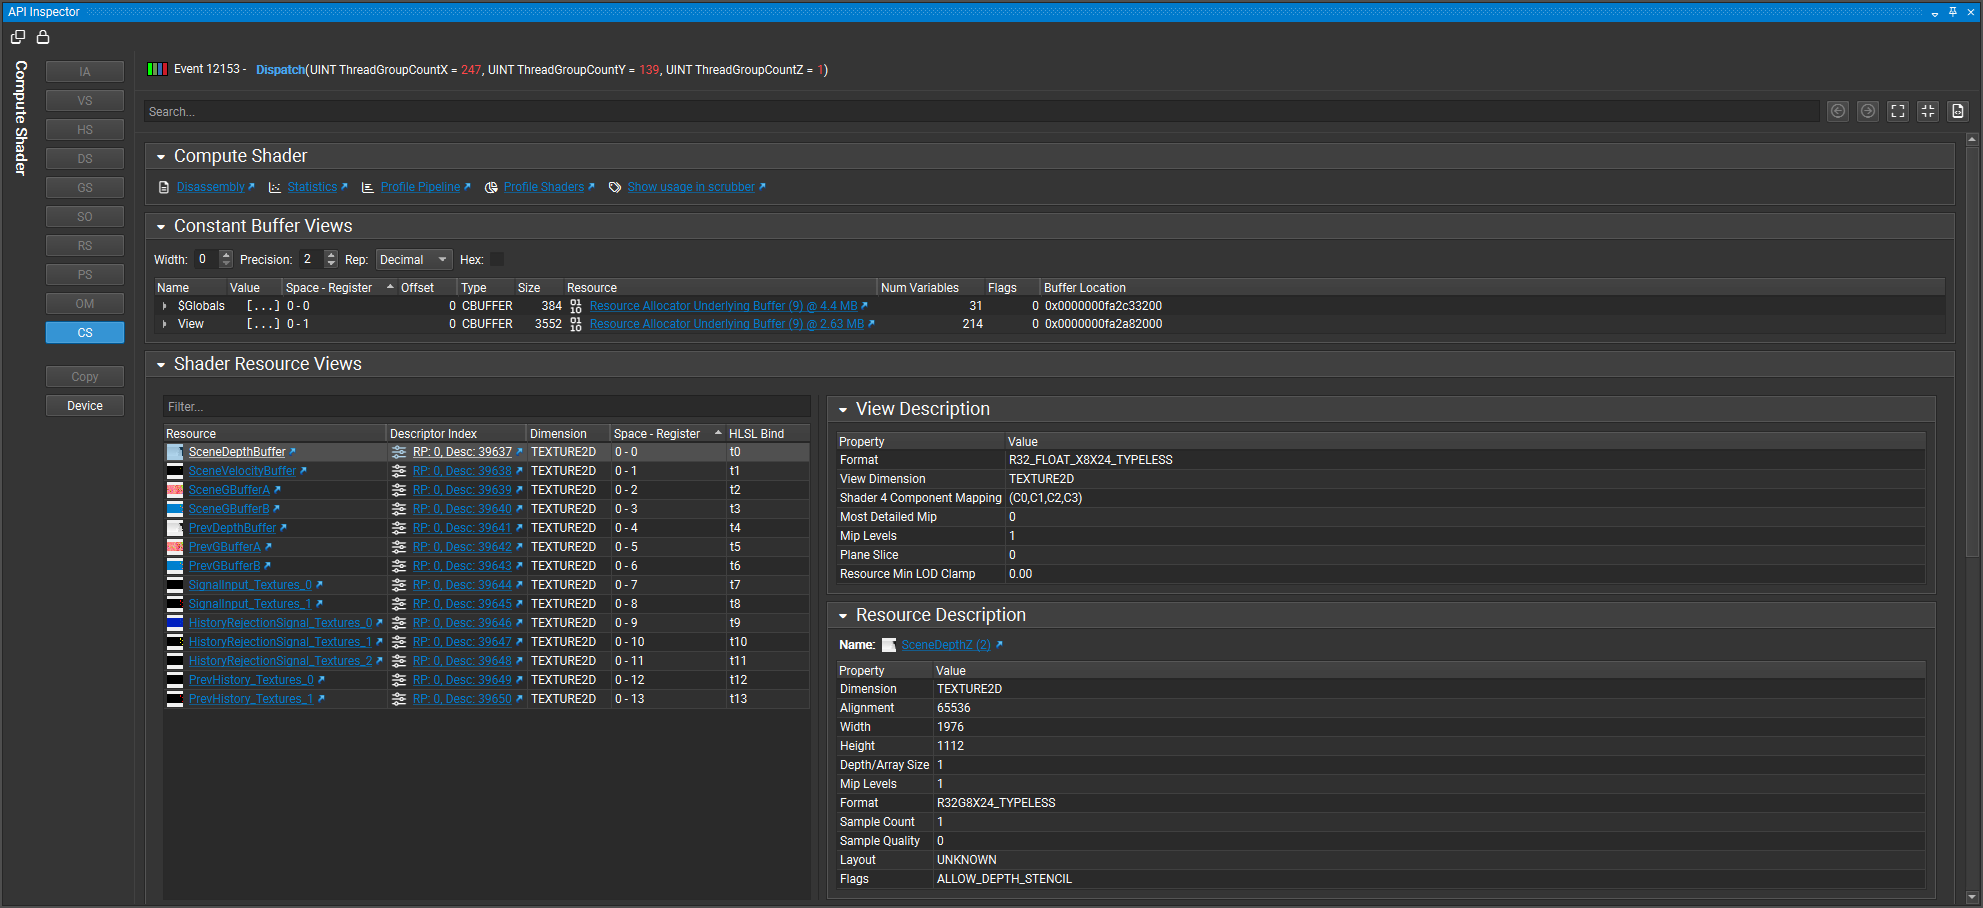
CS — This shows all of the shader resource and unordered access views and constant buffers bound to the Compute Shader stage, as well as links to the HLSL source code and other shader information.
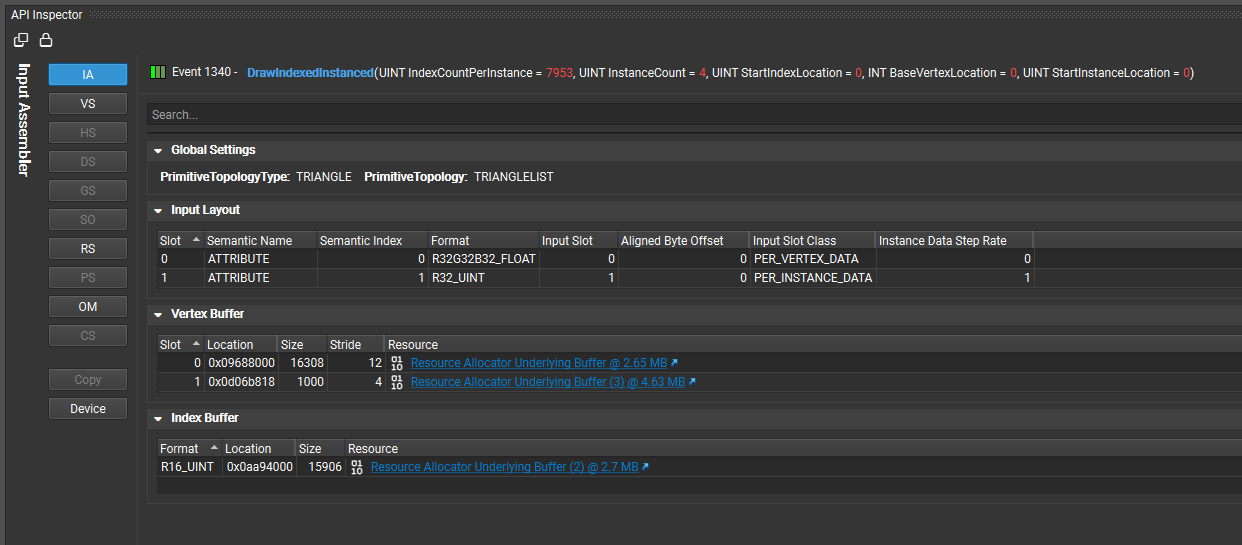
Input Assembler (IA)#
The Input Assembler page shows the details of your vertex buffers and index buffers, the input layout of the vertices.
Shaders (VS, HS, DS, GS, PS, CS)#
The various shader pages display all of the constant buffers, shader resource views, and input/output parameters, as well as links to the HLSL source code and other shader information.
In the constant buffer list, you can expand the buffer to see which HLSL variables are mapped to each entry, as well as the current values.
To enable resolution of HLSL variables, you must enable debug info when compiling the shader. See Shader Compilation for a discussion of the parameters required to prepare your shaders for optimal usage within Nsight Graphics.
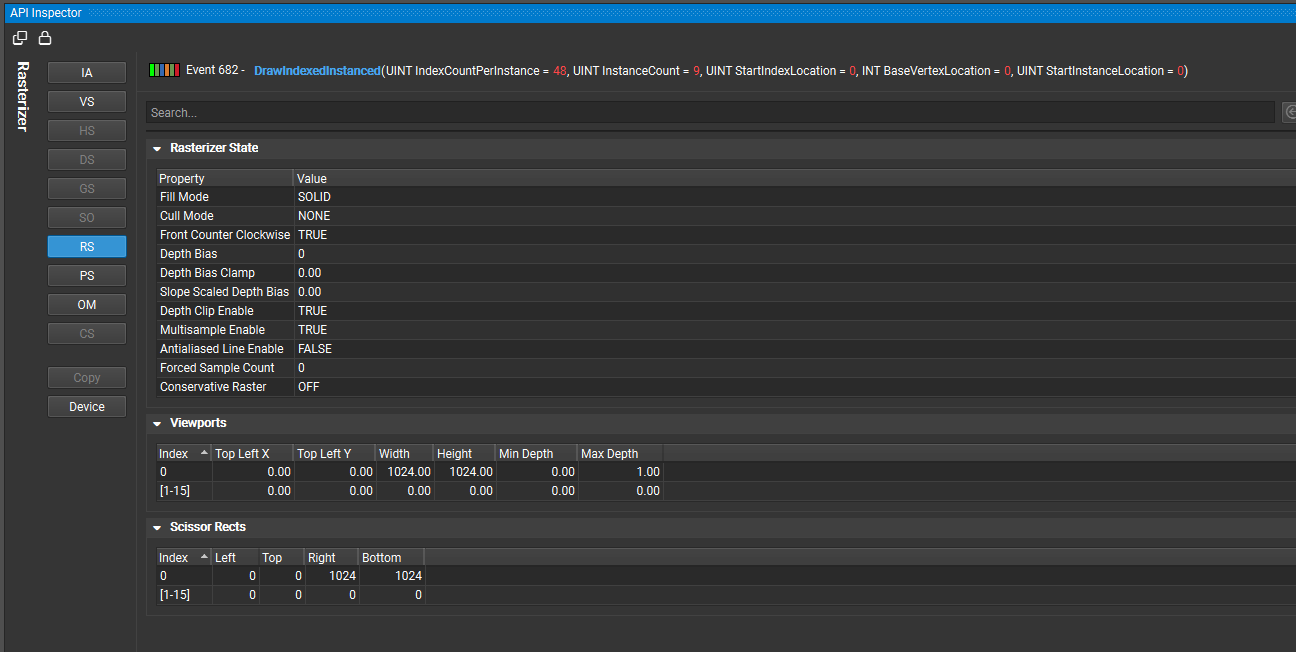
Rasterizer State (RS)#
The Rasterizer State page displays parameters including culling mode, scissor and viewport rectangles, etc.
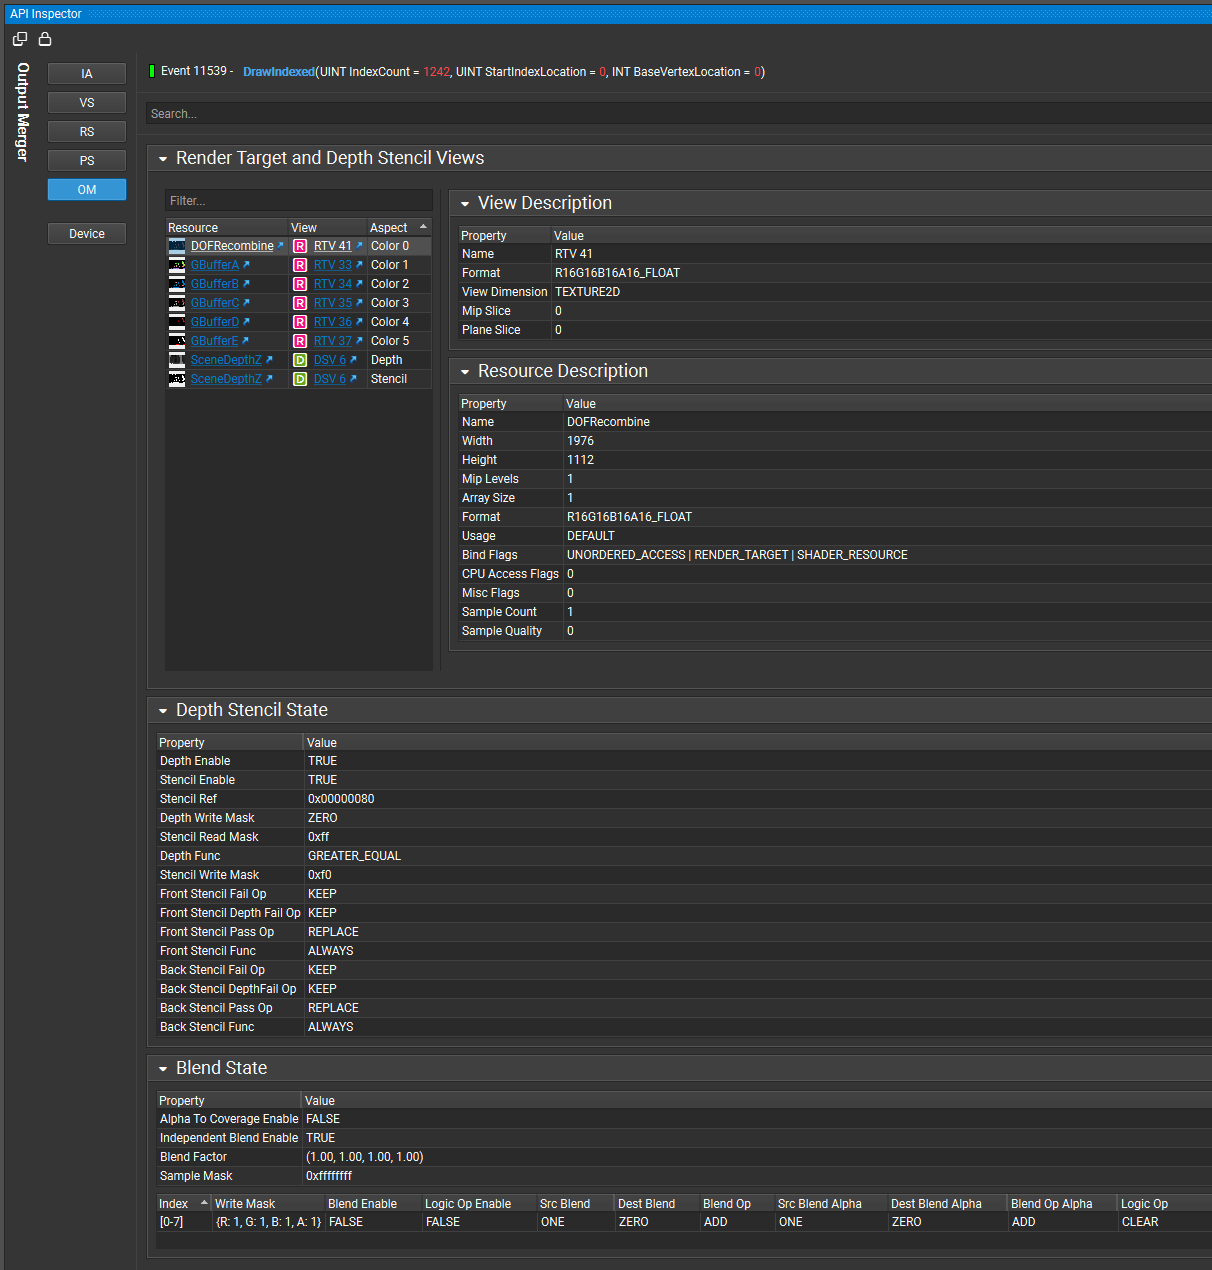
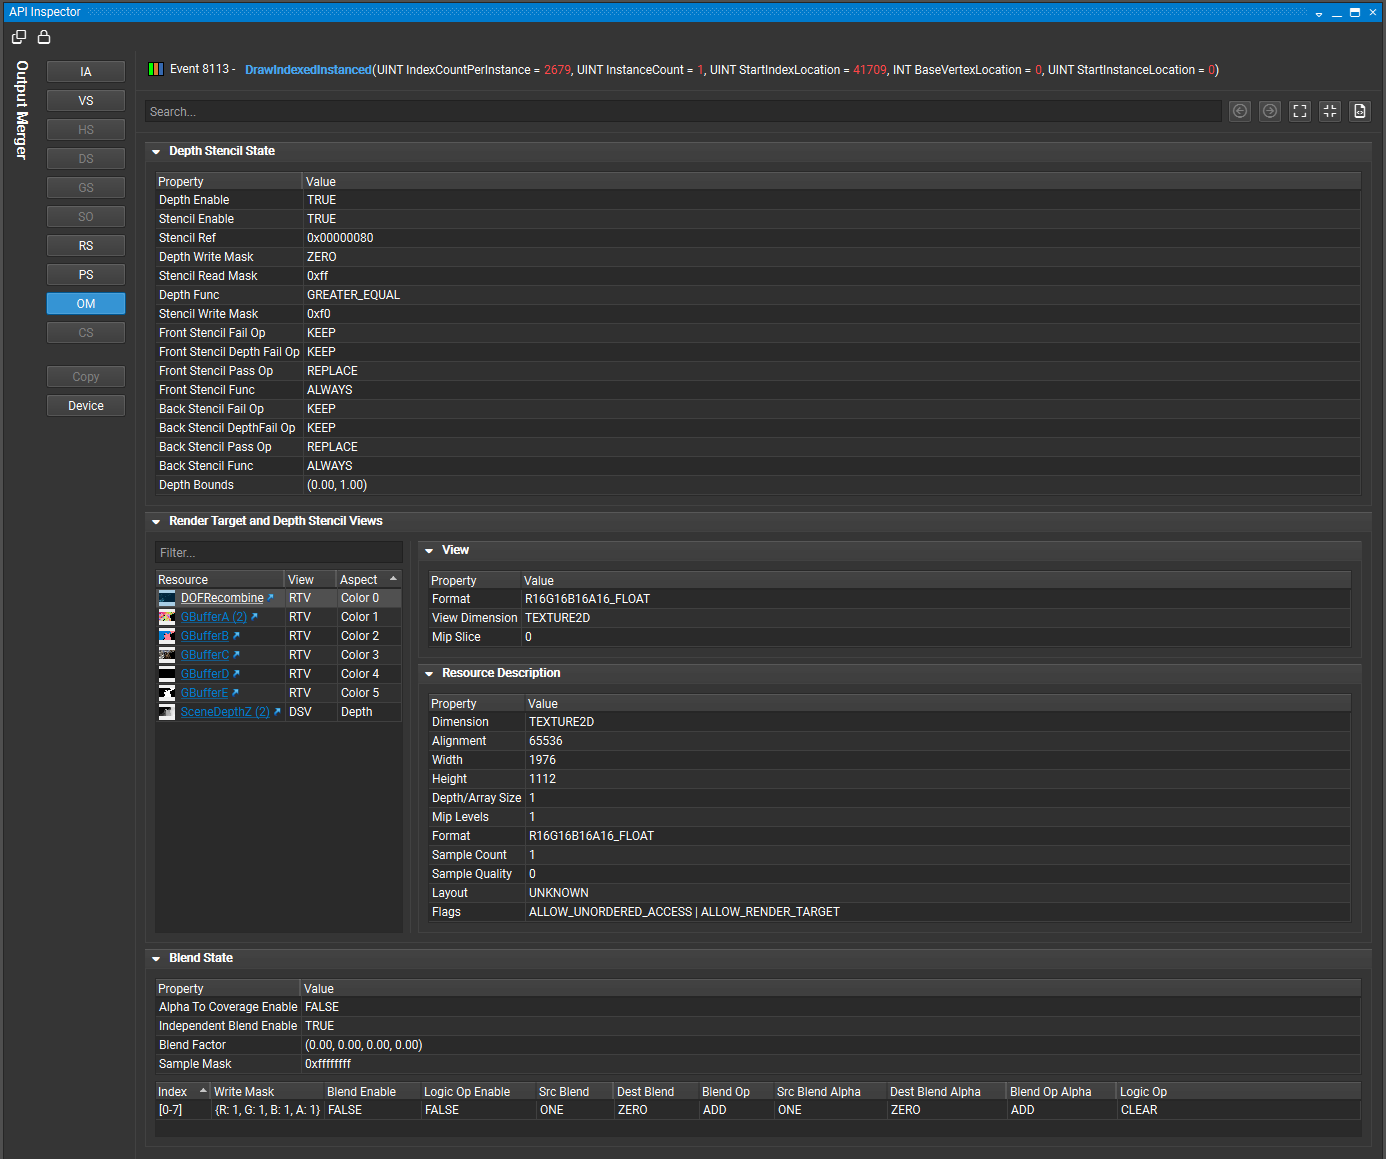
Output Merger (OM)#
The Output Merger page shows parameters including blending setup, depth, stencil, currently bound render target views, etc.
D3D12 API Inspector#
The API Inspector view has an API-specific pipeline navigator that allows you to select a particular group of state within the GPU pipeline. From here, you can inspect the API state for each stage, including what textures and render targets are bound, or which shaders are in use in the related constants. Note that if a stage is not active (either there is nothing bound to that stage or it doesn’t apply for the current action) it will be grayed out, but you can still click on it to inspect the state.
Pipeline Stages#
The following table shows the stages that are available for inspection:
IA — The Input Assembler shows the layout of your vertex buffers and index buffers.
VS — Shows all of the shader resource views and constant buffers bound to the Vertex Shader stage, as well as links to the HLSL source code and other shader information.
HS — This shows all of the shader resource views and constant buffers bound to the Hull Shader stage, as well as links to the HLSL source code and other shader information.
DS — This shows all of the shader resource views and constant buffer bound to the Domain Shader stage, as well as links to the HLSL source code and other shader information.
GS — Shows all of the shader resource views and constant buffers bound to the Geometry Shader stage, as well as links to the HLSL source code and other shader information.
SO — Shows the resources bound for Stream Output.
RS — Shows the Rasterizer State parameters, including culling mode, scissor and viewport rectangles, etc.
PS — Shows all of the shader resource views, constant buffers, and render target views bound to the Pixel Shader stage, as well as links to the HLSL source code and other shader information.
OM — Shows the Output Merger parameters, including blending setup, depth, stencil, render target views, etc.
CS — This shows all of the shader resource and unordered access views and constant buffers bound to the Compute Shader stage, as well as links to the HLSL source code and other shader information.
Input Assembler (IA)#
The Input Assembler page shows the layout of your vertex buffers and index buffers, as well as the vertex declaration information.
Shaders (VS, HS, DS, GS, PS, CS)#
The various shader pages display all of the constant buffers, shader resource views, and input/output parameters, as well as links to the HLSL source code and other shader information.
In the constant buffer list, you can expand the buffer to see which HLSL variables are mapped to each entry, as well as the current values.
To enable resolution of HLSL variables, you must enable debug info when compiling the shader. See Shader Compilation for a discussion of the parameters required to prepare your shaders for optimal usage within Nsight Graphics.
Rasterizer State (RS)#
The Rasterizer page displays render state settings, texture wrapping modes, and viewport information.
Output Merger (OM)#
The Output Merger page displays parameters such as blending setup, depth, and stencil states.
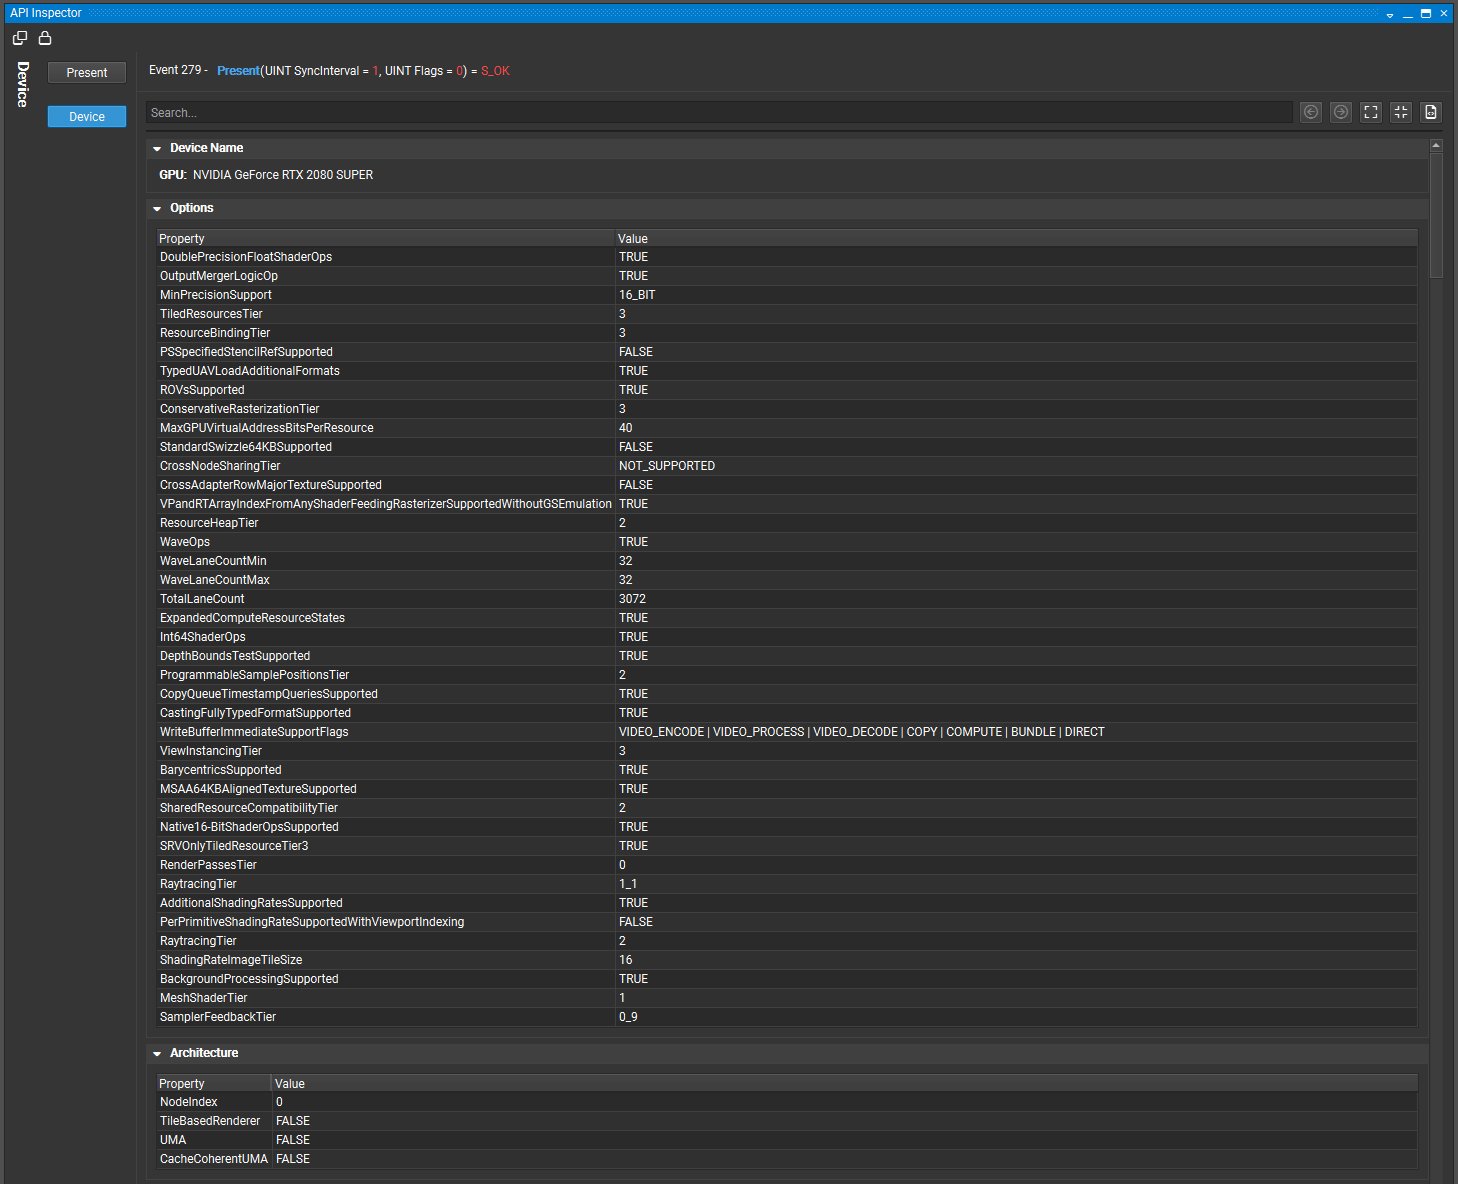
Device#
The Device page displays details about the architecture that was used.
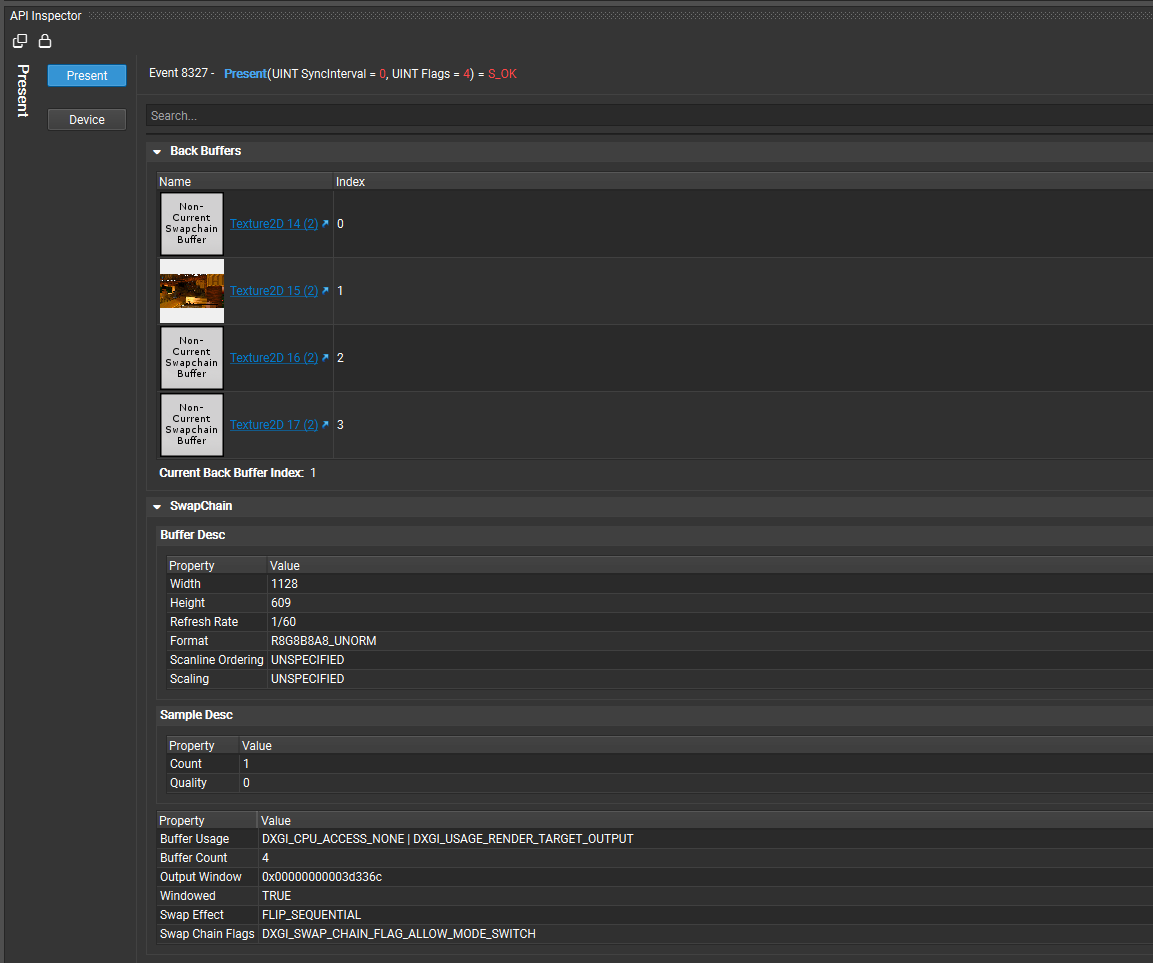
Present#
The Present page displays information about back buffers that were used.
OpenGL API Inspector#
When using the Frame Debugger feature of Nsight Graphics, you may wish to do a deep dive into the specific draw calls in order to analyze your application further. There are three different categories of API Inspector navigation.
Pipeline Stages#
The first category is laid out like a “virtual GPU pipeline.” This pipeline section of the API Inspector consists of the following:
Vtx Spec (Vertex Specification) — State information associated with your vertex attributes, vertex array object state, element array buffer, and draw indirect buffer.
VS (Vertex Shader) — Vertex shader state, including attributes, samplers, uniforms, etc.
TCS (Tessellation Control Shader) — Tessellation control shader state, including attributes, samplers, uniforms, control state, etc.
TES (Tessellation Evaluation Shader) — Tessellation evaluation shader state, including attributes, samplers, uniforms, evaluation state, etc.
GS (Geometry Shader) — Geometry shader state, including attributes, samplers, uniforms, geometry state, etc.
XFB (Transform Feedback) — Transform feedback state, including object state and bound buffers.
Raster (Rasterizer) — Rasterizer state, including point, line, and polygon state, culling state, multisampling state, etc.
FS (Fragment Shader) — Fragment shader state, including attributes, samplers, uniforms, etc.
Pix Ops (Pixel Operations) — State information for pixel operations, including blend settings, depth and stencil state, etc.
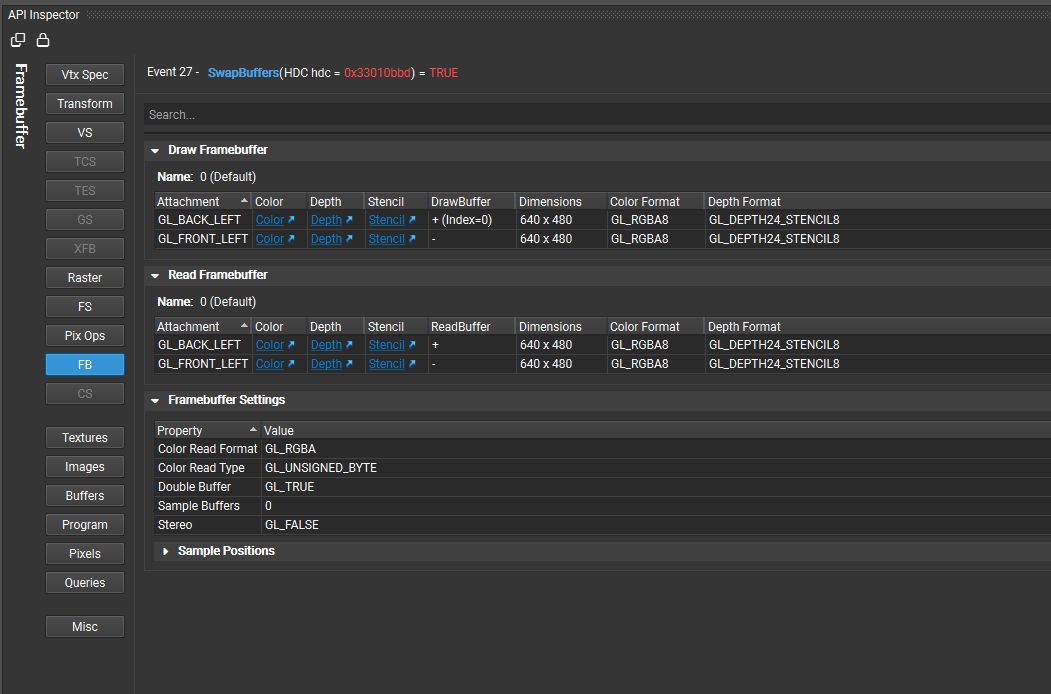
FB (Framebuffer) — State of the currently drawn framebuffer, including the default framebuffer, read buffer, draw buffer, etc.
Object and Pixel State Inspectors#
The object and pixel state inspectors section of the API Inspector consists of the following:
Textures — Details about all of the currently bound textures and samplers, including texture and sampler parameters.
Images — Details about all of the images currently bound to the image units.
Buffers — Details about all of the bound buffer objects, including size, usage, etc.
Program — Information about the currently bound program object and/or pipeline program pipeline object, including shaders, active uniforms, etc.
Pixels — Current settings for pixel pack and unpack state.
Miscellaneous#
The miscellaneous screen contains additional information such as shader limits, implementation dependent values, transform feedback limits, and various minimum/maximum values.
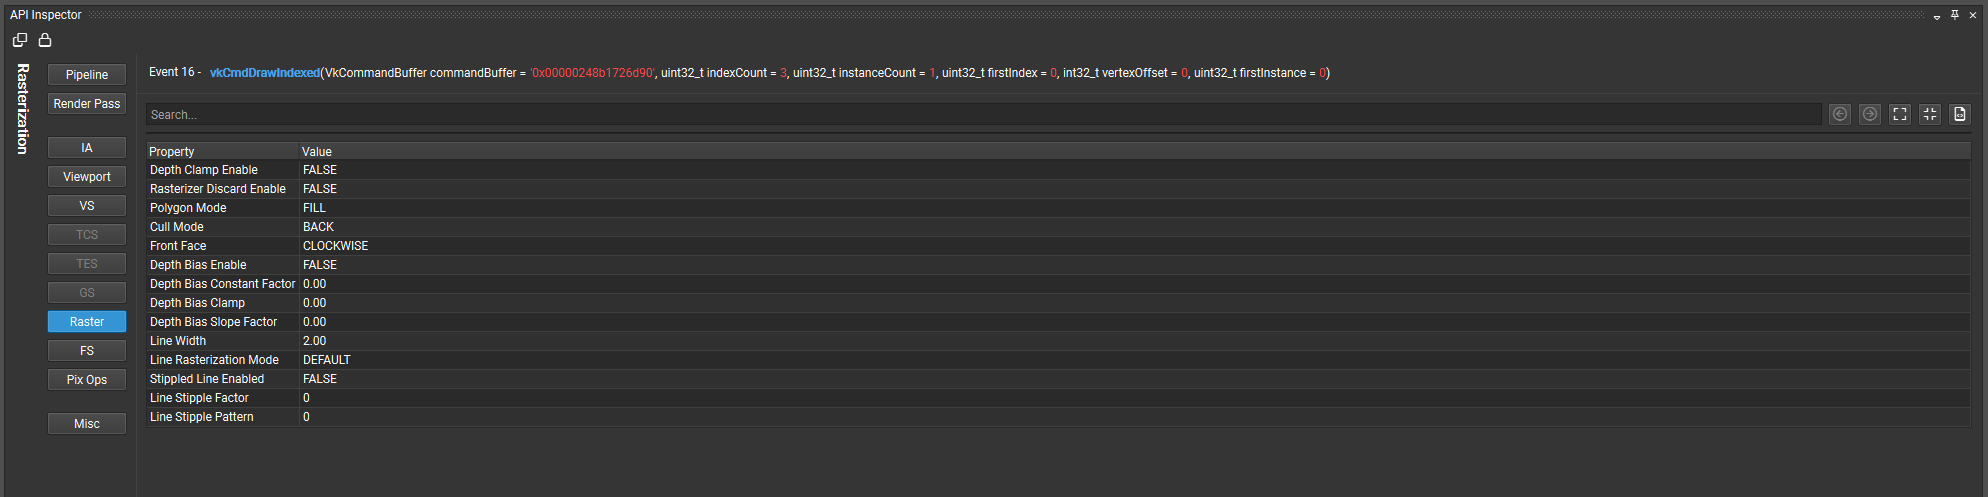
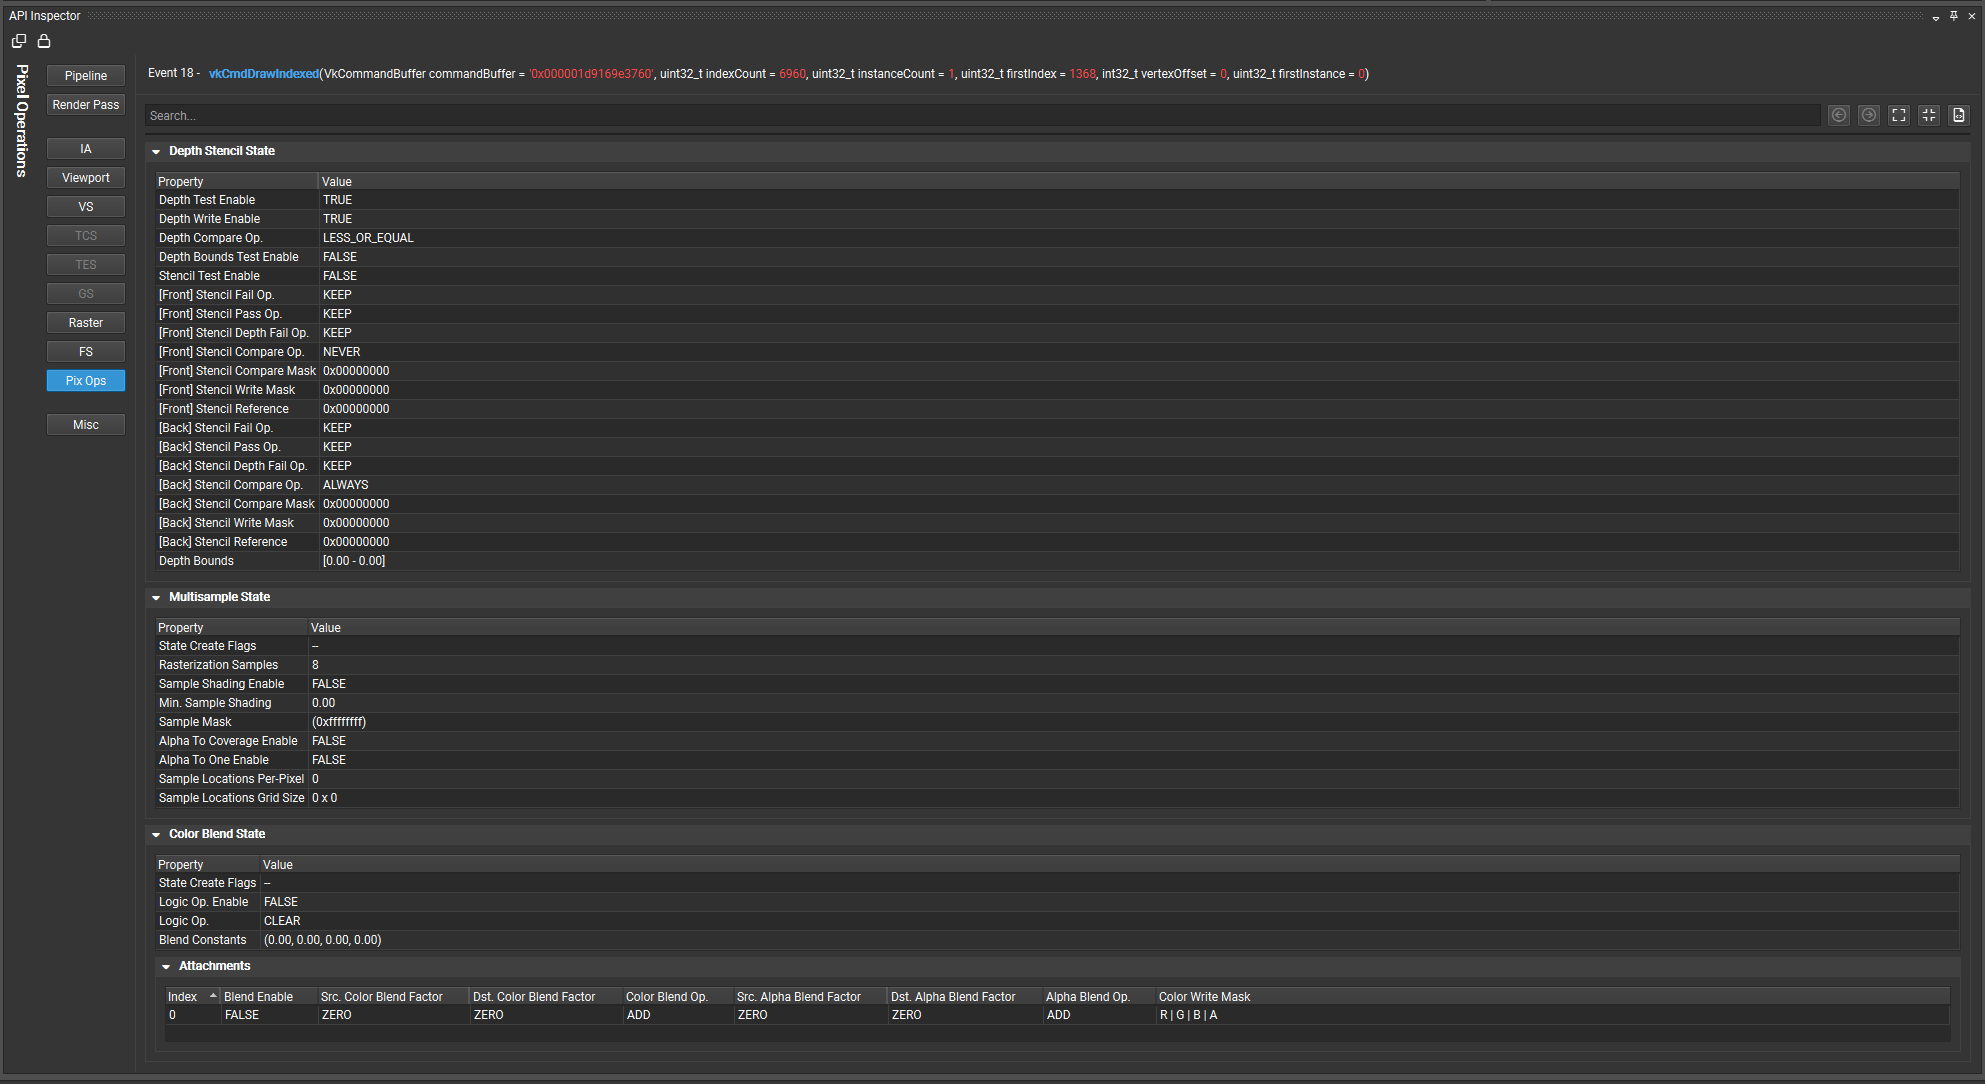
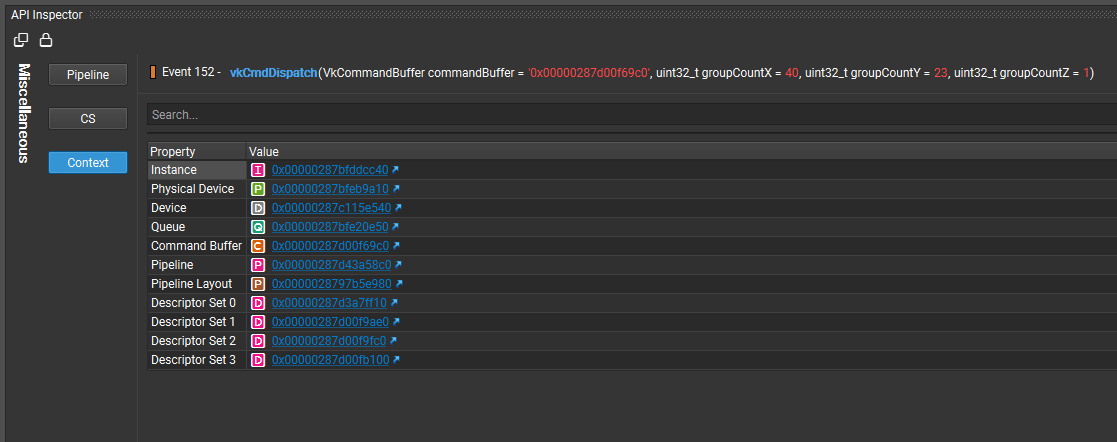
Vulkan API Inspector#
The API Inspector view has an API-specific pipeline navigator that allows you to select a particular group of state within the GPU pipeline. From here, you can inspect the API state for each stage, including what textures and render targets are bound, or which shaders are in use in the related constants. Note that if a stage is not active (either there is nothing bound to that stage or it doesn’t apply for the current action) it will be grayed out, but you can still click on it to inspect the state.
Pipeline Stages#
The following table shows the stages that are available for inspection:
Pipeline — Shows information about the currently bound pipeline object.
Render Pass — Shows information about the current render pass object.
FBO — Shows information related to the Frame Buffer Object that is associated with the current render pass.
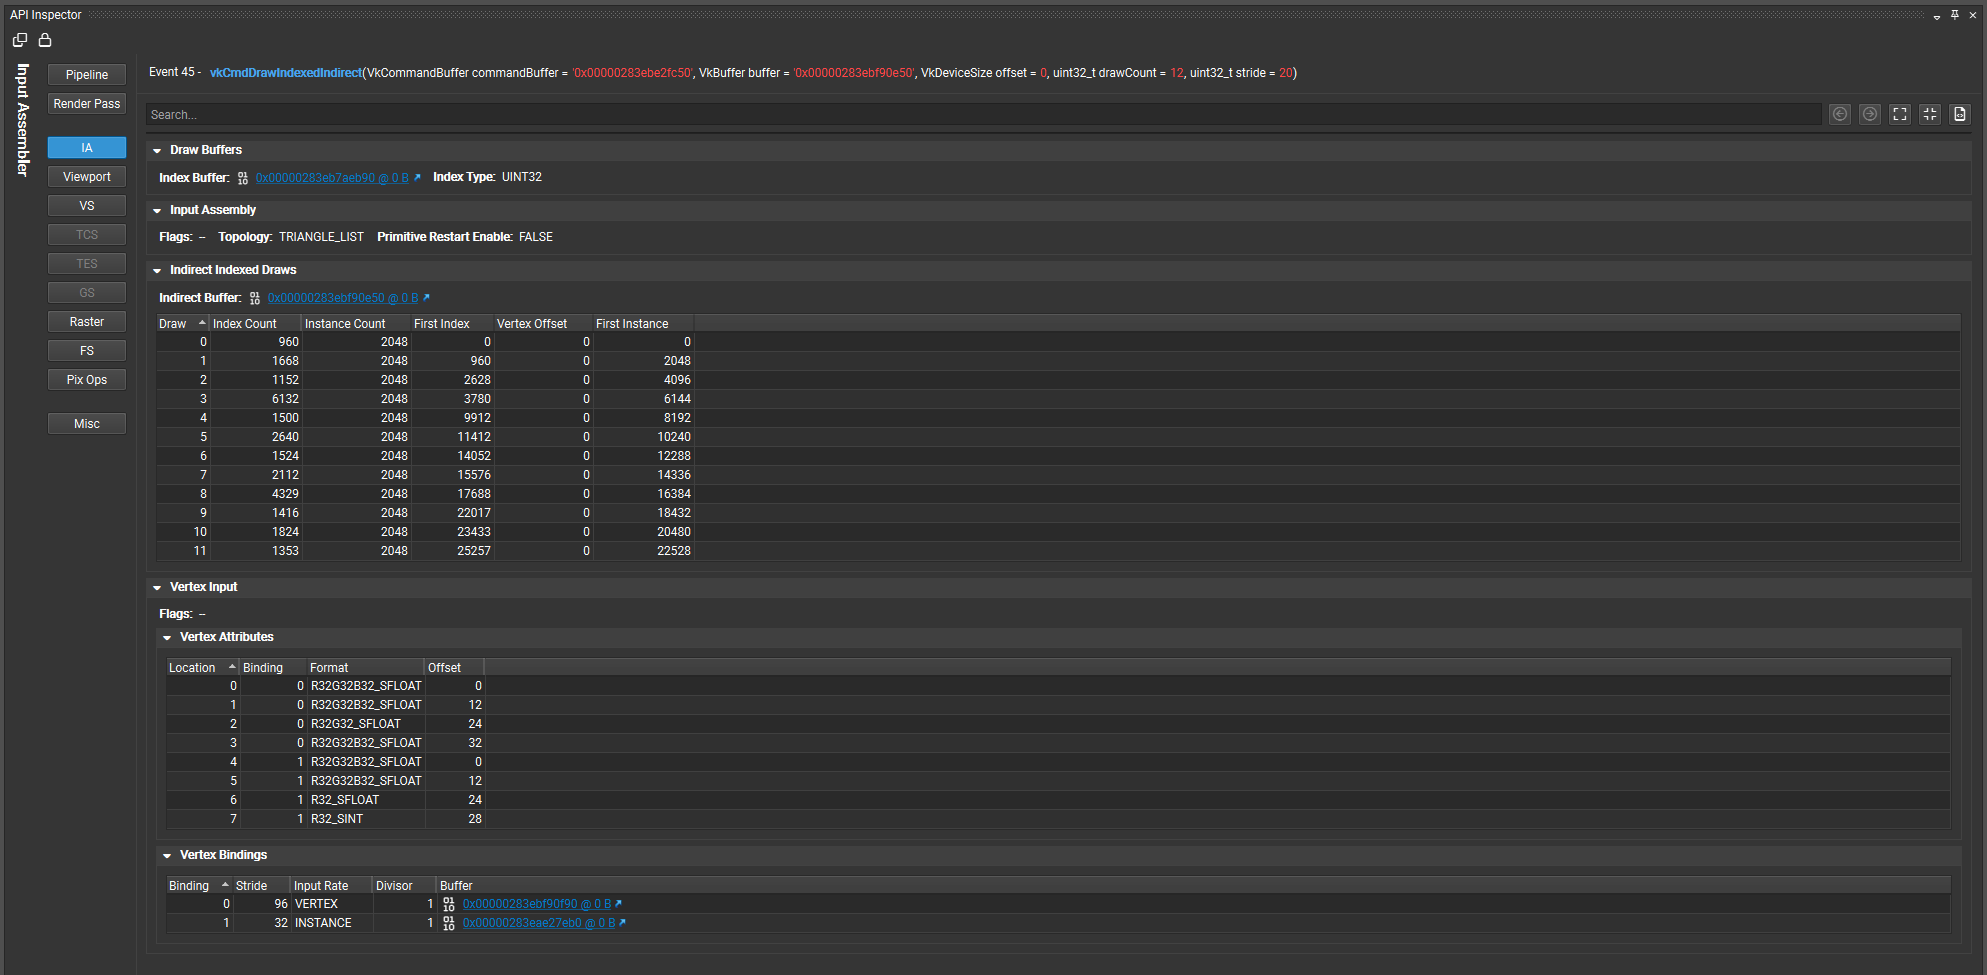
IA — The Input Assembler shows the layout of your vertex buffers and index buffers.
Viewport — Shows the current viewport and scissor information.
VS — Shows all of the shader resource views and constant buffers bound to the Vertex Shader stage.
TCS — Shows all of the shader resources associated with the Tessellation Control Shader stage.
TES — Shows all of the shader resources associated with the Tessellation Evaluation Shader stage.
GS — Shows all of the shader resource views and constant buffers bound to the Geometry Shader stage.
SO — Shows the resources bound for Stream Output.
Raster — Shows the Rasterizer State parameters, including culling mode, scissor and viewport rectangles, etc.
FS — Shows all of the shader resources associated with the Fragment Shader stage.
Pix Ops — Shows the Pixel Operations parameters, including depth/stencil, multi-sample, and blending states.
Compute — This shows all of the shader resource and unordered access views and constant buffers bound to the Compute Shader stage.
Misc - Shows miscellaneous information associated with the instance, physical devices, and logical devices.
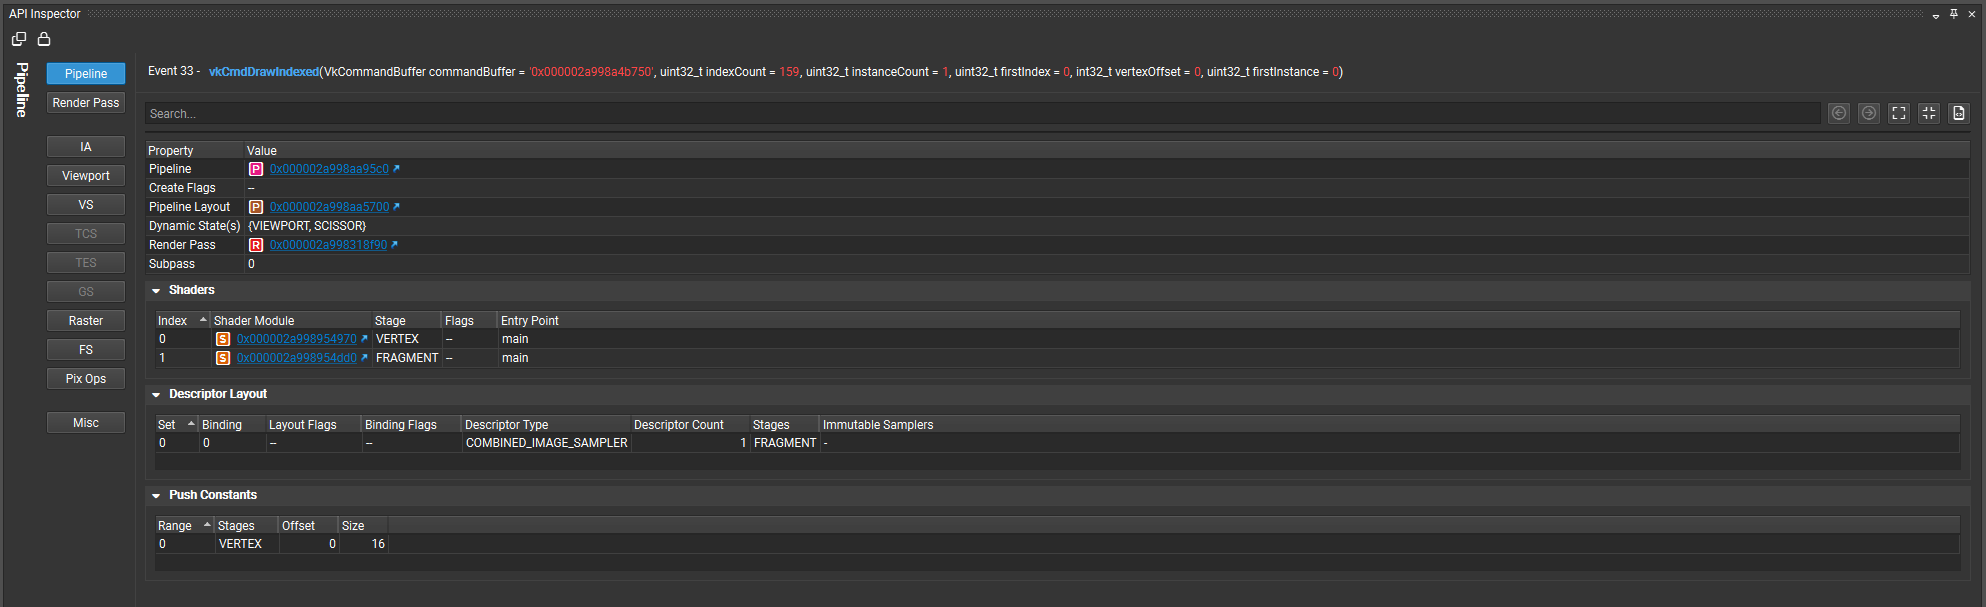
Pipeline#
The Pipeline page shows information about the currently bound pipeline object including: create info, pipeline layout, and push constant ranges.
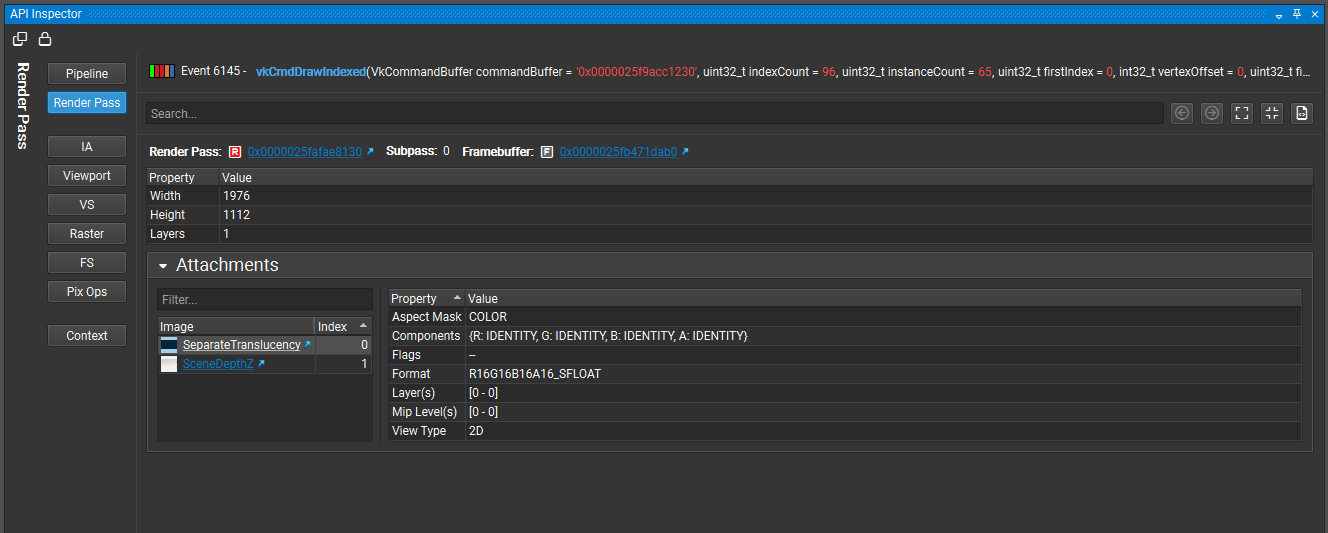
Render Pass#
The Render Pass page shows information about the current render pass including: clear values, attachments operations, and sub-pass dependencies.
Input Assembler (IA)#
The Input Assembler page shows the layout of your vertex buffers and index buffers, as well as the vertex bindings and attribute information.
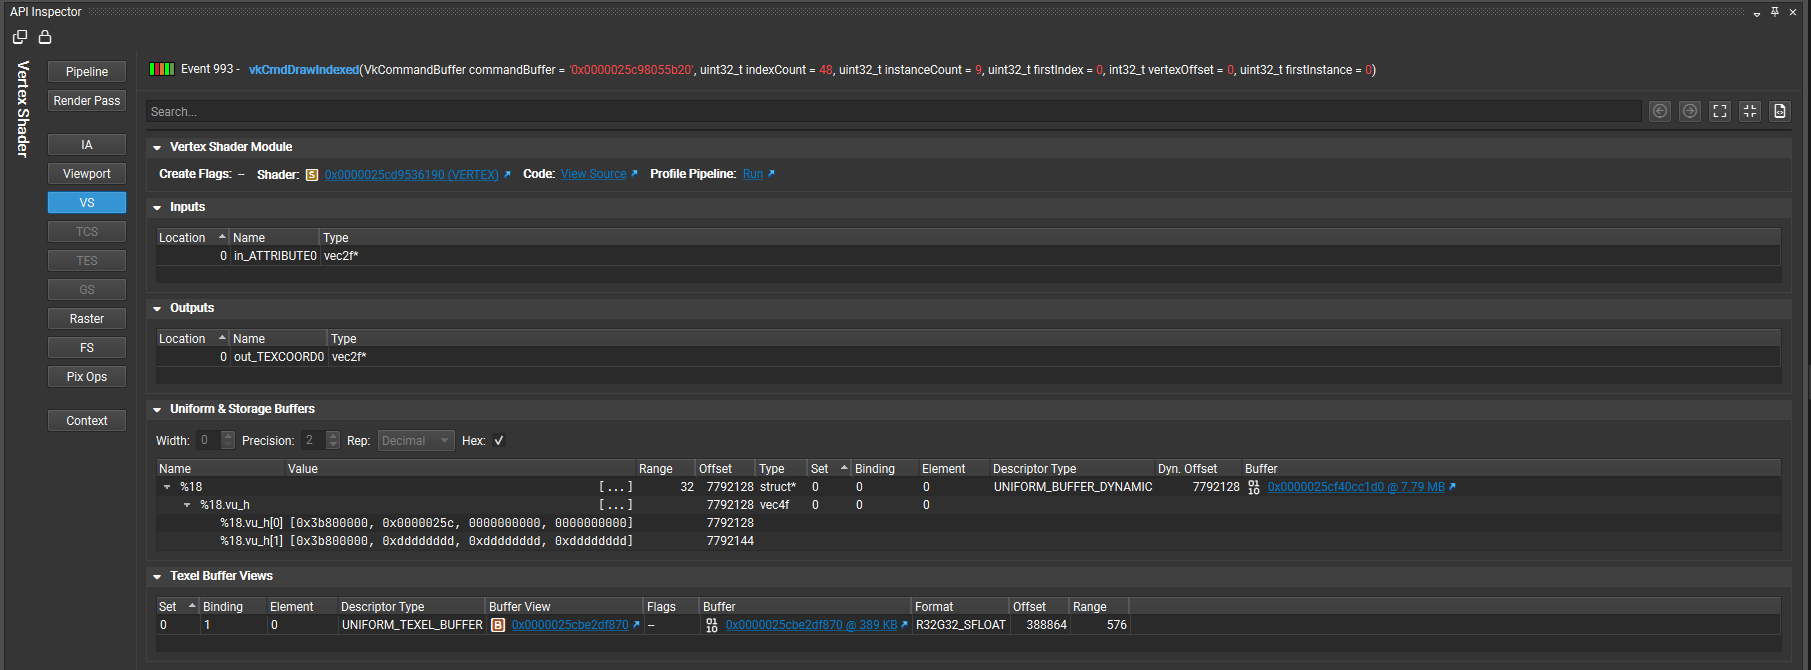
Shaders (VS, TCS, TES, GS, FS, CS)#
The various shader pages display all of the shader modules, including: creation information, human readable SPIR-V source, current push constants, current bound descriptor sets, associated buffers, associated images and samples, and associated texel buffer views for this stage.
Raster#
The Raster page shows all rasterization information associated with pipeline object include: polygons modes, cull modes, depth bias, and line widths.
Pixel Operations (Pix Ops)#
The Pixel Operations page displays information associated with the current pixel state including: depth/stencil state, multi-sample state, and blending state.
Miscellaneous Information (Misc)#
The Miscellaneous Information page shows information related to the instance, physical device(s), logical device(s), and queue(s)
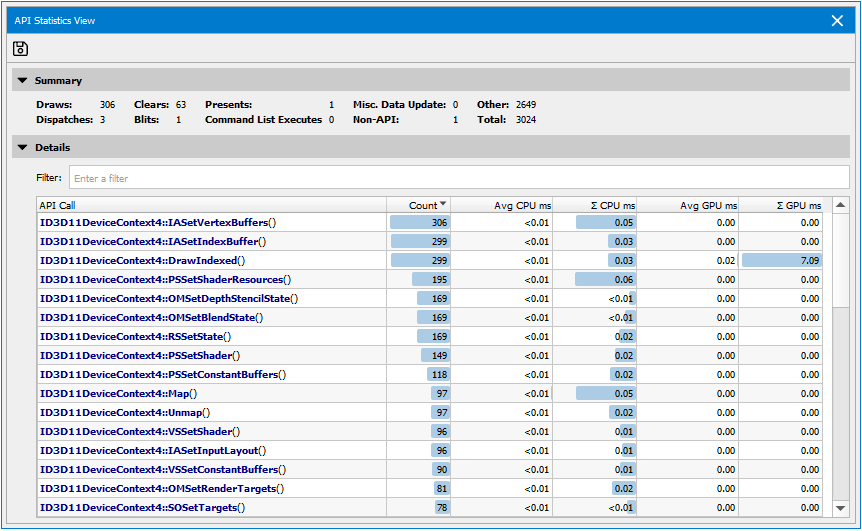
API Statistics View#
The API Statistics View is a high-level view of important API calls, and includes information to help you see where GPU and CPU time is spent.
To access this view, go to Frame Debugger > API Statistics.
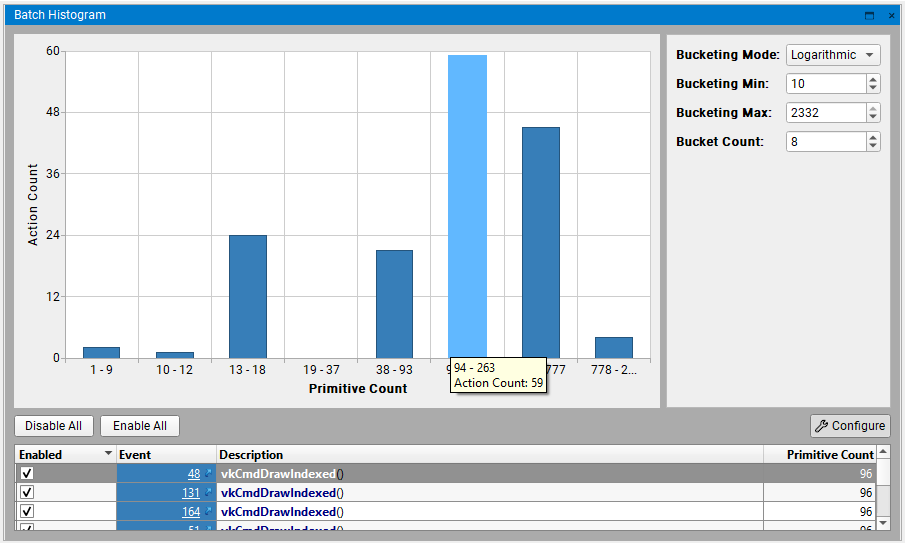
Batch Histogram View#
The Batch Histogram view provides an intuitive way for the user to inspect the primitive’s distribution across the draws. The draws can be configurably divided into buckets and allow for disabling or enabling. This can be useful for the user who want to know which draw is heavy and how it affects the render target.
To access this view, go to Frame Debugger > Batch Histogram.
Batch Histogram will display a histogram chart that contains divided buckets and can be configured by a few options.
Click Configure to open the configuration pane:
Bucketing Mode — Determines how to divide the draws into buckets.
Logarithmic: Bucketing by logarithmic scale.
Linear: Bucketing by linear scale.
Bucketing Min/Max — Specifies the range that works for bucketing, the out-of-range events will be put into bookend buckets.
Bucket Count — Specifies the bucket count.
Click Buckets then the corresponding events show in the table view. You can disable or enable the events by clicking Disable All or Enable All, also can be achieved by the check-box or right-click on the table items. Besides, the linkers on the table are directed to corresponding event in Events List.
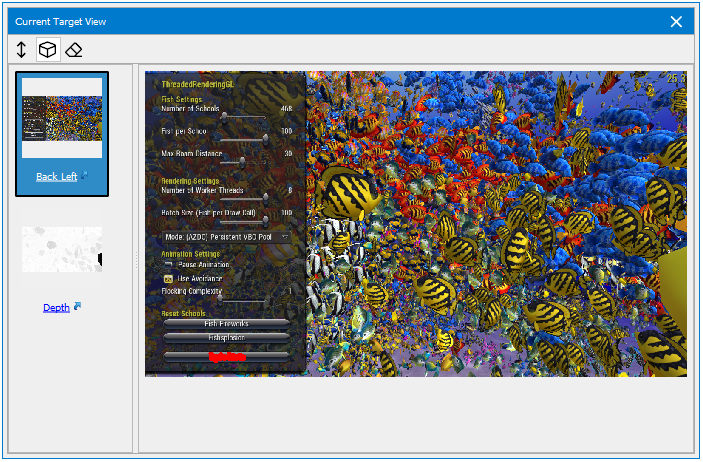
Current Target View#
The Current Target view is used to show the currently bound output targets. This can be useful because it focuses in on the bound output resources, rather than having to search for them in the All Resources view.
To access this view, go to Frame Debugger > Current Target.
Current Target displays thumbnails along the left pane for all currently bound color, depth, and stencil targets. This view changes as you scrub from event to event. All of the thumbnails on the left can be selected to show a larger image on the right. You can also click the link below each to open the target in the Resource Viewer.
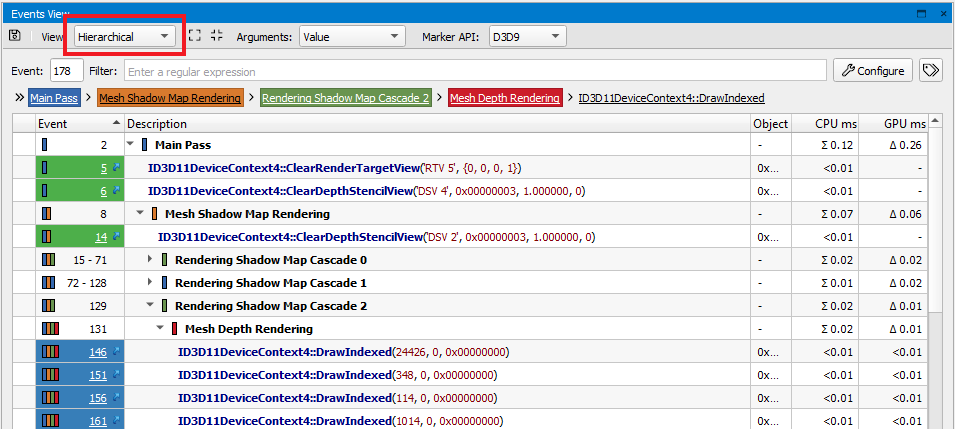
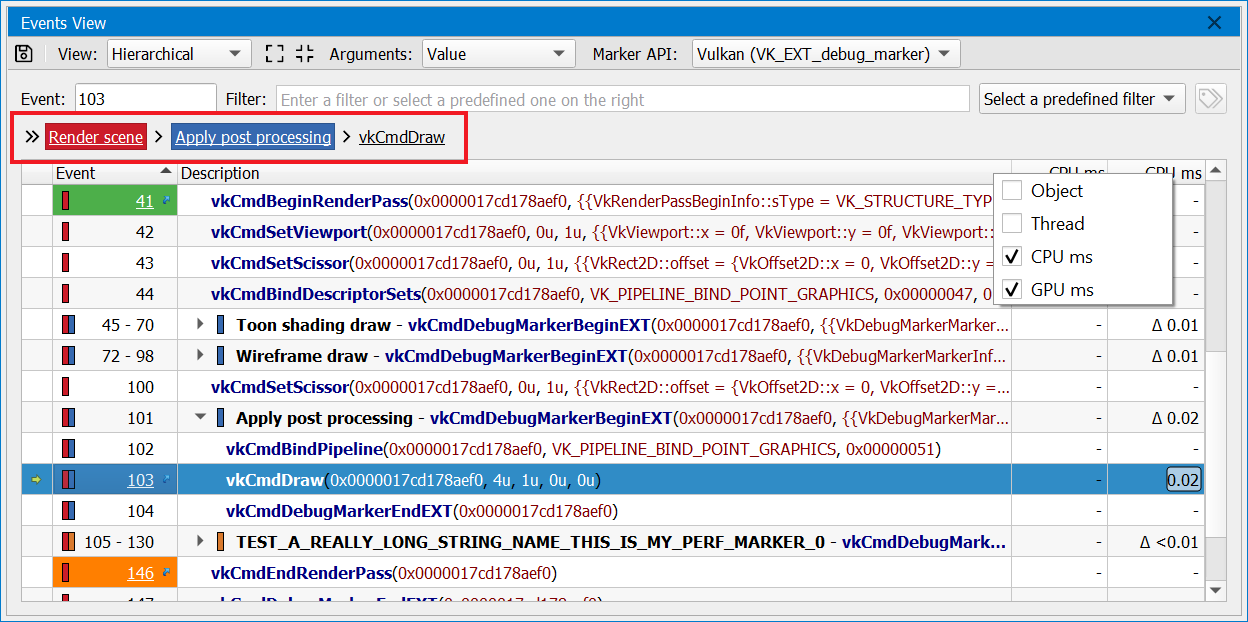
Event Viewer#
The Events view shows all API calls in a captured frame. It also displays both CPU and GPU activity, as a measurement of how much each call “costs.”
To access this view, go to Frame Debugger > Events.
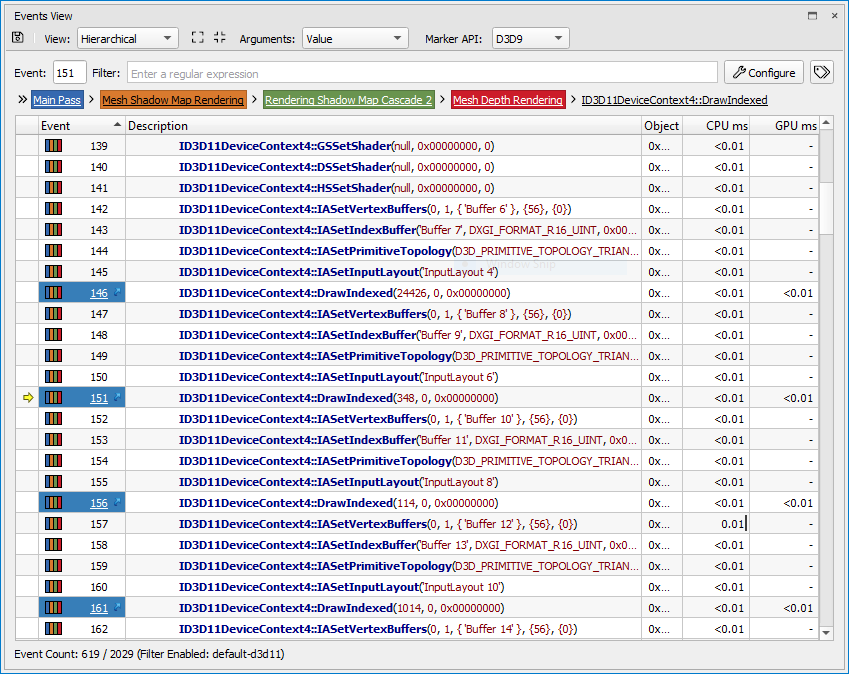
To add context to each API call, the thread ID and object/context that made that call are offered. Nsight Graphics also supports application-generated object and thread names in these columns; see Naming Objects and Threads for guidance on the supported methods for setting these names.
Clicking a hyperlink in the Events column will bring you to the API Inspector page for that draw call.
You can select whether to view the events in a hierarchical or flat view. If multiple performance marker types are used, you can select the correct one, as well as varying levels of verbosity for the call display (variable + value, value, or none). You can also sort the events by clicking on any of the available column headers.
The visibility of columns can be toggled by right-clicking on the table’s header. By default some columns will be hidden if they offer no unique data (e.g., single thread) for the captured frame.
Column |
Description |
|---|---|
(Indicator Column) |
Points to the currently scrubbed event |
(Bookmarks column) |
When bookmarks are used, this column will have a visual indication of whether the row in question is bookmarked. When no bookmarks are used, this column is hidden. |
Event |
The event ID of the API call, operation, or comment for this event. On the left-hand-side, when perfmarkers are used, a perfmarker stack is visually indicated and the ID indicates the range of events contained within this hierarchy level. Hovering over this cell will show the full perfmarker hierarchy. When the event in question is an action, the right-hand-side will contain a link to open the event in the API Inspector. |
Description |
Describes the API call, operation, or comment. This column hierarchically lists the event hierarchy as controlled by the usage of Marker APIs. |
Object |
The API object (context, queue, resource, etc.) for which the event was operated on or by. |
CPU ms |
CPU timing for the event in question. When this is a perfmarker range, this indicates an aggregate summation. These timings are provided for reference, as they are not fully accurate due to the impact of capture operations on their timing. Note that tracing tools like Nsight Systems™ are targeted for higher resolution timing. |
GPU ms |
GPU timing for the event in question. Not all events will have GPU timings. For perfmarker ranges, a delta time is indicated, noting that this is an approximated aggregation of the timing of the events within it, not an absolute timing. |
Thread |
The thread that performed the API call, operation, or comment. |
Tag |
A list of meta-data tags that relate to the call in question. These typically indicate special characteristics of the call that are not evident in their API name or parameters. When no columns have tags, this column is hidden. |
Issue |
For APIs that support issue tracking (OpenGL), this column indicates whether a particular API call or operation has issues/warnings of interest. |
Filtering Events#
The events view can be filtered with both a quick filtering expression as well as a detailed configuration dialog.
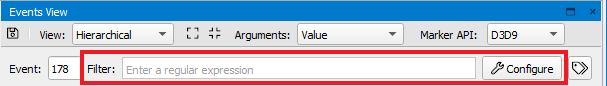
The filter input box offers a quick, regex-based match against events to find events of interest. Once entered, the view is automatically updated to match against the specified filter.
The Configure button brings up a dialog for more advanced, as well as persistent, filtering of the events in the view.
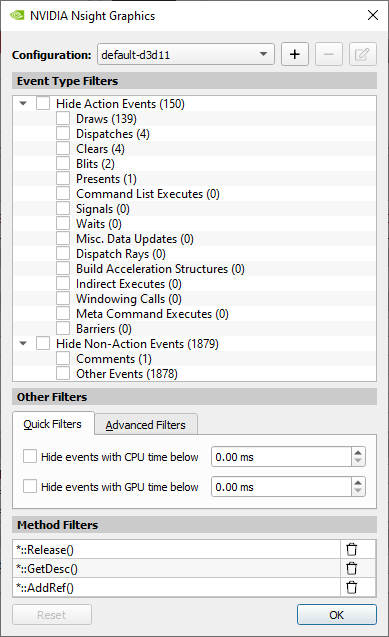
Changes within this dialog take immediate effect. There are three major classes of filters:
Event Type Filters — These filters allow filtering to happen on the classification of the event. For example, you may want to hide all non-action events to quickly filter to just draws, clears, and other actions.
Other Filters — These filters allow matching against events with a particular characteristics. Additionally, the Advanced Filters tab allows for JavaScript-based filtering on particular columns.
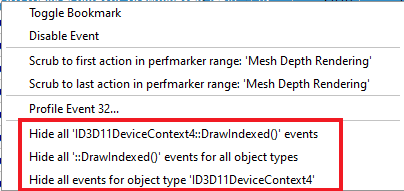
Method Filters — These filters hide methods that match against method names or object types. To add method filters, right-click on an event that you wish to hide and select one of the hiding capabilities within the view.
Filter Persistence#
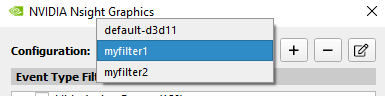
Filters set by the filter configuration dialog will persist from session to session. Additionally, if multiple filter configurations are desired, you may save different named versions and recall them quickly by name.
Filters entered into the main filter-input box are not persisted, as these filters are meant for quick filtering of the event data.
Regex Syntax#
For entries that support regex syntax, the syntax is implemented with a Perl-compatible regular expression language. Here are some examples of common tasks and the expressions that achieve them:
Task |
Expression |
|---|---|
Search for a draw call |
or use the predefined filter) |
Match OpenGL binding calls |
|
Match D3D AddRef or Release calls |
|
Search for D3D methods that set constant buffers |
|
JavaScript Syntax#
The Advanced Filters configuration dialog supports JavaScript syntax. This enables complex evaluation of filtering expressions. The basic approach for JavaScript expressions is to match a particular column of data against an expression. Columns are “accessed” via a $('ColumnName') expression. For example, a column titled “Description” is accessed via $('Description'). From there, you can perform mathematical, logical, and text-matching expressions. See some examples below to demonstrate the power and usage of these expressions:
Task |
Expression |
|---|---|
Match against the description column for draw |
|
Find events with non-zero GPU time |
|
Find odd events |
|
Find non-draw events with non-zero GPU time |
|
Bookmarking#
While filtering, it is often desired to keep the context of certain items while you find others. To prevent an event from being filtered, right-click the event and select Toggle Bookmark.
Alternatively, you can double-click or use Ctrl + B to bookmark the currently selected event. To navigate between bookmarks, use Alt + Up and Alt + Down.
If you wish to see the filtered results on the scrubber, you can select the tag button to the right of the filter toolbar, and a new row will appear in the Scrubber that displays your filtered events, allowing you to navigate those events in isolation.

Perf Markers#
On the Events page, you can use the hierarchical view to see a tree view of performance markers. The items listed in the drop-downs correspond with the nested child perf markers on the Scrubber.
If you use the flat view on the Events page, the perf marker is not nested, but you can hover your mouse over the color-coded field in the far left column, which allows you to view the details about that perf marker.
When an application uses multiple kinds of perf markers, the Marker API allows selecting the API to use for the display. This situation may arise if the application uses a middleware, for example, or mixes components with different marker strategies.

Event Breadcrumbs#
To assist in navigation for an application using perf markers, the Events page shows a breadcrumb trail of the current perf marker stack. Each of these sections, including the current event, are clickable and navigate back to that location in the Event page.
Hotkeys#
Navigation |
|
|---|---|
|
Go to the first event in the list. |
|
Go the last event in the list. |
|
Go to the previous action. |
|
Go to the next action. |
|
Collapse the current perfmarker level. |
|
Expand the current perfmarker level. |
|
Go to the next bookmark. |
|
Go to the previous bookmark. |
|
Go to the next perfmarker on the same level of the perfmarker stack. |
|
Go to the previous perfmarker on the same level of the perfmarker stack. |
|
Go to the next perfmarker that is one level (or greater) up the stack for the current selection. |
|
Go to the previous perfmarker that is one level up the stack for the current selection. |
|
Go down the perfmarker stack to the next perfmarker that is one level below the current selection. |
|
Go down the perfmarker stack to the previous perfmarker that is one level below the current selection. |
|
Focus the current event to the center of the view. |
|
Focus the current event to the top of the view. |
|
Focus the current event to the bottom of the view. |
|
Focus the current selection by collapsing all other perfmarkers. If the current selection is a perfmarker itself, it is expanded. |
|
Clear selection. |
|
Select all events. |
|
Copy selected events. |
Event Details#
The Event Details view shows all parameters for the current event in a hierarchical tree structure that allows for searching.
To access this view, go to Frame Debugger > Event Details.
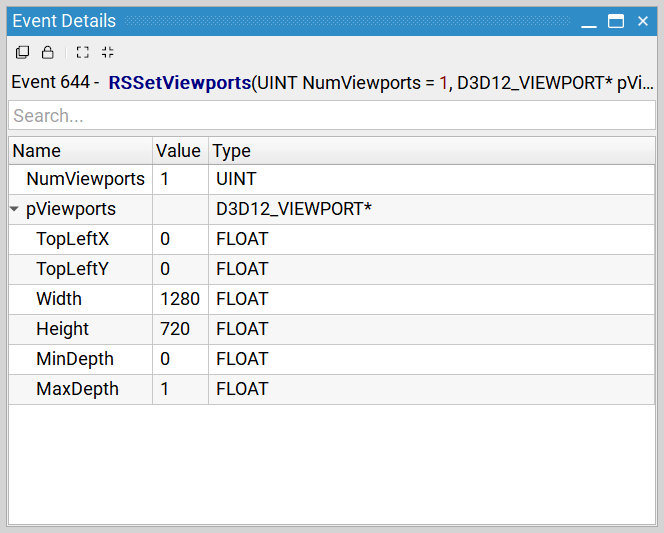
Because this window shows parameters for the current event, it changes as you navigate the scene. If you wish to keep the parameters for comparison against another call, the view supports Clone and Lock capabilities.
Column |
Description |
|---|---|
Name |
The name of the parameter or child of a parameter structure. |
Value |
The value passed in to the API call for this parameter. |
Type |
The type of the parameter in question. |
For events that reference API objects, the Event Details view provides a link to examine more information to that object in the Object Browser.

Geometry View#
The Geometry view takes the state of the Direct3D, OpenGL, or Vulkan machine, along with the parameters for the current draw call, and shows pre-transformed geometry.
To access this view, go to Frame Debugger > Geometry.
There are two views into this data: a graphical view and a memory view.
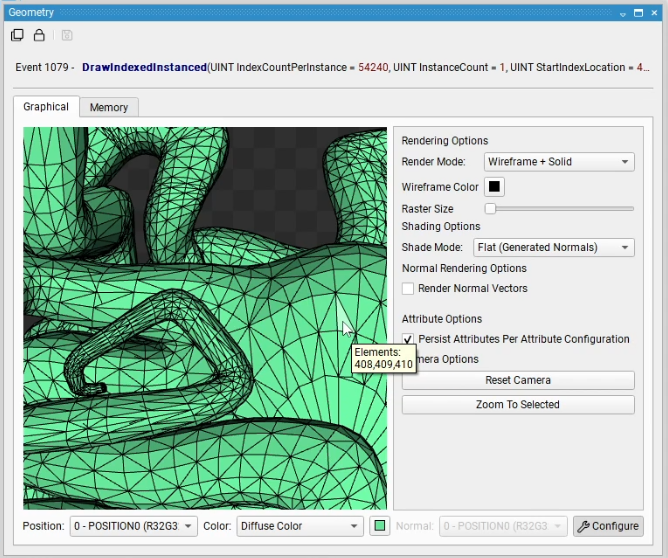
Graphical Tab
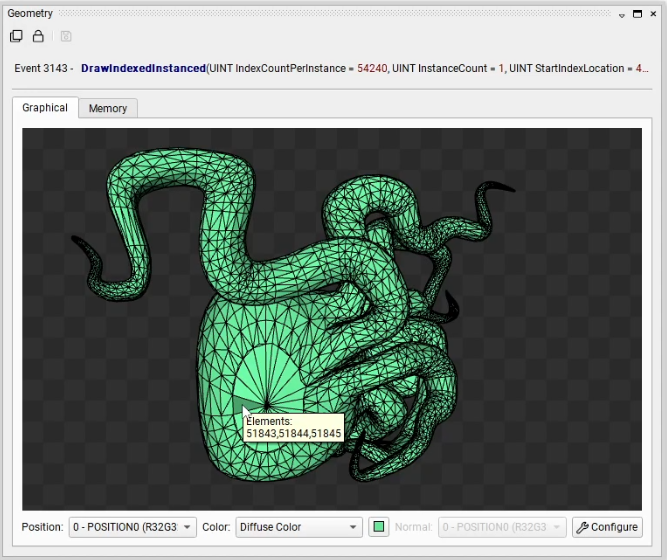
Mouse Events
Hover — Hint the elements of the hovered primitive.
Left Click — Select the primitive or reset the selection if clicking at nothing. When selecting in the graphical viewer, the correlated rows in the memory table are also selected at the same time.
Attribute Options
Position — Specifies the vertex attribute to use for positional geometry data.
Color — Specifies how to color the geometry. If Diffuse Color is selected, the selected diffuse color swatch will be used for coloring. If a vertex attribute is selected, the selected attribute will be used for per-vertex coloring.
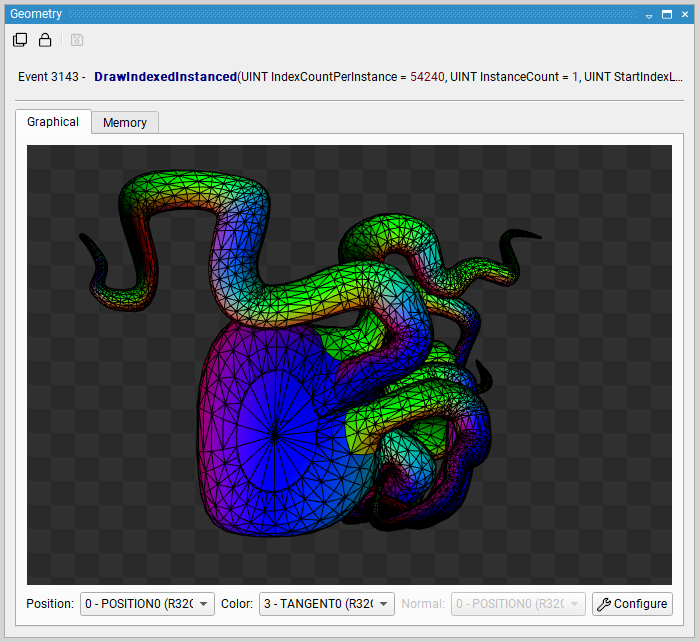
Normal — Specifies the per-vertex normal. This selection applies when using a shade mode that specifies Normal Attribute or when rendering normal vectors.
Rendering Options
Clicking Configure in the bottom right corner of the Geometry View will open up the rendering options menu.
Reset Camera — Resets the camera to its default orientation. By default, the viewer bounds all geometry with a bounding sphere for optimal orientation.
Zoom To Selected — Zoom the camera to the selected primitive.
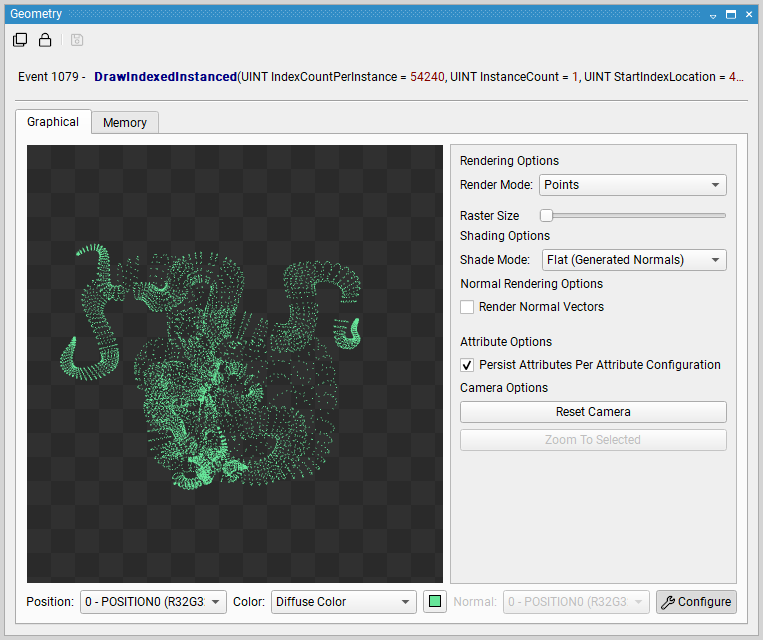
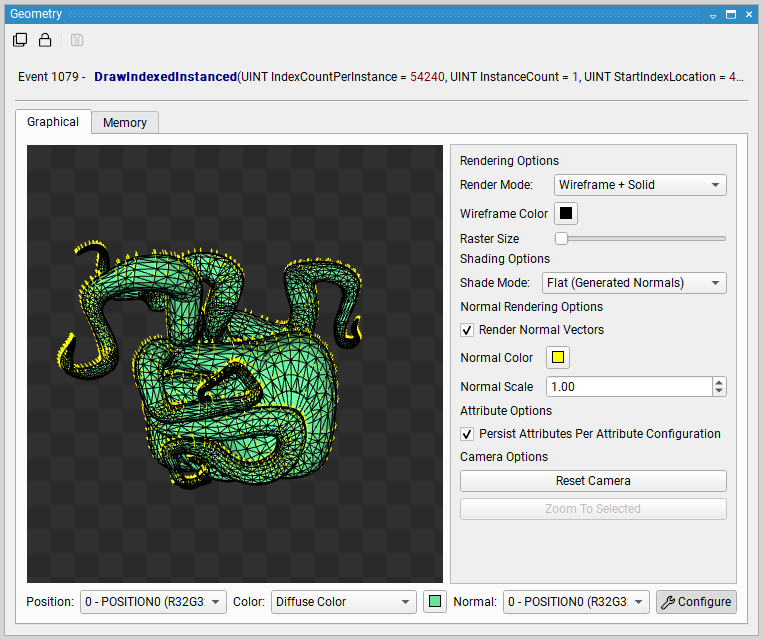
Render Mode — Determines how to render and raster geometry.
Solid: renders filled geometry.
Points: renders a vertex point cloud.
Wireframe: renders a wireframe of the geometry.
Wireframe + Solid: renders filled geometry with a wireframe on top of it.
Shade Mode — Specifies the lighting mode of the rendered image.
Selected Color Attribute: Shades with the specified color attribute
Flat Shading Using Generated Normals: Renders the geometry using flat shading with calculated normals
Flat Sharing Using Normal Attribute: Renders the geometry using flat shading with the specified Normal Attribute.
Smooth Shading Using Normal Attribute: Renders the geometry using smooth shading with the specified Normal Attribute.
Render Normal Vectors — Renders the specified normal attribute as a vector pointing from each vertex. The vector may be colored by the Normal Color selection and may be scaled by the Normal Scale selection.
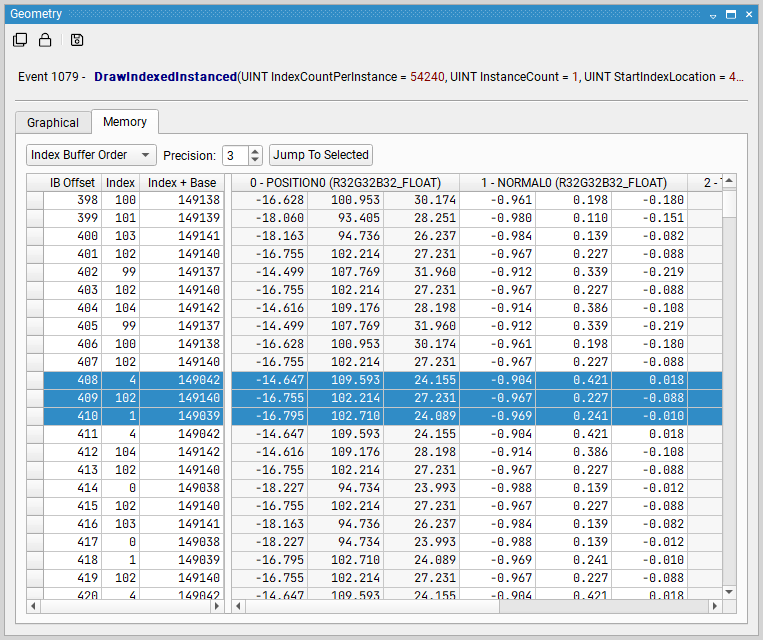
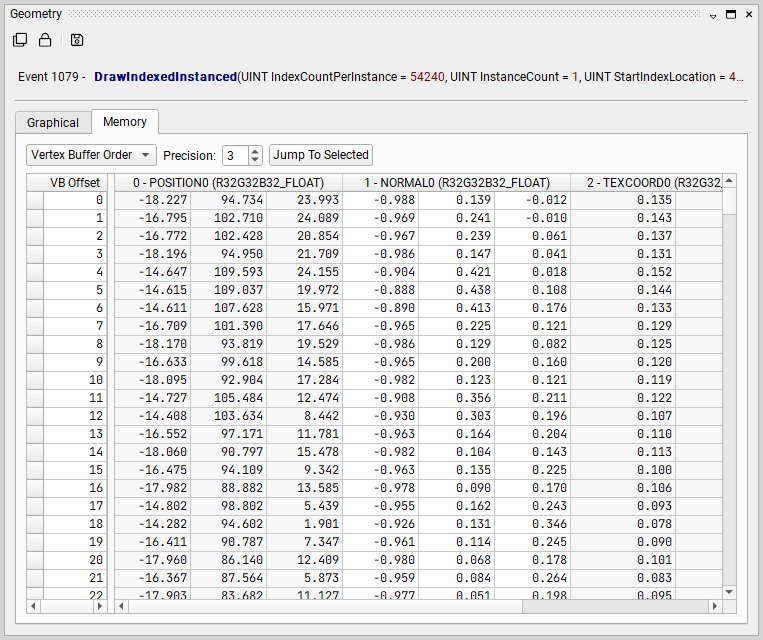
Memory Tab
The Memory tab of the Geometry View shows the contents of the vertex buffer, as interpreted by the current vertex or input attribute specification. This view is useful for seeing the raw data of your draw call. An additional capability of this view is that it highlights invalid or corrupt vertices to streamline finding problematic data. Another useful feature is that the selection linkage to the graphical viewer, where selecting a memory row also selects the associated primitive.
There are two modes of display for the geometry data:
Index Buffer Order shows the vertices as indexed by the current index buffer and current draw call.
Vertex Buffer Order shows the vertices as linearly laid out from the start of the vertex buffer and draw call specification.
Object Browser#
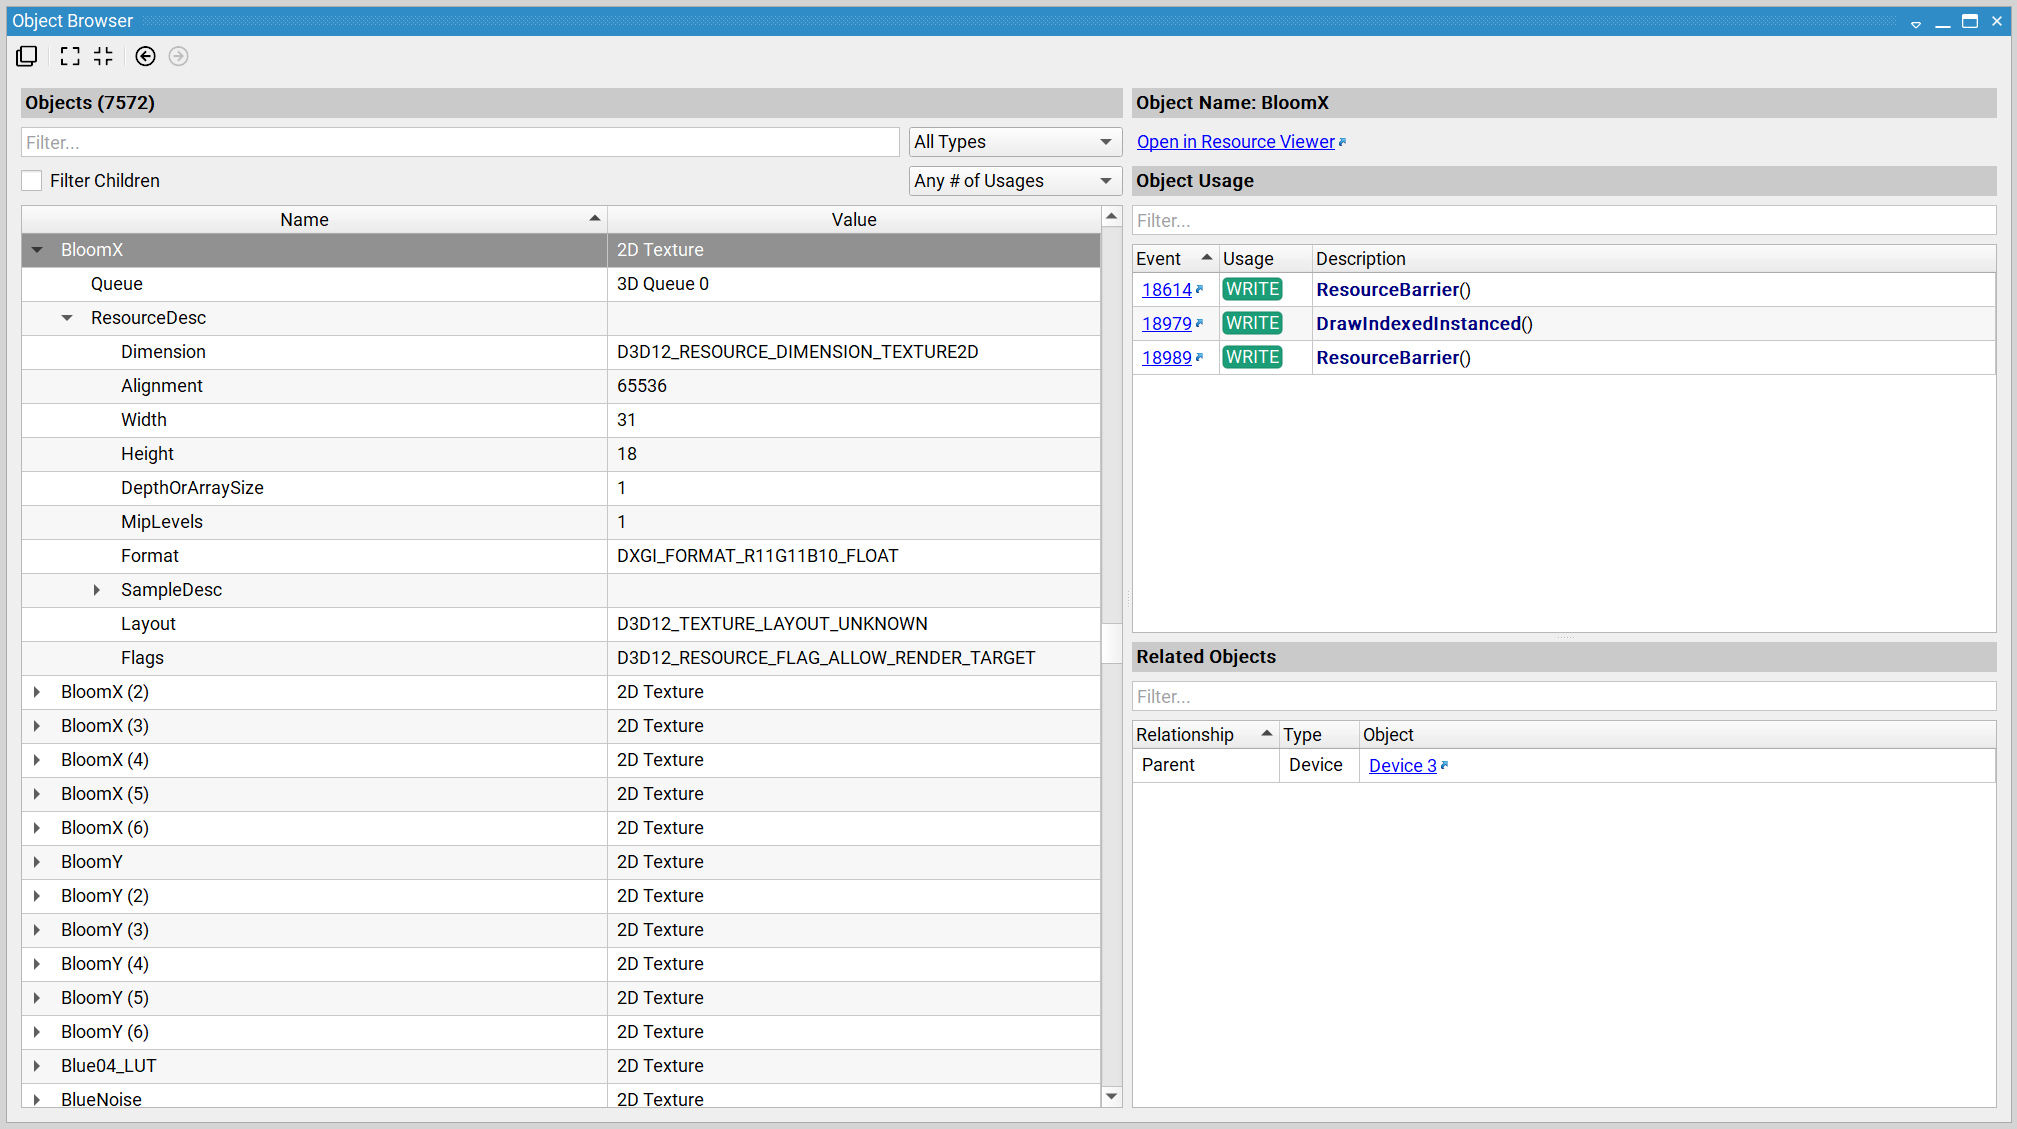
The Object Browser view provides a list of all objects tracked for your frame, listed by name and by type. Beneath each object is a list of the properties and other metadata that Nsight Graphics tracks. This view is useful for finding objects that utilize a particular kind of property, for example a memory buffer with a particular flag.
To access this view, go to Frame Debugger > Object Browser. This view is also a destination for links provided by the Event Details and Event Viewer views.
This view supports Clone capabilities. Note, however, that this view captures fixed properties and metadata for each object at the end of frame. For APIs with mutable object properties, such as OpenGL, those properties are not updated in coordination with scrubbing. As such, Lock capabilities are not applicable to this view.
This view provides two panes side-by-side. The left-hand Objects pane provides the object list as well as their properties; the right-hand pane is context-sensitive and provides additional information about the object that is selected on the left-hand side.
Objects Pane#
The objects pane (left-hand side) provides several capabilities for filtering objects:
Object names and properties can be filtered via the filter box.
Object types can be filtered via the types combo box (default is All Types).
Objects can be filtered as to whether they report usages (default is Any # of Usages).
The Filter Properties checkbox determines whether the properties of an object are considered when filtering items in the object tree view.
Object Name#
This section shows the name of the selected object.
When the selected object has a specific viewer for viewing additional information about that type, a link to that specific viewer is provided. For example, texture resources provide a link to opening the selected texture in the Resource Viewer.
Object Usage#
This section lists a table for the events in which an object is used. Each event is tagged to indicate the Usage of that object (READ or WRITE).
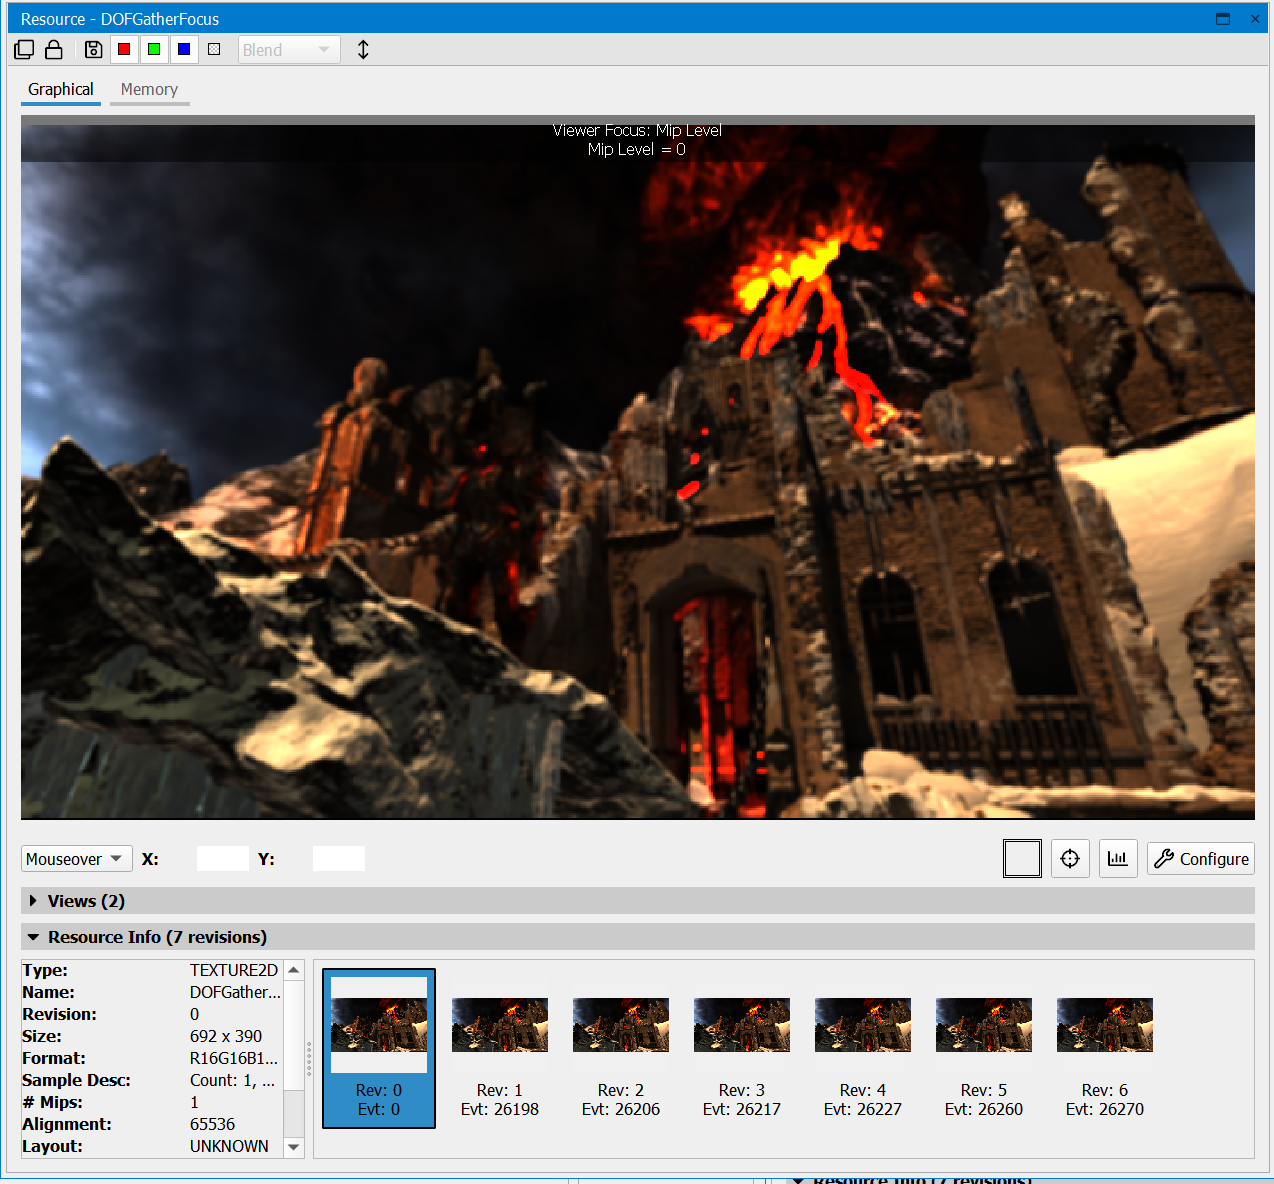
Resource Viewer#
The Resource Viewer allows you to see all of the available resources in the scene. This view is brought up by clicking resource links in any frame debugging view.
The Resource Viewer is opened through links from resource thumbnails or entries in many Nsight views, for example from the API Inspector or All Resources View.
Once opened, there are two tabs available:
Graphical
Memory
Graphical Tab
The Graphical tab allows you to inspect the resource, pan using the left mouse button to click and drag, zoom using the mouse wheel, and inspect pixel values. Also, this is where you can save the resource to disk. If supported on your GPU and API, this is also where you can initiate a Pixel History session to get all of the contributing fragments for a given pixel.
When you have selected a buffer from the left pane, the Show Histogram button is available on the right side of the Graphical tab, which allows for remapping the color channels for the resource being viewed.
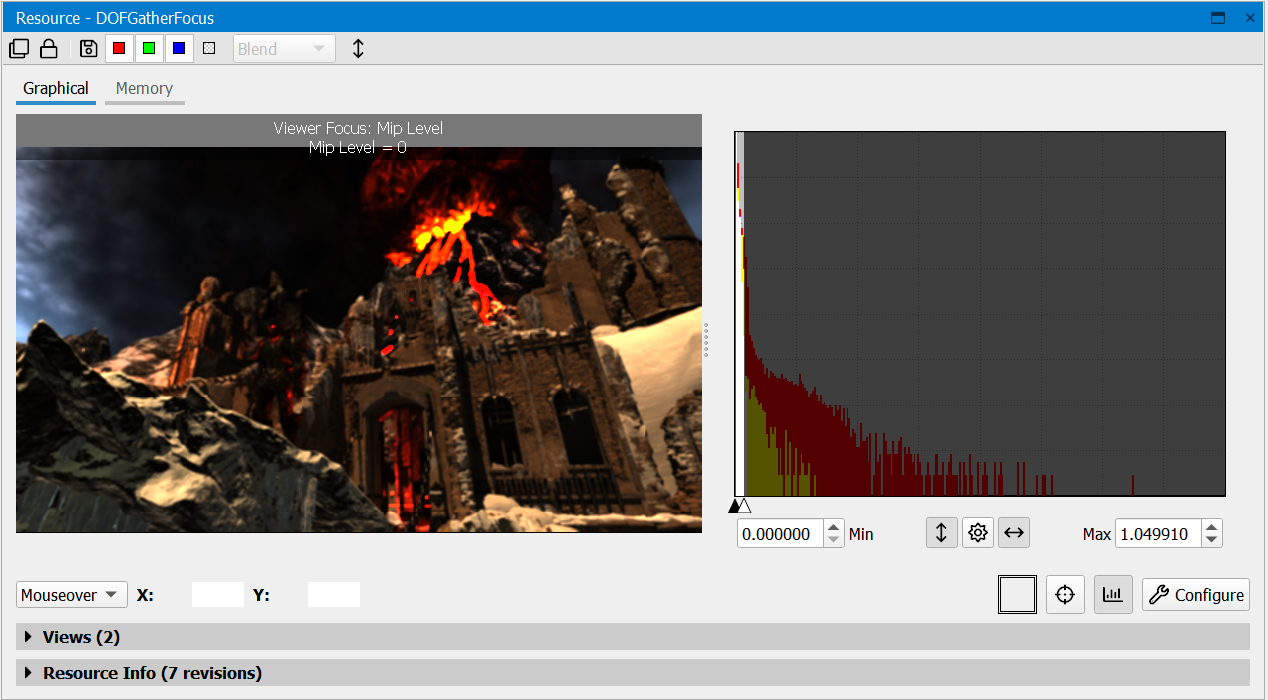
To modify the histogram view, the following options are available:
You can set the minimum and maximum cutoff values via the sliders under the histograms, or by typing in values in the Minimum and Maximum boxes.
You can change the scale by using the Log button.
The Luminance button allows you to visualize luminance instead of color values.
The Normalize button can preset the minimum and maximum values to the extents of the data in the resource.
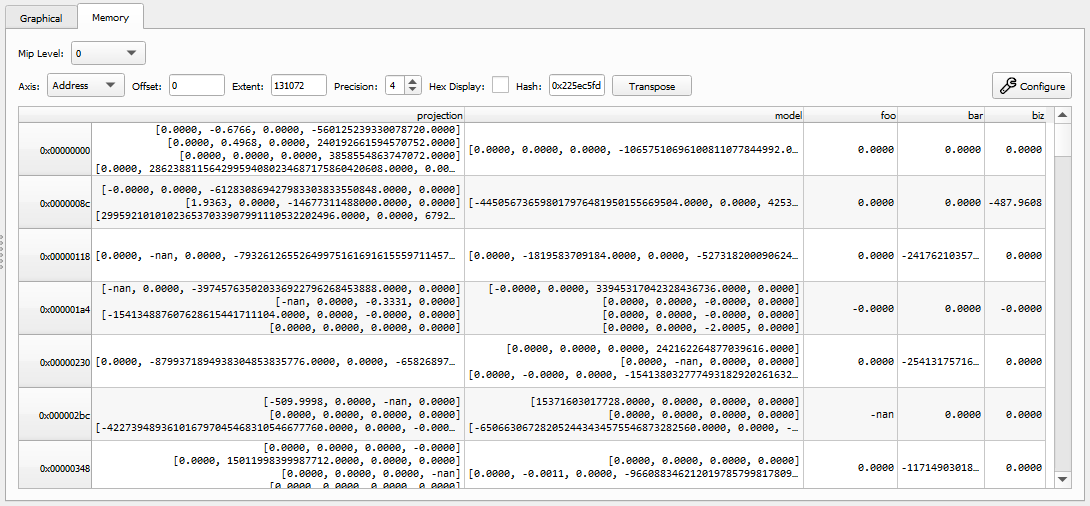
Memory Tab
The Memory tab shows a dump of the resource data.
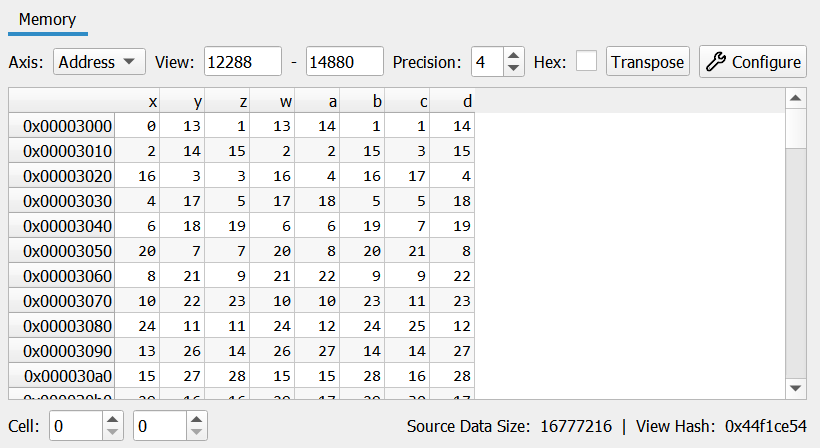
You can use multiple options to configure how this memory is displayed:
The Axis drop-down changes between address (memory offset) and index (array element) views.
The Offset entry limits the view to an offset within the given resource.
The Extent entry limits the view to a maximum extent within the given resource.
The Precision spin box controls the number of decimal places to show for floating point entries.
The Hex Display toggles between decimal (base-10) and hex (base-8) display formats.
Hash shows a hash value representative of the given memory resource within the current offset and extent. This is useful for comparing memory objects or sub-regions.
The Transpose button swaps the rows and columns of the data representation.
The Configure button opens the Structured Memory Configuration dialog.
Additional Capabilities
There are a number of additional capabilities in this view. At the top of the viewer, you’ll find a toolbar:
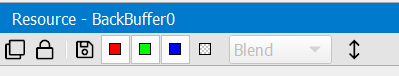
Clone — makes a copy of the current view, so that you can open another instance.
Lock — freezes the current view so that changing the current event does not update this view. This is helpful when trying to compare the state or a resource at two different actions.
Save — saves the captured resources to disk.
Red, Green, and Blue — toggles on and off specific colors.
Alpha — enables alpha visualization. In the neighboring drop-down, you can select one of the following two options:
Blend — blends the alpha with a checkerboard background.
Grayscale — alpha values are displayed as grayscale.
Flip Image — inverts the image of the resource displayed.
Pixel History#
Pixel history enables the automatic detection of the draw, clear, and data-update events that contributed to the change in a pixel’s value. In addition, pixel history can identify the fragments that failed to modify a particular texture target, allowing you to understand why a draw might be failing, such as whether you may have misconfigured API state in setting up your pipeline.
To run a pixel history test, click the ![]() button and select a pixel to run the experiment on. The Pixel History view comes up with a loading bar and presents the results once they are complete.
button and select a pixel to run the experiment on. The Pixel History view comes up with a loading bar and presents the results once they are complete.
Structured Memory Configuration#
The Structured Memory Configuration dialog allows the user to specify a data layout to interpret the raw data backing the selected resource. For example, a texture may be represented by its color channels or a uniform buffer may be represented by the various types packed within that buffer.
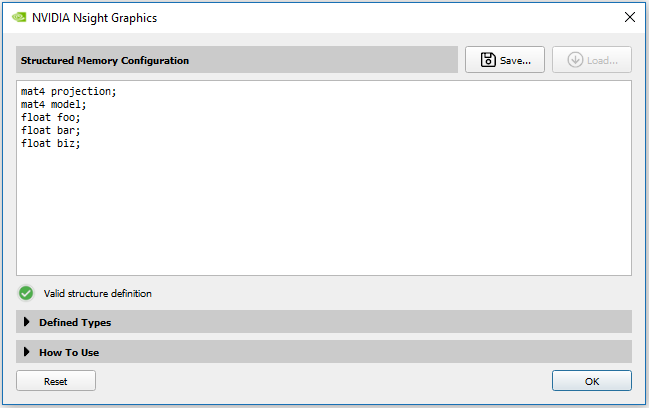
Typing in a valid structure definition automatically updates the viewer to respect the configuration.
New columns can be created using a simple C-like syntax.
int;      // creates a column with an anonymous int
int x;    // creates a second column with an int named x
float y;  // creates a third column with a float named y
Where additional user types can be defined like the following:
struct MyType{ int x; float y;};
struct MyOtherType{ MyType z; double u; };
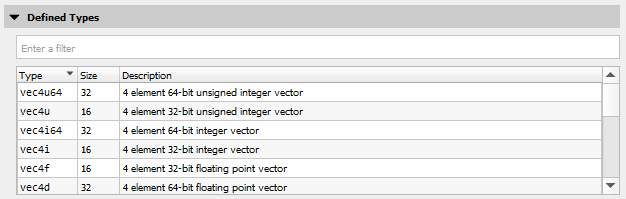
Many common sized, unsized, and normalized types are permitted as valid types. Vector and matrix types are provided in a similar syntax to HLSL and GLSL. The full list of supported types can be browsed and searched by clicking on the expandable “Defined Types” sub-section of the configuration dialog.
As some additional notes on the parser:
Full C/C++ grammar is not supported.
Single line comments are accepted; C-style block comments (
/* */) are not.Macros are not currently supported.
Alignments are not considered; all types are considered packed.
To add explicit padding, use
padNwhere N is a multiple of 8.Members can be selectively hidden as well, which can be useful for narrowing your data.
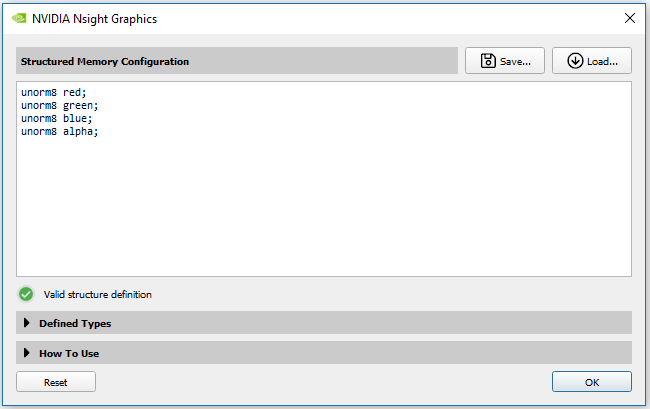
When clicking on a texture resource, the configuration is automatically populated to interpret the channels of that format.
Similarly, buffers are defaulted to a generic byte configuration. You can typically interpret this buffer data by examining the specific use case. For example, the layout of a vertex buffer can be seen in the Input Assembler section of the API Inspector view, or a uniform buffer can be interpreted by looking at the data layout specified within the shader source.
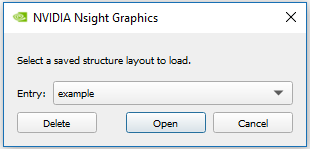
To persist a configuration, you can click on the Save… button to assign a name to this configuration.
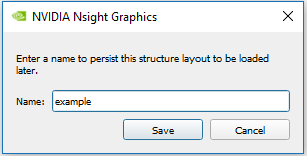
Later, you can restore this configuration by clicking on the Load… button.
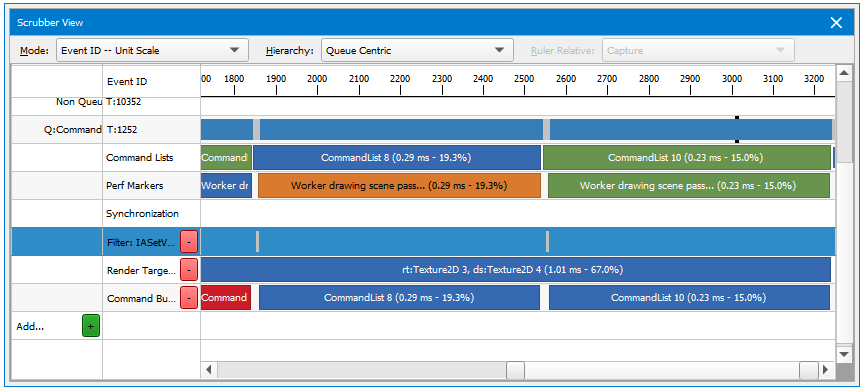
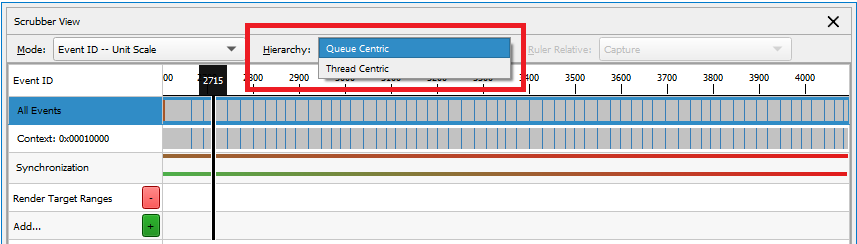
Scrubber#
The Nsight Graphics Frame Debugger has two parts. One part appears as the Frame Debugger window on the host. The other part appears as a Heads-Up Display (HUD) on the target application.
To access this view, go to Frame Debugger > Scrubber.
The part of the Frame Debugger that appears as a HUD on the target machine is comprised of the following:
HUD Toolbar — controls the frame capture, along with a number of other options (help, etc.).
Frame Scrubber — indicates the current draw event. There is a Scrubber view in the Frame Debugger on the host, as well as a frame scrubber on the HUD. The frame scrubber controls stay in synch with each other, meaning that when you move the controls on one, it affects the other. For example, if you move the frame scrubber on the HUD to highlight a new draw event, the scrubber on the Frame Debugger moves in sync to do likewise.
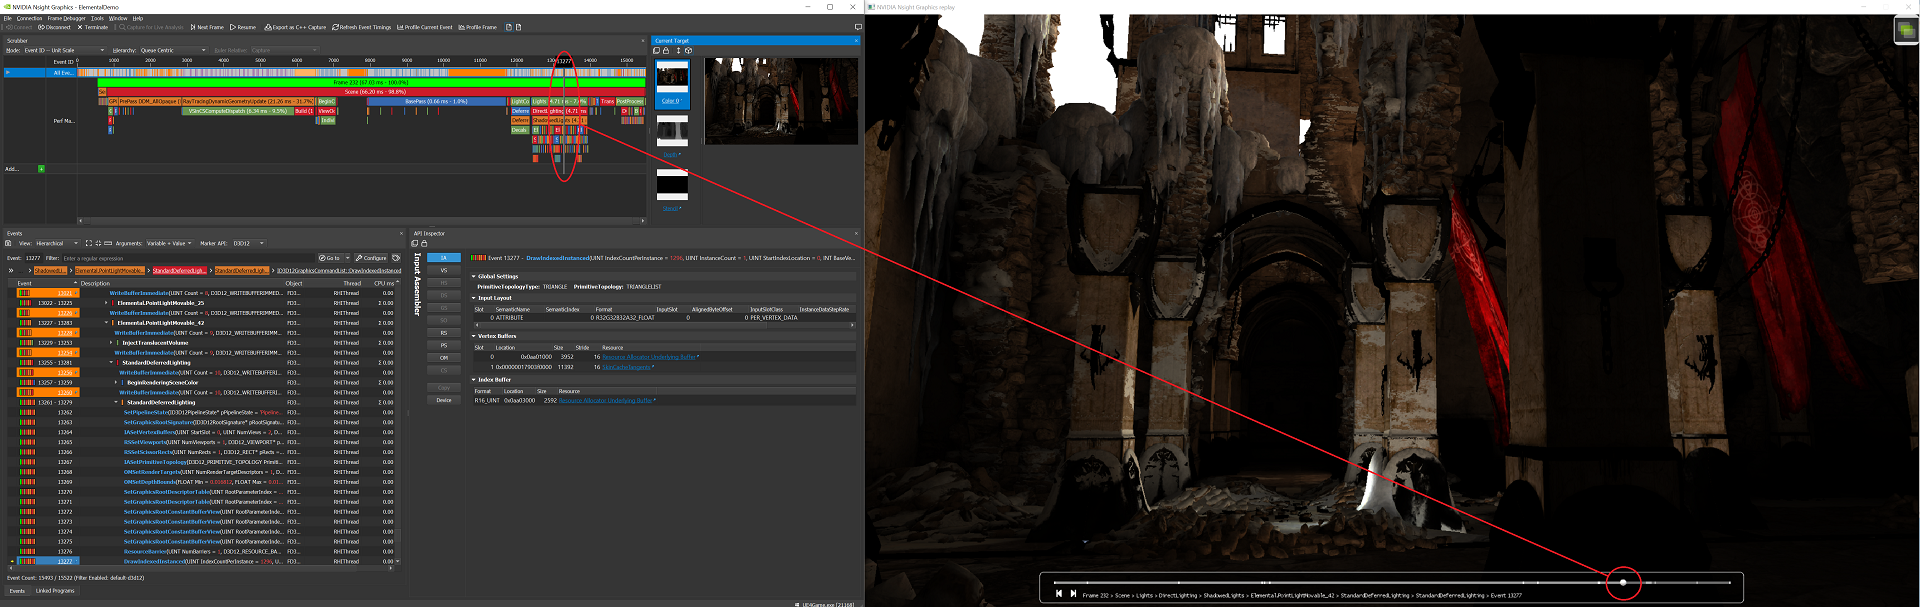
Understanding the Frame Scrubber#
For the sake of discussion when it comes to graphics debugging, it helps to note some common terminology.
An event is a single call to the API. It could be a triangle draw call, or backbuffer clear, or a less obvious call, like configuring buffers. A snapshot is a sequence of events.
An action is a subset of the event types. It can be one of the following: (1) Draw Call, (2) Clear, or (3) Dispatch. Actions are interesting since they explicitly change data which may result in visual changes.
Note
For Direct3D frame debugging: The Direct3D runtime documentation states that, “the return values of AddRef & Release may be unstable and should not be relied upon.” The Nsight Graphics Frame Debugger also takes additional references on objects so any code that relies on an exact reference count at a particular time may fail. In general, users should not expect an exact reference count to be returned from the Direct3D runtime. For more information, see Microsoft’s Rules for Managing Reference Counts.
When you debug your graphics project, the Scrubber window shows the perf markers you implemented. When working with user-defined markers, the Scrubber window uses the color and label that you defined for the perf marker.

On the Scrubber, you can select one performance marker and it automatically creates a range of all the draw calls that occurred within that time frame. Clicking on it again causes the Scrubber to automatically zoom to that range of events. You can zoom in on a nested/child marker the same way.
To zoom out, click the parent performance marker, or use CTRL + mouse wheel.
Performance markers are also displayed on the HUD, color-coded the same way that they are on the Scrubber. However, on the HUD, the information is condensed, and you must hover your mouse over the selected performance marker to get its details.

The default view shows the events in your application, in addition to any performance markers you have defined. Clicking the Add… button opens a dialog that allows you to select what type of range you want to add.
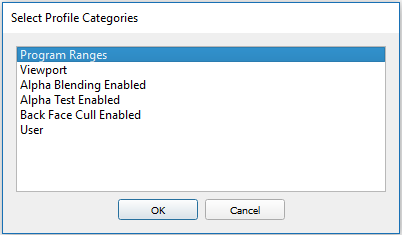
Program Ranges — Actions that use the same shader program.
Viewport — Actions that render to the same viewport rectangle.
Alpha Blending Enabled — Actions that have alpha blending enabled.
Alpha Test Enabled — Actions that have alpha test enabled.
Back Face Cull Enabled — Actions that have back face cull enabled.
User — A range defined by you on the fly. Use SHIFT + left-click and drag the Scrubber on the created “User” row to create a new range.
Right-clicking on a specific action in the Scrubber allows you to open the API Inspector for that action, change your view settings, or initiate a shader profile.
Scrubber View Options

From the Mode drop-down menu, choose one of the following:
Unit Scale is the default view, which simply shows the actions and events on the timeline.
GPU Time Scale displays the GPU activity and how much each event or action cost the GPU.
CPU Time Scale displays the CPU activity and how much each event or action cost the CPU.
X by CPU, Y by GPU displays the CPU time scale on a horizontal X-axis, and the GPU time scale on a vertical Y-axis.
Depending on which mode you select, you can also select whether you want to view the ruler relative to the capture, viewport, or cursor.

From the Hierarchy drop-down, Queue Centric sorts the events by queue, while Thread Centric sorts the events by the thread.
Using Hotkeys to Scrub Through a Frame
When the Scrubber has focus, you can use the following hotkeys to move the Scrubber cursor from one event to another.
Navigation |
|
|---|---|
|
Go to the first event. |
|
Go the last event. |
|
Go to the previous event. |
|
Go to the next event. |
|
Expand the current event group (HUD only). |
|
Collapse the current event group (HUD only). |
|
Current event: show less information (HUD only). |
|
Current event: show more information (HUD only). |
Zooming and Panning |
|
|
Zoom in X-axis |
|
Zoom out X-axis |
|
Reset zoom |
|
Increase row height (all rows) |
|
Decrease row height (all rows) |
|
Pan |
|
View zoom window |
Cursor and Selection |
|
|
Set cursor (Places cursor at closest point to the start of a range.) |
|
Select row (The selected row is highlighted in orange.) |
|
Make range selection |
|
Zoom to range |
|
Open API Inspector |
CTRL + A |
Select all events |
For the purpose of moving the Scrubber cursor, the following are considered action events:
Draw methods
Clear methods
Dispatch methods
Present methods
For example, if you are looking for the next draw method that was called, you can press the CTRL + RIGHT ARROW on the keyboard to skip over events that are not typically of interest, and only stop on events that are considered action events.
Shader Profiling#
The Shader Profiler is a tool for analyzing the performance of SM-limited workloads. It helps you, as a developer, identify the reasons that your shader is stalling and thus lowering performance. With the data that the shader profiler provides, you can investigate, at both a high- and low-level, how to get more performance out of your shaders. See the Shader Profiler section for more information.
Linked Programs View#
The Linked Programs View lists all of the shaders in your application.
To access this view, go to Frame Debugger > Linked Programs.
If the shader (or its parent program or pipeline object) hasn’t been used by the application yet, it shows up with the
 symbol in the Status column.
If the shader has been used, selected statistics are presented for that shader.
For programs or pipeline objects, you can view the individual shaders by pressing the ► button to the left of the program/pipeline name. When expanded, you can select the link to open a text view of the shader source (when available).
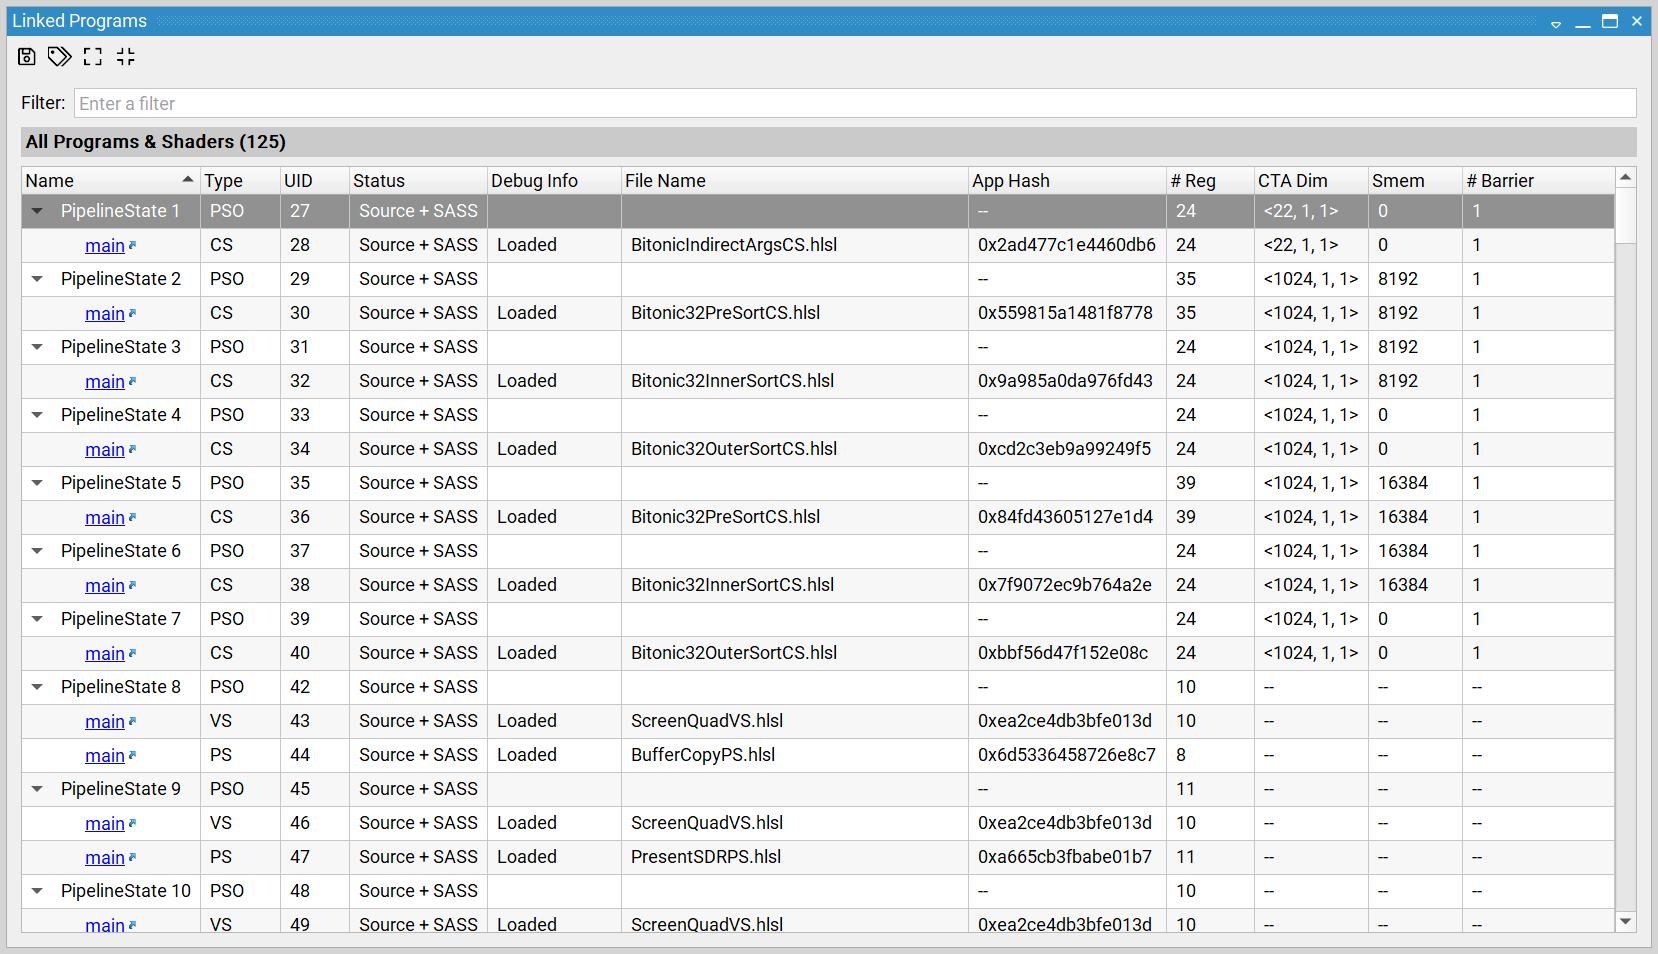
Name
This is the name of the shader. This name is either generated internally, or can be assigned by the user per API.
Type
The type of the shader: Vertex, Pixel, Compute, etc.
UID
Indicates a unique object ID for the associated pipeline or shader.
Context
Indicates to which of the application’s contexts this shader is owned. Shown on multi-context OpenGL applications, only.
Status
This column displays the current status of the shader. The status includes Source or Binary, to denote whether or not source code is available for this shader. Also, if the SASS text is included, this means that we have driver level binary code that is necessary for gathering shader performance metrics.
The
The
symbol means that shader performance metrics are currently being computed.
Debug Info
This column indicates that availability and load status of debug information for the associated shader.
File Name
Lists the file name from which the shader was compiled for those shaders with debug info that provides this information.
App Hash
This column displays a unique hash of application level shader information (e.g., bytecode).
# Reg
This column gives the number of registers used by the program. Register count impacts occupancy/threads in flight. This may be not available for all shaders.
The following columns are only valid for compute shaders
CTA Dim
Indicates the CTA dimensions used by the shader.
Smem
Indicates the shared memory allocated for the shader per warp/thread.
# Barrier
Indicates the number of barriers used by the shader.
Ray Tracing Inspector#
The Ray Tracing Inspector shows the geometry that has been specified in build commands when running an application that uses ray tracing APIs. If the application does not use these APIs, the view is not available.
In Ray tracing APIs, such as DXR and NVIDIA Vulkan Ray Tracing, an acceleration structure is a data structure that describes the full-scene geometry that is traced when performing the ray tracing operation. This data structure is described in detail in the following links: https://developer.nvidia.com/rtx/raytracing/dxr/DX12-Raytracing-tutorial-Part-1 and https://developer.nvidia.com/rtx/raytracing/vkray.
This data structure is purpose-built to allow for translation to application-specific data structures that perform well on modern GPUs. While constructing this data structure, the developer has the responsibility of constructing the structure correctly and using flags to identify the functional and performance characteristics within it. Needless to say, this can be an error-prone operation.
Nsight Graphics Ray Tracing Inspector allows you to view the structures you are creating, navigate through them, and see the flags that you are using. Additionally, you can filter and colorize the structure to highlight, at a bird’s eye view, different kinds of geometry.
The Ray Tracing Inspector is opened through links from resource thumbnails or entries in many Nsight Graphics views, such as the API Inspector or All Resources View. For example, the Ray Tracing Inspector can be opened from the API Inspector View when scrubbed to a build event trace rays call. When scrubbed to these events, the view presents a list of the active structures with a link to open each.
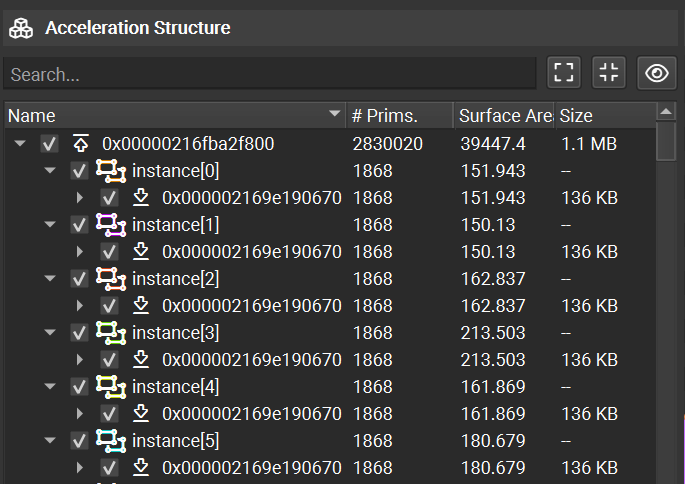
The view is multi-paned — it shows a hierarchical view of the acceleration structure on the left, a graphical view of the structure in the middle, and controls and options on the right. Additionally, a performance analysis section is present on the lower-left. With the hierarchy of the Acceleration Structure tree view, the top-level acceleration structure (TLAS), bottom-level acceleration structures (BLAS), child instances, child geometries, and memory sizes are presented. When a particular item is selected, the name, flags, and other meta-data for this entry are listed in a section on the bottom left-hand side. Each item within the tree has a check box that allows the rendering of the selected geometry or hierarchy to be disabled. Double-clicking on an item jumps to the item in the rendering view and automatically adjusts the camera speed to be relative to the size of the selected object.
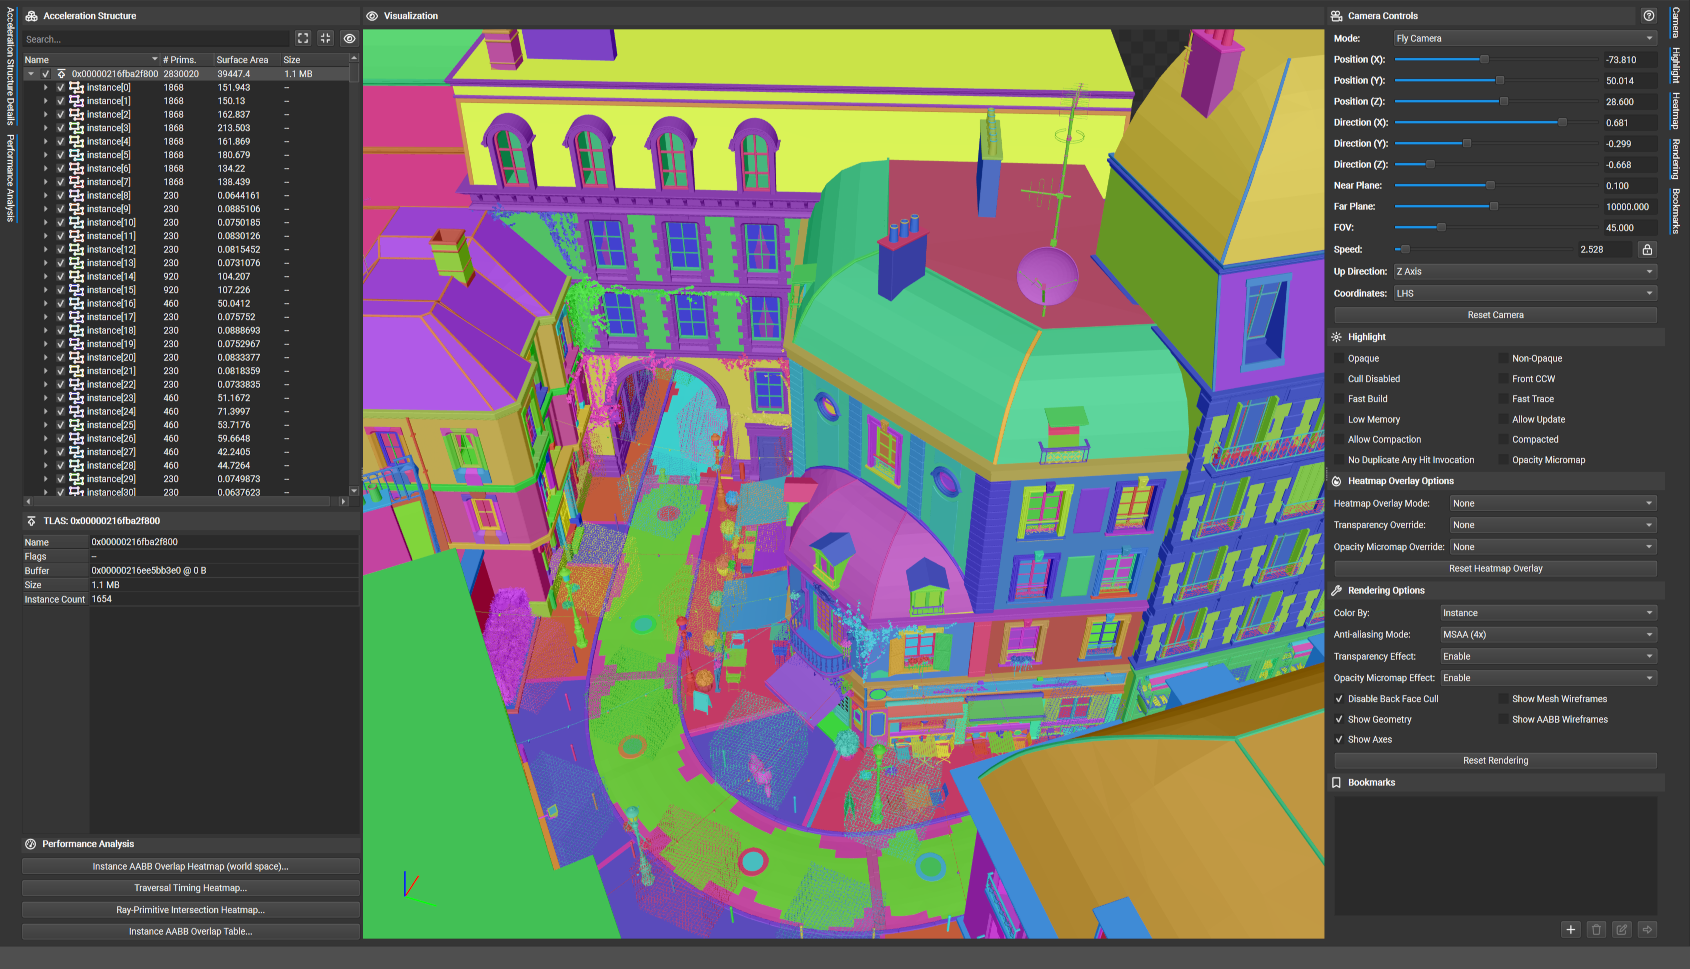
Column |
Description |
|---|---|
Name |
An identifier for each row in the hierarchy. Click on the check box next to the name to show or hide the selected geometry or hierarchy. Double-click on this entry to jump to the item in the rendering view. |
# Prims |
The number of primitives that make up this geometry. |
Surface Area |
A calculation of the total surface area for the AABB that bounds the particular entry. |
Size |
A calculation of the memory usage for this particular level. Hover over this entry to see a tooltip that includes a roll-up calculation of the aggregate memory usage of this hierarchical level and children below it. |
Performance analysis tools are accessible in the bottom left corner on the main view. These tools help identify potential performance problems that are outlined in the RTX Ray Tracing Best Practices Guide. These analysis tools aim to give a broad picture of acceleration structures that may exhibit sub-optimal performance. To find the most optimal solution, profiling and experimentation is recommended but these tools may paint a better picture as to why one structure performs poorly compared to another.
Action |
Description |
|---|---|
Instance Overlaps |
Identifies instance AABBs that overlap with other instances. Consider merging BLASes when instance world-space AABBs overlap significantly to potentially increase performance. |
Instance Heatmap |
Enters a heatmap mode that shows the approximate number of instances AABBs that are hit by a ray cast from each pixel within the current viewport. This mode offers a convenient way to scan your scene for potentially problematic geometries. |
Navigation#
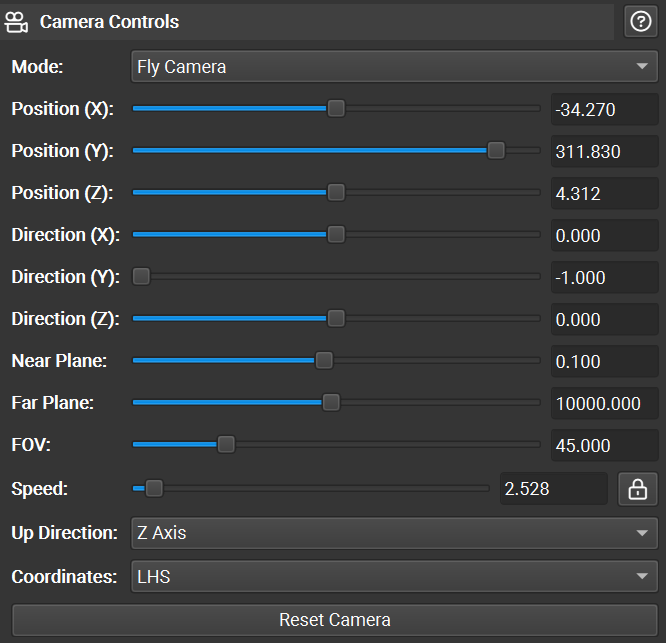
The Ray Tracing Inspector supports multiple navigation modes. The navigation mode can be changed using the combo box in the camera controls pane, to the right of the rendering pane. The keyboard and mouse bindings for each mode are as follows:
Binding |
Fly Camera |
Dolly Camera |
Orbit Camera |
|---|---|---|---|
|
Move forward, backward, left, right |
Move forward, backward, left, right |
Track (Move up, down, left, right) |
|
Move up/down |
Move up/down |
n/a |
|
Increase/decrease field of view |
Increase/decrease field of view |
Increase/decrease field of view |
|
Move faster/slower |
Move faster/slower |
Move faster/slower |
|
Zoom in/out |
Zoom in/out |
Zoom in/out |
|
Rotate in place |
Rotate left/right, move forward/backward |
Rotate around the geometry |
|
Zoom in/out |
Rotate in place |
Zoom in/out |
|
Track (Move up, down, left, right) |
Track (Move up, down, left, right) |
Track (Move up, down, left, right) |
|
Temporarily switch to Orbit Camera |
Temporarily switch to Orbit Camera |
n/a |
|
Focus on the selected geometry |
Focus on the selected geometry |
Focus on the selected geometry |
Based on the coordinate system of the input geometry, you may need to change the Up Direction setting to Z-Axis or the Coordinates setting to RHS. To reset the camera to its original location, click Reset Camera.
There are also a selection of Camera Controls for fast and precise navigation. To save a position, use the bookmarks controls. Each node within the acceleration structure hierarchy can also be double-clicked to quickly navigate to that location.
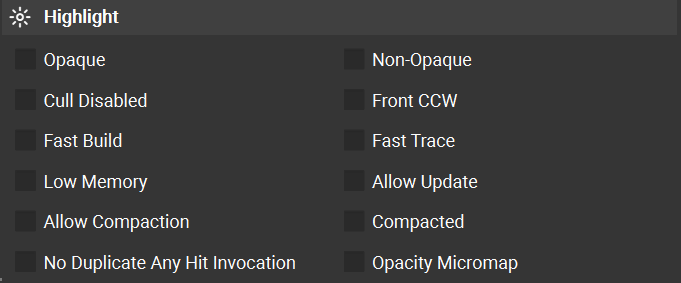
Filtering and Highlight#
The acceleration structure tree view supports geometry filtering as well as highlighting of data matching particular characteristics. The checkboxes next to each geometry allow individual toggling between full rendering, wireframe rendering, and no rendering. Combining this capability with search allows for you to identify the geometry of interest (by name when the application has named its resources) and display just that geometry.
Geometry instances can also be selected by clicking on them in the main graphical view. Additionally, right-clicking in the main graphical view gives options to hide/show all geometry, hide the selected geometry, or hide all but the selected geometry.
Beyond filtering, the view also supports highlight-based identification of geometry specified with particular flags. Checking each Highlight option identifies those resources matching that flag, colorizing for easy identification. Clicking an entry in this section dims all geometry that does not meet the filter criteria allowing items that do match the filter to standout. Selecting multiple filters requires the passing geometry to meet all selected filters (e.g., AND logic). Additionally, the heading text is updated to reflect the number of items that meet this filter criteria.
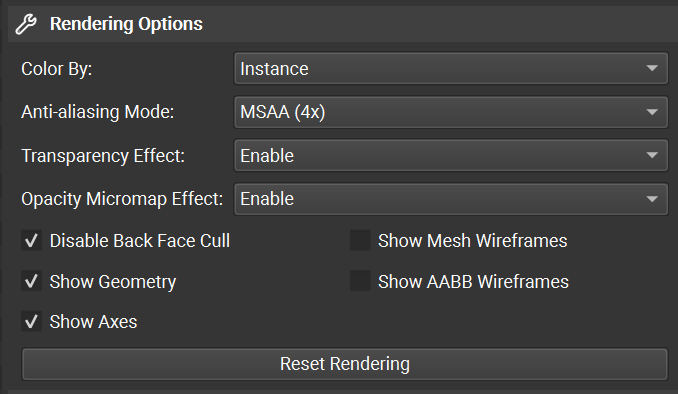
Rendering Options#
Under the highlight controls, additional rendering options are available. These include methods to control the geometry colors and the ability to toggle the drawing of AABBs.
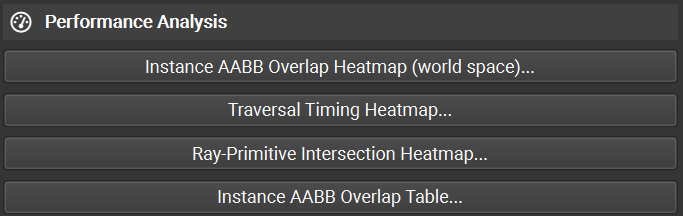
Performance Analysis#
The Ray Tracing Inspector has a number of tools that support performance analysis of your accelerations structures.
Navigation |
|
|---|---|
|
Disable the current performance analysis mode |
|
Enable Instance AABB Overlap Heatmap (world space) |
|
Enable Traversal Timing Heatmap |
|
Enable Ray-Primitive Intersection Heatmap |
|
Enable Instance AABB Overlap Table |
|
Alternate between the current and previous performance analysis mode |
Instance AABB Overlap Heatmap (world space)
This tool helps identify world-space AABB overlaps with the goal of helping a developer reduce expensive overlap.
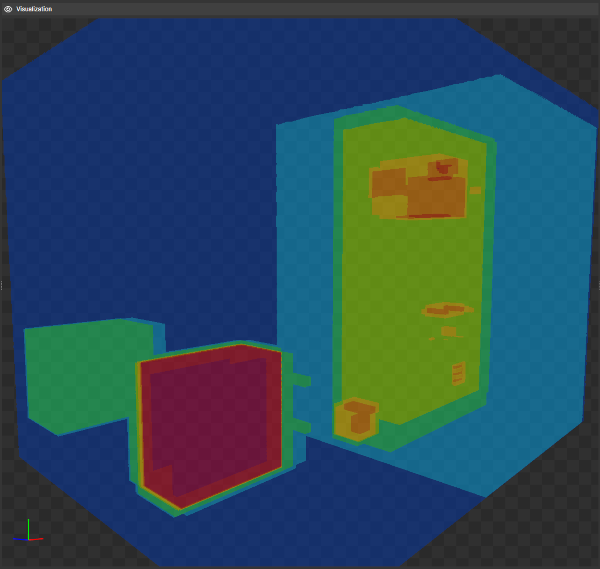
This heatmap overlay shows the maximum number of instance AABBs that overlap in world space for any direction within the current viewport. The more instances hit, the hotter the color. The heatmap threshold can be controlled by “Heatmap Overlay Options -> AABB Threshold” and depends on the number of instance AABBs overlapping.
When world-space AABBs of instances overlap, unnecessary BLAS traversal maybe required. If these overlaps are caused by empty space within a BLAS, consider splitting the BLAS such that this empty space is minimized. If these overlaps are caused by non-opaque geometries, minimize the area not marked as opaque to increase performance.
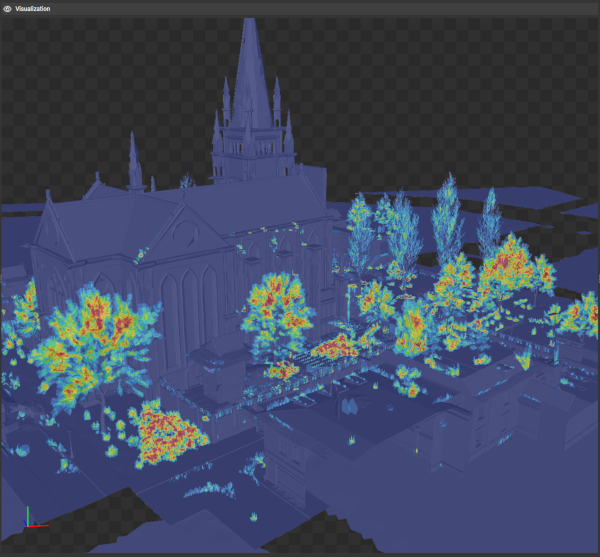
Traversal Timing Heatmap
This tool provides a heatmap of ray traversal time with the goal of identifying expensive geometry.
This heatmap overlay shows the number of GPU clock cycles required to trace a ray from the center of each pixel in the viewport to the closest geometry hit. The heatmap threshold can be controlled by “Heatmap Overlap Options -> Timing Threshold” and depends on the traversal speed of the current acceleration structure.
To determine how certain geometry affects the ray traversal speed, geometry can be hidden in which case it is ignored by this algorithm. Additionally, setting “Heatmap Overlay Options -> Opacity Override” to “Force Opaque” traverses the acceleration structure as if all geometry is opaque.
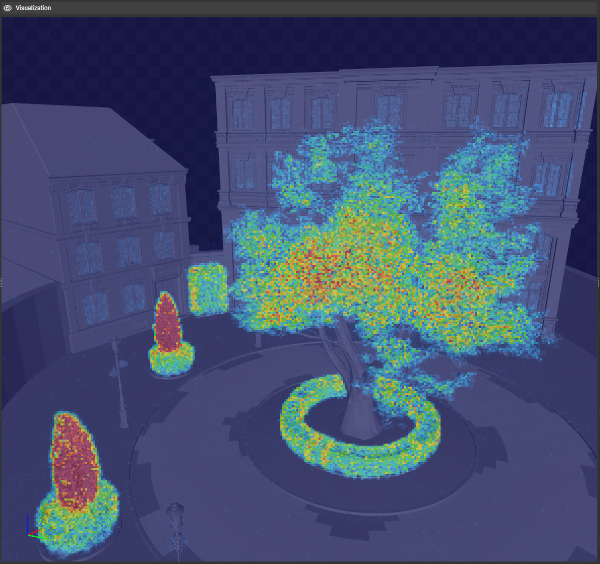
Ray-Primitive Intersection Heatmap
This tool provides a heatmap of ray geometry intersection with the goal of identify expensive geometry.
This heatmap overlay shows the number of surfaces hit by a ray traced into the scene from the center of each pixel. The more surfaces hit, the hotter the color. In this mode, opaque geometry terminates a ray. The heatmap threshold can be controlled by “Heatmap Overlay Options -> Intersection Threshold.” When geometry is not marked as opaque, a ray must be traced through all surfaces of that geometry until an opaque surface is hit. To minimize intersection tests, use the opaque geometry flag wherever possible, or use opacity micromaps the mask off opaque sections of non-opaque geometry.
Instance AABB Overlap Table
This table provides information on overlap to allow you to consider merging BLASes when instance world-space AABBs overlap significantly.
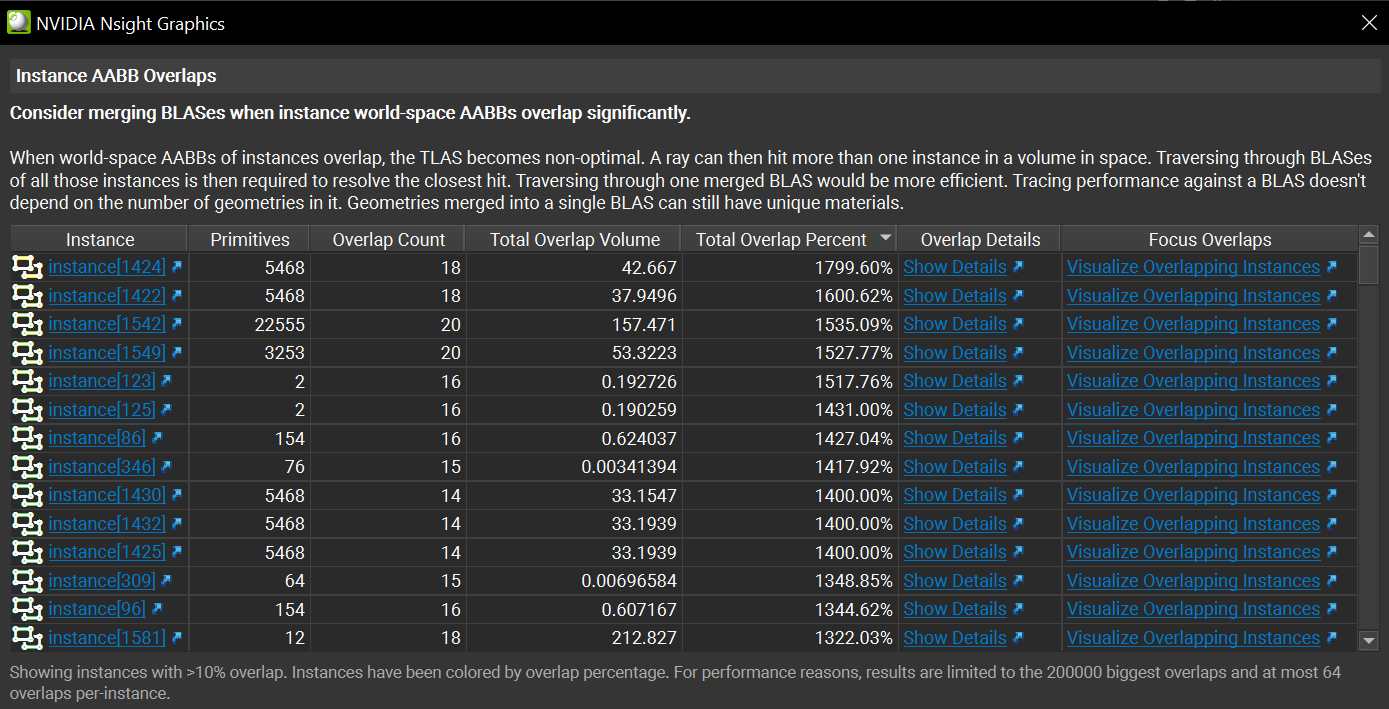
When world-space AABBs of instances overlap, the TLAS becomes non-optimal. A ray can then hit more than one instance in a volume in space. Traversing through BLASes of all those instances is then required to resolve the closest hit. Traversing through one merged BLAS would be more efficient. Tracing performance against a BLAS doesn’t depend on the number of geometries in it. Geometries merged into a single BLAS can still have unique materials.
Export#
Exporting the view, by clicking on the Save (disk) icon in the upper left of the view toolbar, allows for persisting the data you have collected beyond the immediate analysis session. This capability is particularly valuable for comparing different revisions of your geometry or sharing with others. Bookmarks are persisted as well. An example use case is identifying sub-optimal geometry, bookmarking it, and passing this document to a level designer or artist for correction.
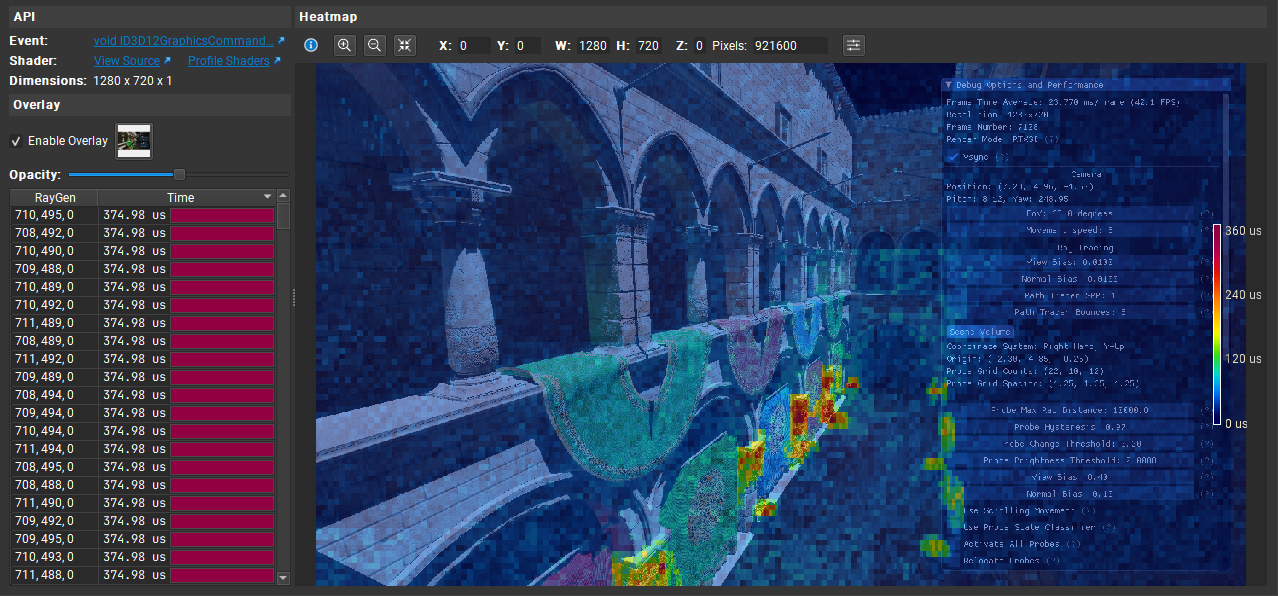
Shader Timing Heatmap View#
The Shader Timing Heatmap View shows shader execution time on the GPU. It displays a heatmap image where every pixel represents the time of one shader execution unit. The warmer color (more red) means the shader takes more time to execute, while the colder color (more blue) means the shader takes less time. This display allows you to easily identify hot spots and plan optimizations for these areas.
To access Shader Timing Heatmap View, go to Frame Debugger > Shader Timing Heatmap.
If the current event is a DirectX ray tracing or a Vulkan ray tracing call, it starts collecting shader times immediately and display them after everything is loaded. Otherwise it displays a note for you to select a proper event.
Note
At this time, Nsight Graphics only supports the collecting shader execution time of raygen shaders in DirectX ray tracing and Vulkan ray tracing applications.
The view contains multiple parts. It has API information, overlay controls and a shader timings table on the left, a heatmap viewer as well as its controls on the right.
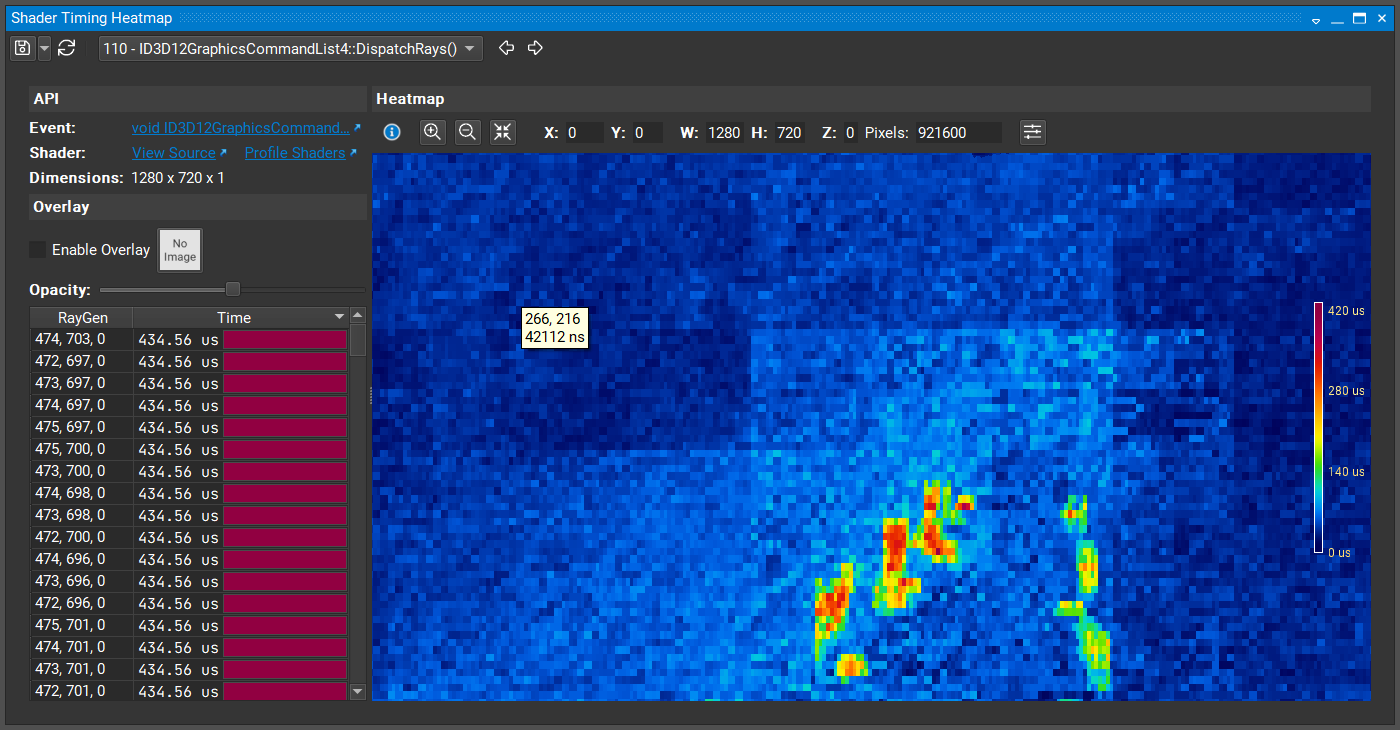
Heatmap
The heatmap viewer allows you to select a rect using the left mouse button, pan using the middle mouse button, and zoom using the mouse wheel. The table shows timings in the selected rect if there is one.
Overlay
The overlay controls allow you to select an image to be an overlay on the heatmap.
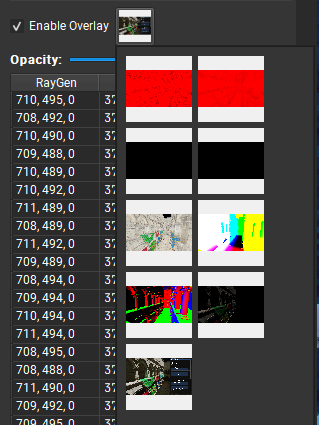
When an overlay image is selected, you are able to adjust the opacity using the slider.
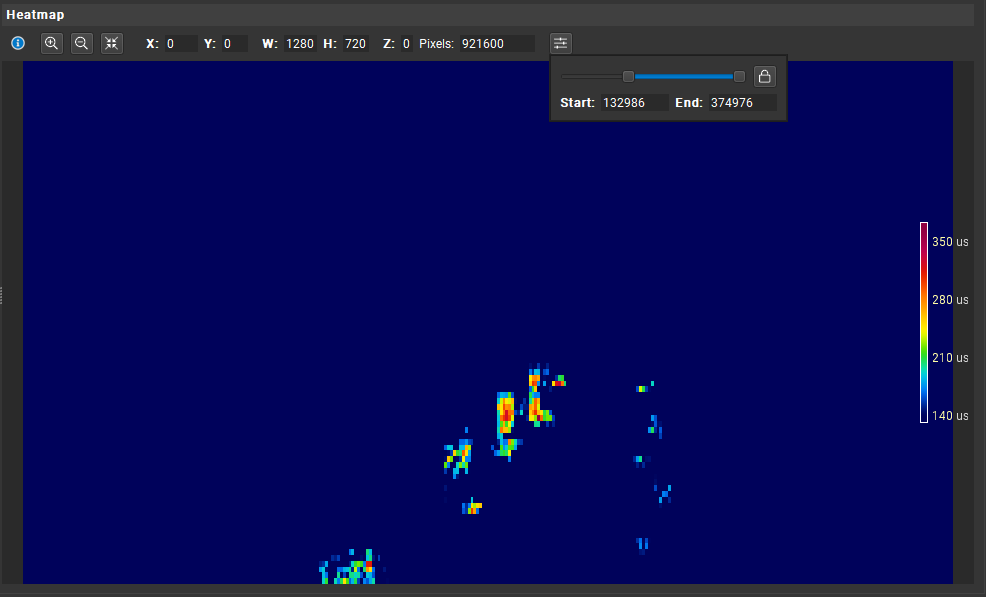
Color Mapping
On the right of the heatmap, there is a legend that shows the mapping from timing values and colors. If you want to change the mapping, click the right-most button on the heatmap and control the sliders.
Export
Click the Save button on the top-left side to export the view. This view supports saving the session, the heatmap image, or saving the table contents.
D3D12 Specific Views#
D3D12 Descriptor Heaps#
The Descriptor Heaps view displays all of the descriptor heaps bound for the current event.
To access this view, go to Frame Debugger > Descriptor Heaps.
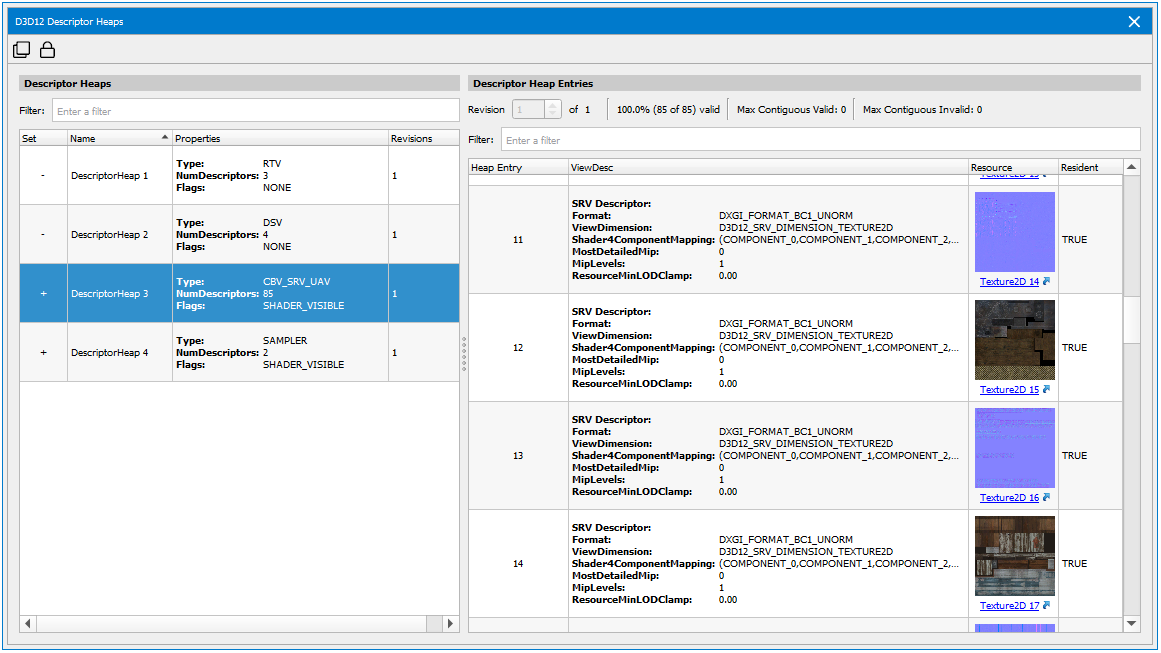
On the left are the descriptor heaps available, and on the right you can view the properties of each descriptor heap. Along the top of the details pane, you can see how populated the descriptor heap is, as well as the maximum contiguous valid and invalid ranges. These properties can help you dive into each descriptor heap, and use it as a diagnostic tool to find any potential bugs in your application.
Note that if you click the hyperlink in the Resources column, it will bring up the Resource Viewer.
D3D12 Heaps View#
The Heaps view provides a list of all heaps created by the application, along with detailed information about the resources contained in each heap.
To access this view, go to Frame Debugger > Heaps.
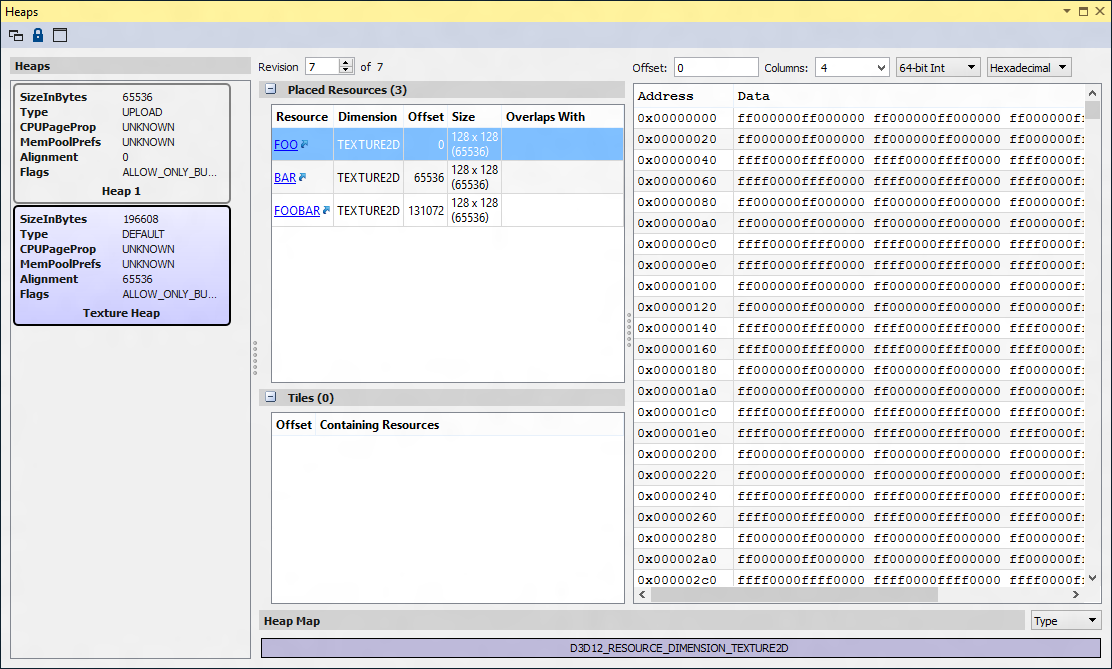
When you select a heap from the left pane, you will see all one of two types of entries: Placed Resources or Tiles. Clicking the hyperlink in the Placed Resources box will take you to the Resources Graphical tab.
Tiles are used to populate sections of a tiled resource.
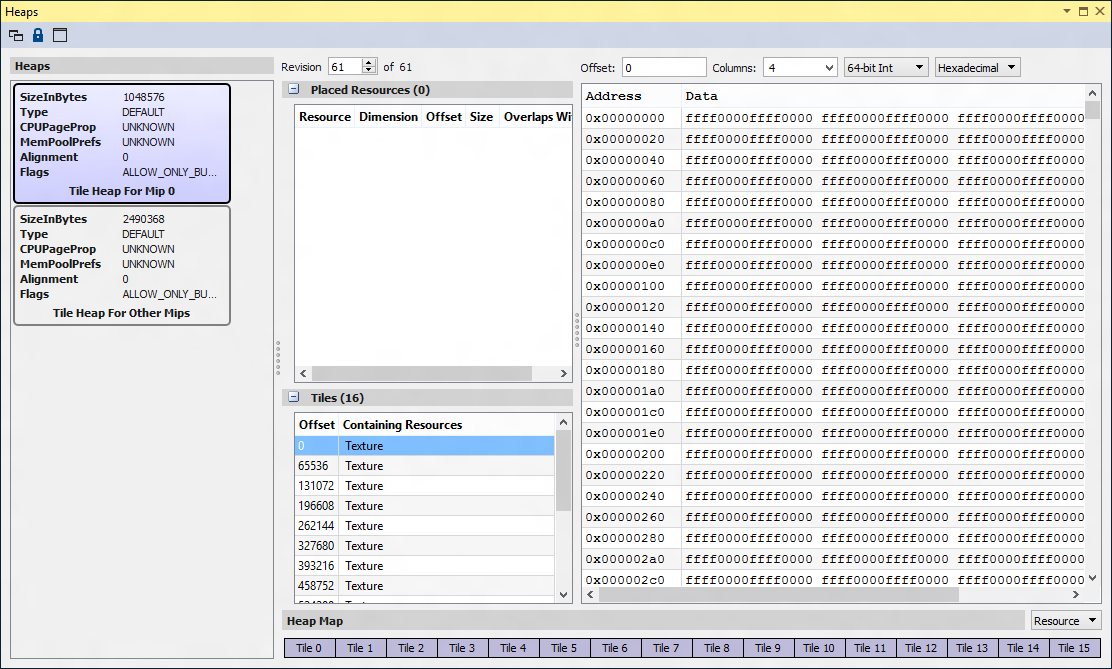
The right side of the Heaps view displays the memory data associated with the selected resource, which can also be seen on the Memory tab of the All Resources view.
Heap Map
The Heap Map shows a high-level layout of how the heap is currently being used. You can view the usage either by Type (for example, Buffer, Texture2D, etc.) or by the name of the Resource.
Type:

Resource:

The Heap Map shows any overlapping regions within the heap.
D3D12 Root Parameters#
The Root Parameters view displays all of the root parameters bound for the current event. This allows you to quickly change the state of what you’re sampling from, constants, and other descriptors at a lightweight, faster rate than past APIs.
To access this view, go to Frame Debugger > Root Parameters.
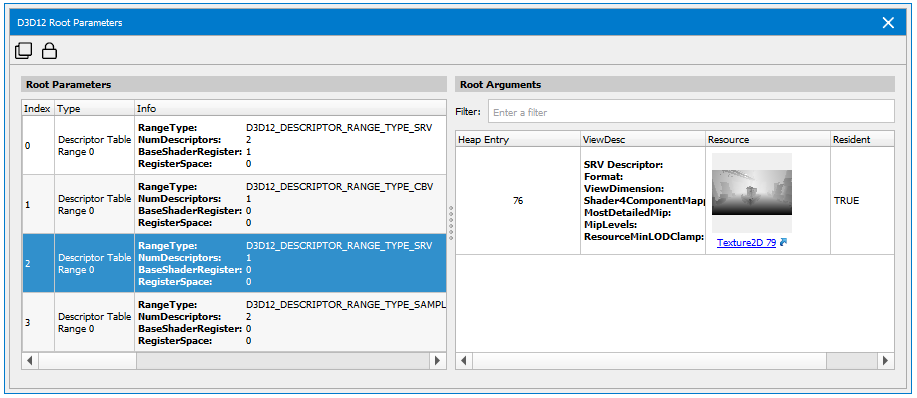
The root signature displays the structure definition of what’s bound at that moment. Root parameters fill in that structure with the values you’re sampling from and the constants you’re using.
When you select a root parameter on the left, the root arguments for that parameter are displayed on the right. This shows residency information, any invalid descriptors are displayed in red. Using root parameters as a diagnostic tool can help prevent a GPU fault.
Note that if you click the hyperlink in the Resources column, it will bring up the Resource Viewer.
Vulkan Specific Views#
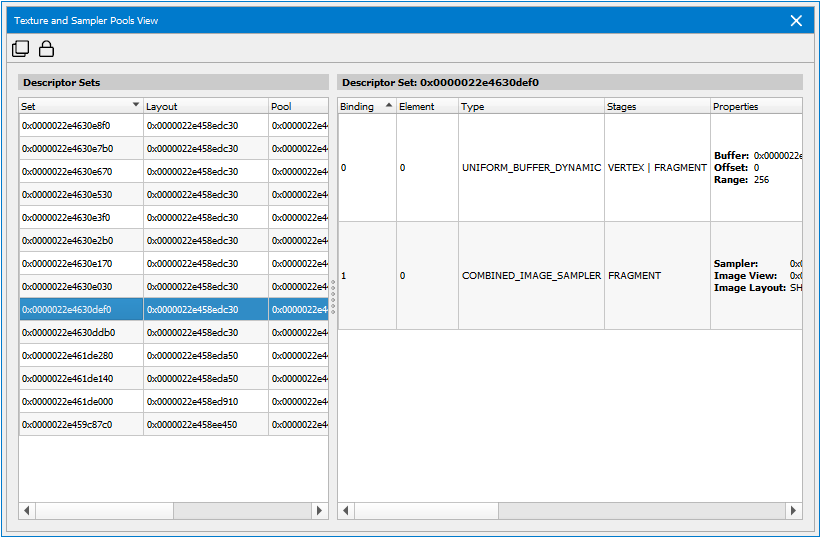
Vulkan Descriptor Sets View#
The Descriptor Set view displays all of the descriptor sets currently allocated and bound by the application at the current event.
To access this view, go to Frame Debugger > Descriptor Sets.
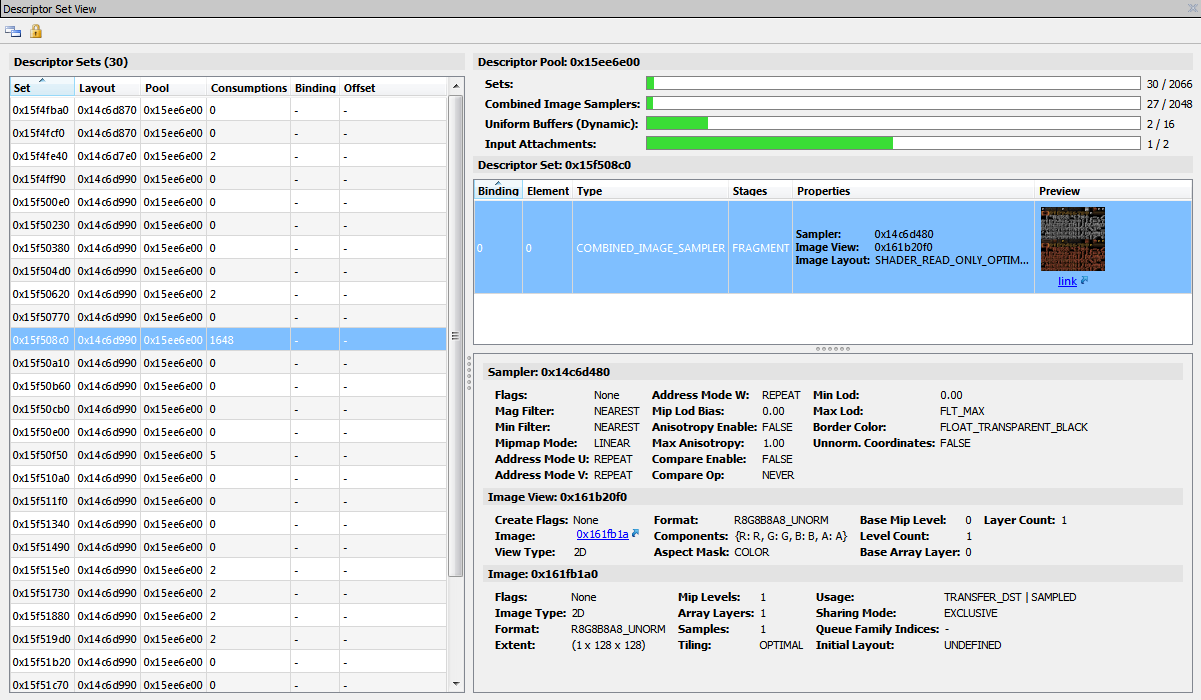
The left pane displays a selectable list of descriptor sets along with their layout, pool, consumption counts, and dynamics offsets.
When a set is selected, the right pane displays the resources currently associated with this descriptor set, as well as information related to the pool from which this descriptor set was allocated. In addition, clicking on a resource within the descriptor set displays more detailed information about that specific resource.
Note that if you click the hyperlink in the Preview column, it brings up the Resource Viewer associated with this image or buffer.
Vulkan Device Memory View#
The Device Memory view provides a list of all device memory allocated by the application, along with detailed information about the resources contained in each memory region.
To access this view, go to Frame Debugger > Device Memory.
The left-most pane contains information about all device memory objects currently allocated. Once a device memory object is selected, the contained resources are listed in the middle pane, along with the resource layout map in the bottom left, and contained data on the right.
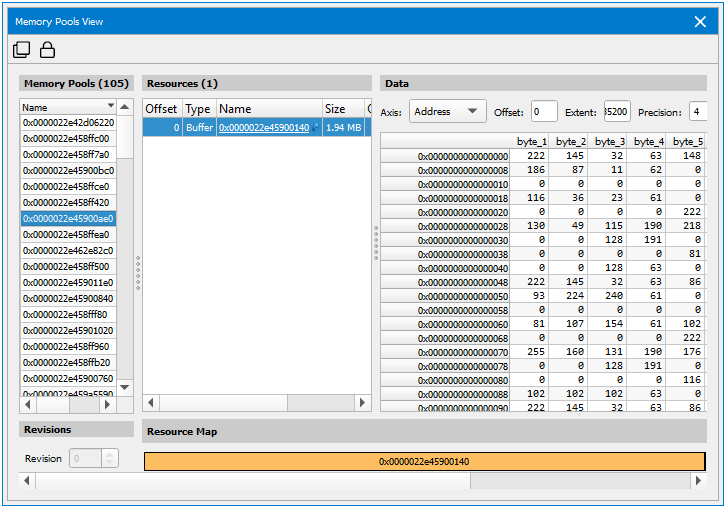
Vulkan Memory Pools#
The Memory Pools view provides a list of all device memory allocated by the application, along with detailed information about the resources contained in each memory region.
To access this view, go to Frame Debugger > Memory Pools.
The left-most pane contains information about all device memory objects currently allocated. Once a device memory object is selected, the contained resources are listed in the middle pane, along with the resource layout map in the bottom left, and contained data on the right.
Vulkan Texture and Sampler Pools#
The Texture and Sampler Pools View provides a visualization of these different pool types. This can be useful for determining if a particular set of resources are in the resource pools they are expected to be in. The left-hand side allows you to select the pool you’re interested in, based on type. Included in the list are appropriate parameters about how the pool was created. On the right side is a list of the resource descriptors, some information about the resource itself, and a thumbnail preview. There is a link below the thumbnail that allows you to open that resource in the Resource Viewer for deeper inspection.
To access this view, go to Frame Debugger > Texture and Sampler Pools.