Shader Debugger UI Reference#
Note
Shader debugging is currently only supported for the Vulkan API.
Viewing Shader Source#
The Shader Debugger opens the shader source file(s) when you select the blue link from the Shaders View.
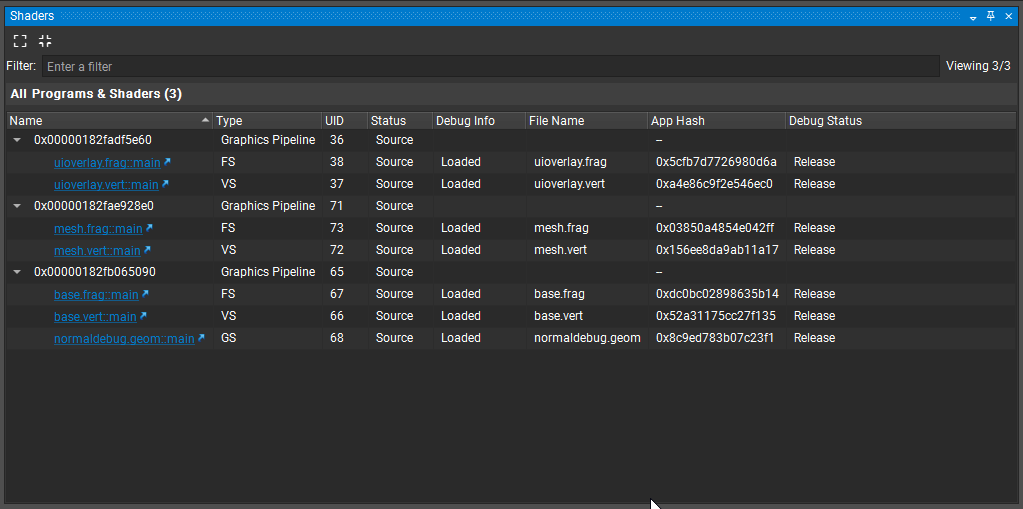
For the Shader Debugger to have access to your shaders, you need to compile them using the -g flag which ensures the original source code is included in the SPIR-V file. Some applications use include files in their shaders to aid in maintainability and code reuse. The Shader Debugger supports this by allowing the user to specify which file they want to display when debugging the shaders.
The Source Window has a combo box at the top that contains the names of the various files in the shader. Once selected, the contents of the window will switch to that source code.
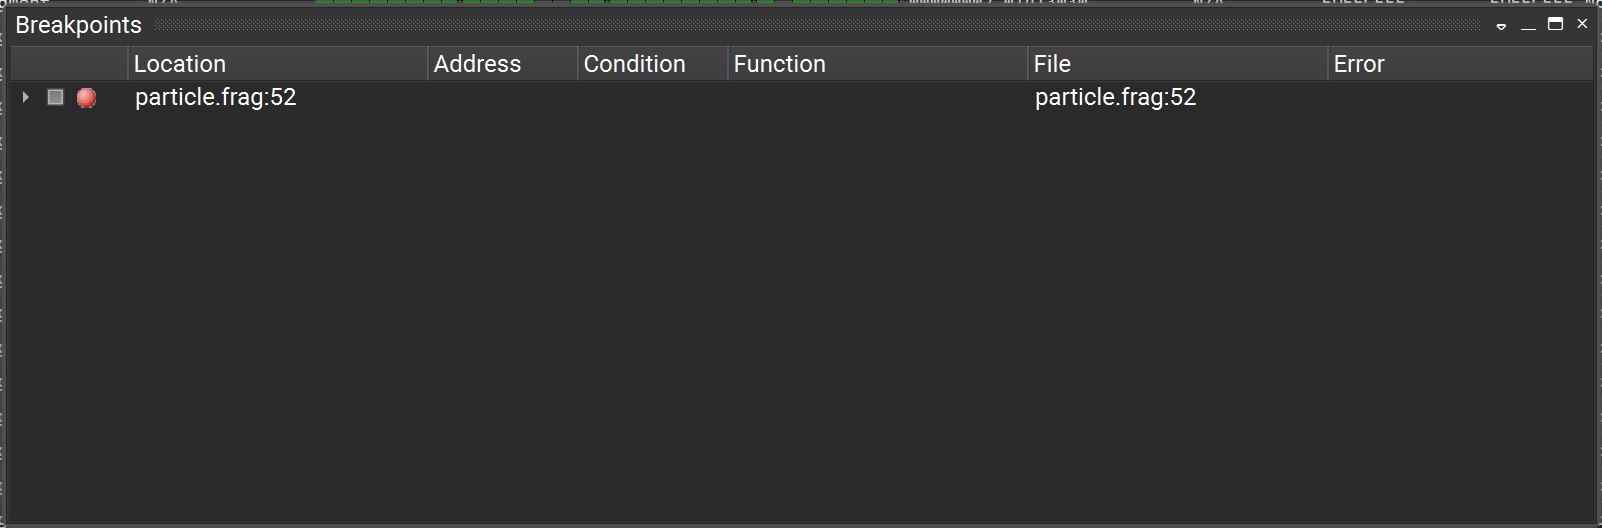
Adding Breakpoints#
You can add a breakpoint from the Shaders view and the Source Window. In the Shaders view, you can right-click on the shader of interest and select Set Breakpoint. This puts a breakpoint on the first instruction of the shader, and when it is hit the source window automatically opens.
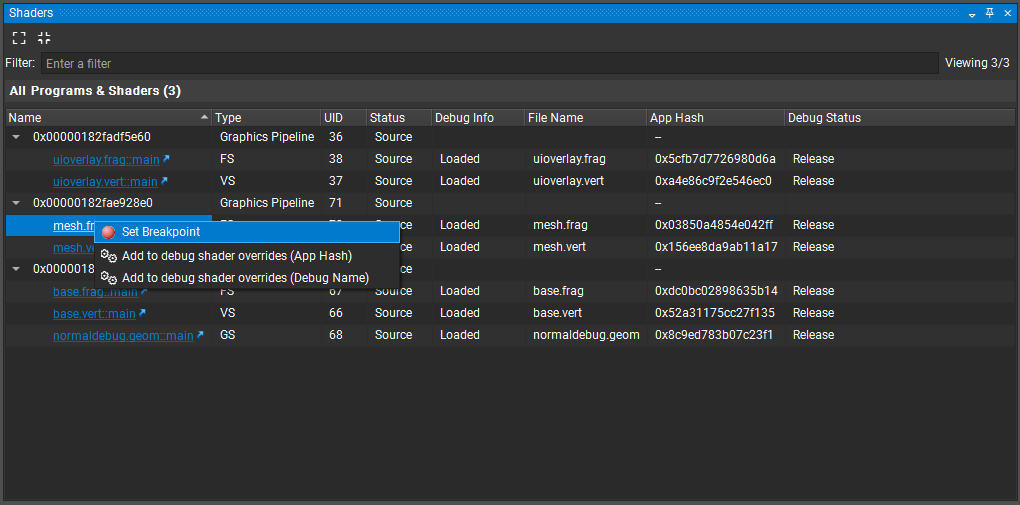
Alternatively, you can also put a breakpoint directly in the source window. Simply move the cursor to the source line you want a breakpoint on and hit F9, or click in the area just to the right of the line number to create/delete any breakpoints.
Conditional Breakpoints#
Once you create an unconditional breakpoint, you can narrow the focus on the breakpoint by adding a conditional expression. The conditions can include simple scalar expressions, similar to the Watch View, including in-scope variables, and intrinsics like pixel location from the table above. For example, to construct a conditional for all fragments that are in region from 100-150 in x and y, you would use:
@pixel.x >= 100 && @pixel.x < 151 && @pixel.y >= 100 && @pixel.y < 151
Disabling or Removing Breakpoints#
Breakpoints can be removed from either the Breakpoints Window or the Source Window.
Breakpoints Window
Hitting <Del> deletes the breakpoint in the row that is currently highlighted.
Right-clicking a row and selecting Enable toggles the current enabled state of the breakpoint, indicated by the check mark.
Right-clicking a row and selecting Delete deletes the corresponding breakpoint.
Source Window
Left-clicking a breakpoint marker or hitting F9 when the cursor is on a line with a breakpoint deletes the corresponding breakpoint.
Right-clicking a breakpoint marker opens a context menu that allows to delete or to disable the breakpoint.
Using the Focus Picker#
The Focus Picker View shows information about the GPU’s current state and the current workloads that are active when the GPU is stopped, for example, when a breakpoint was hit. This is similar to the “Threads” view of a CPU debugger. It provides a summary page that summarizes the current GPU state and how many GPU workloads for each of the shader types are currently in flight.
The possible values for GPU Status are:
Running — The GPU is running, actively executing graphics workloads.
Paused — The GPU is paused and the per-shader type summary pages are active and show the current in-flight GPU workloads.
Stalled — The GPU is paused, the last focus warp might have exited during stepping or it could be waiting on a barrier due to other warps in the same group being frozen (see Stepping Modes).
Hit Pause to move back to Paused mode and to select a new focus thread to inspect or step another warp.
Or, hit Resume to resume the GPU to hit another breakpoint.
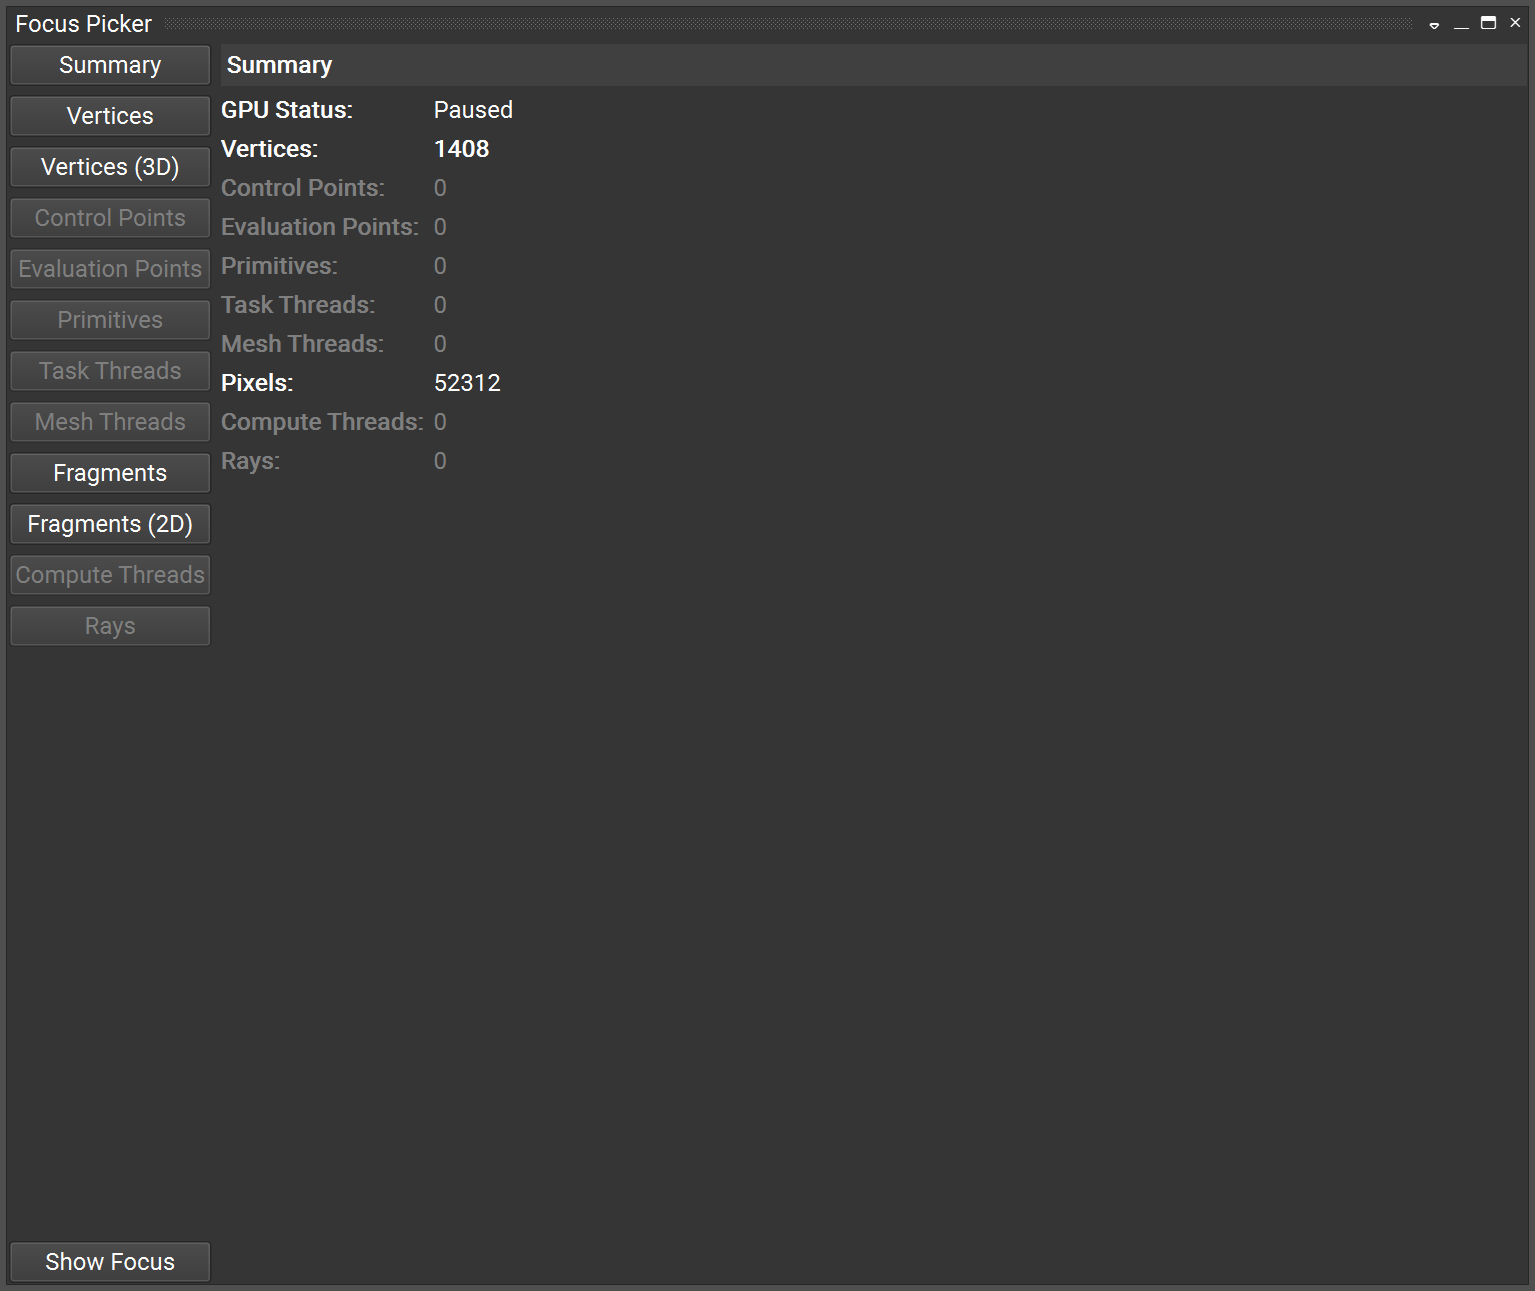
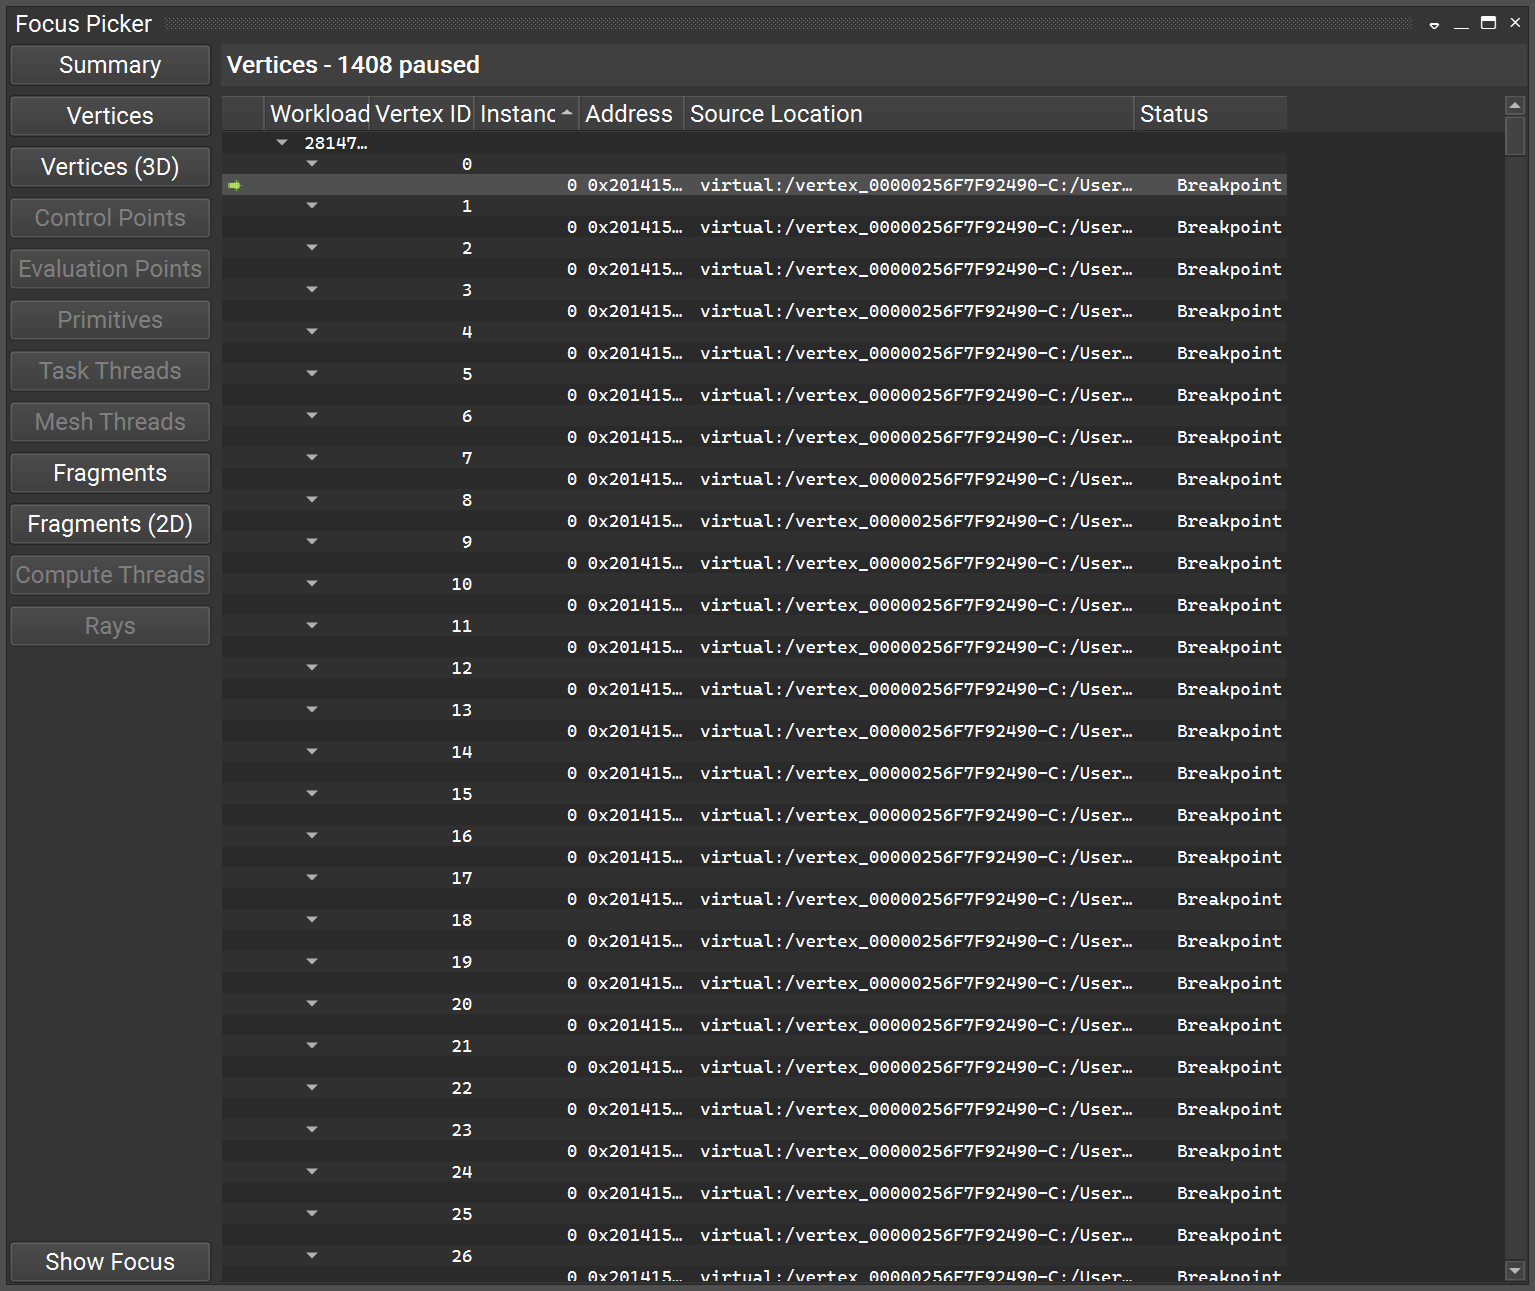
Each of the per-shader type focus picker pages shows the list of in-flight workloads for that particular pipeline stage.
Most importantly, the Focus Picker View allows you to change the currently focused workload — i.e., the ray, vertex, patch, primitive, fragment, or compute thread for which data is shown in other views — like Registers, Locals, Watch, etc. Furthermore, the current focus choice determines which workload shader source is stepped. The current focus workload is indicated with a yellow arrow marking the corresponding row in one of the per-shader tables. It can be changed by double-clicking any other table row. Clicking the Show Focus button on any of the focus picker pages opens the page and scrolls to the row that has the current focus.
In addition to the table views available for all shader stages the Focus Picker View provides two graphical views for the vertex shader stage Vertices (3D) and the fragment shader stage Fragments (2D).
The Vertices (3D) page shows point cloud representations of the (pre-transform) vertex data for the draw calls currently active in the vertex shader stage.
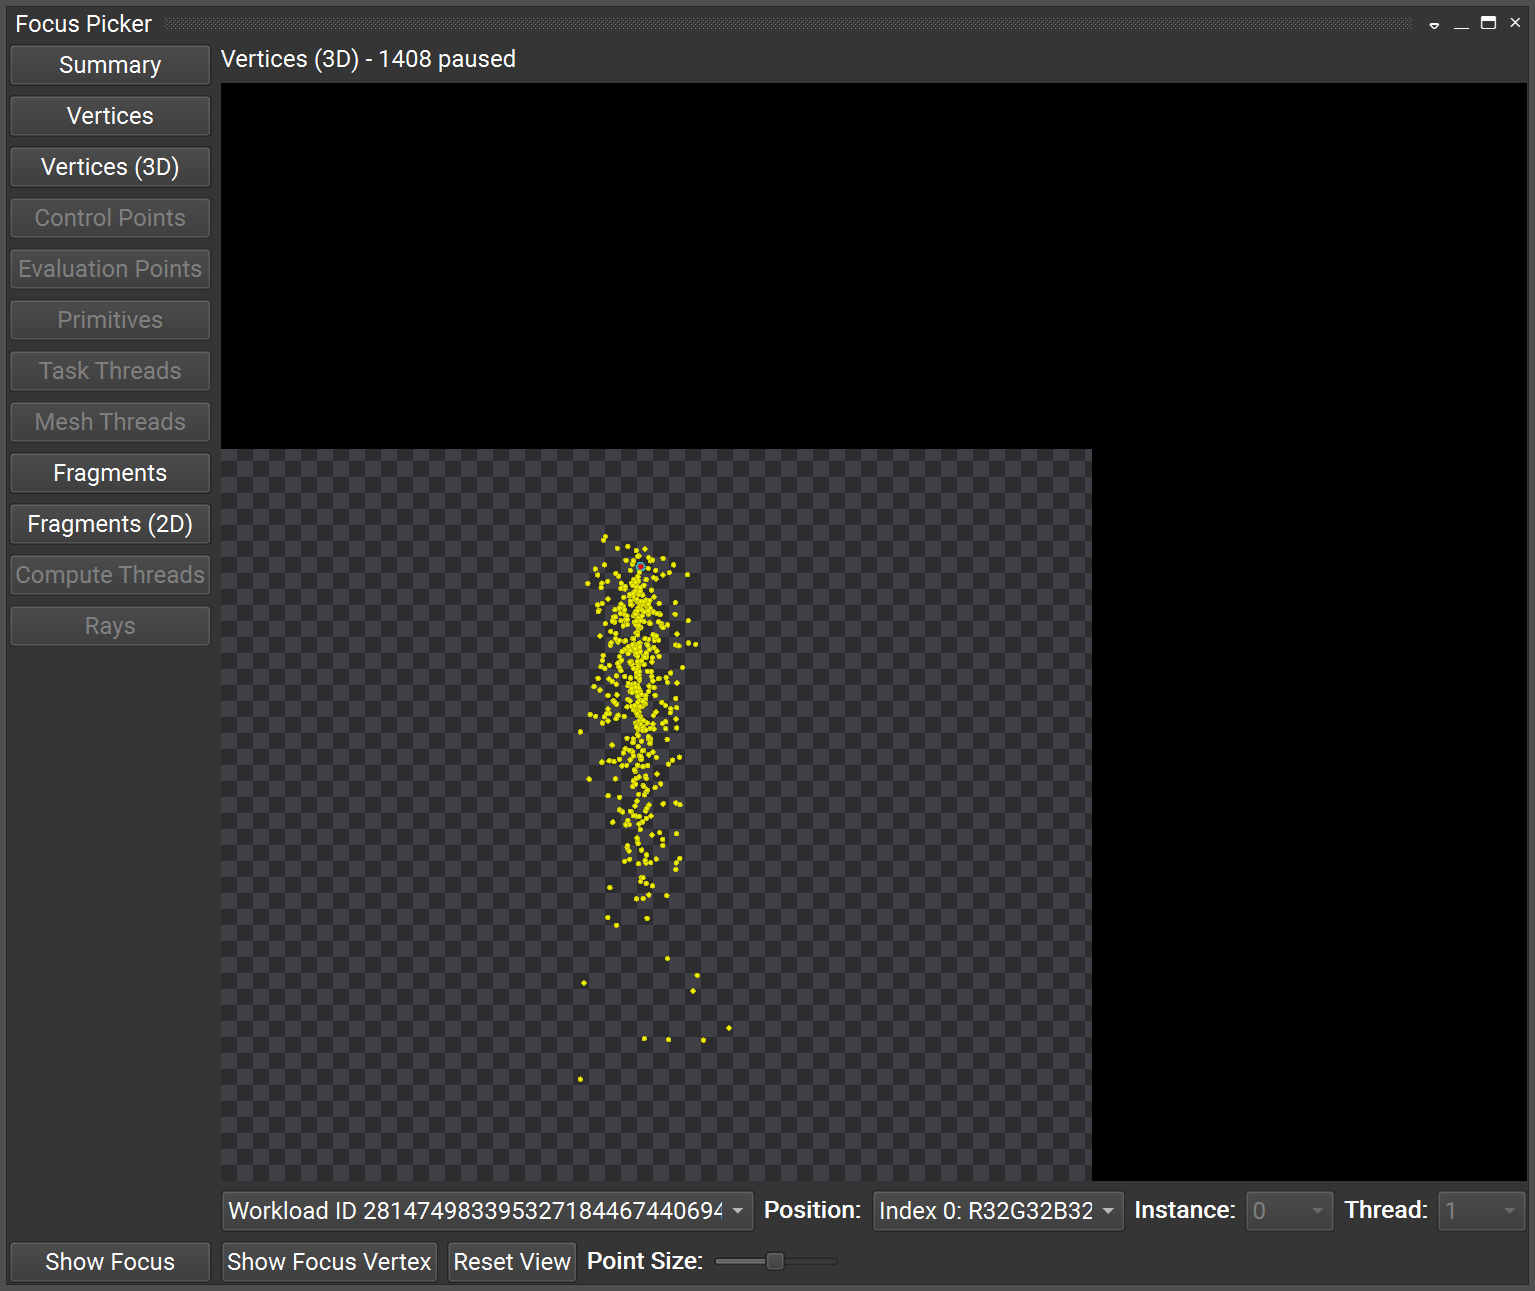
The currently active vertex shader workload is highlighted through colored points:
A red point with a blue halo corresponds to a vertex shader thread that has the current debug focus.
Yellow points correspond to vertex shader threads stopped at a breakpoint.
Blue points correspond to any other active vertex shader thread in flight.
The 3D view can be manipulated using mouse and keyboard:
Holding the left mouse button while moving the mouse pointer rotates the object.
Holding the right mouse button while moving the mouse pointer moves/translates the object.
Holding the middle mouse button while moving the mouse pointer or using the mouse wheel zooms the view.
Holding the Ctrl-key down during any of the above operations enables a slow interaction mode for enhanced control. Similar to the Vertices table view, the Vertices (3D) view also allows changing the focus thread by clicking on any of the highlighted points. Since the view supports only showing one 3D object at a time, there are combo boxes that allow you to select which draw call’s data to show (if multiple draw calls are in flight), and which of the vertex attributes to use for the 3D positions of the points. The Fragments (2D) page shows an image of the current state of the destination render targets for the fragment shader workloads currently in flight. Note: this is not the final render target image as in the Frame Debugger, but actual frame buffer content.
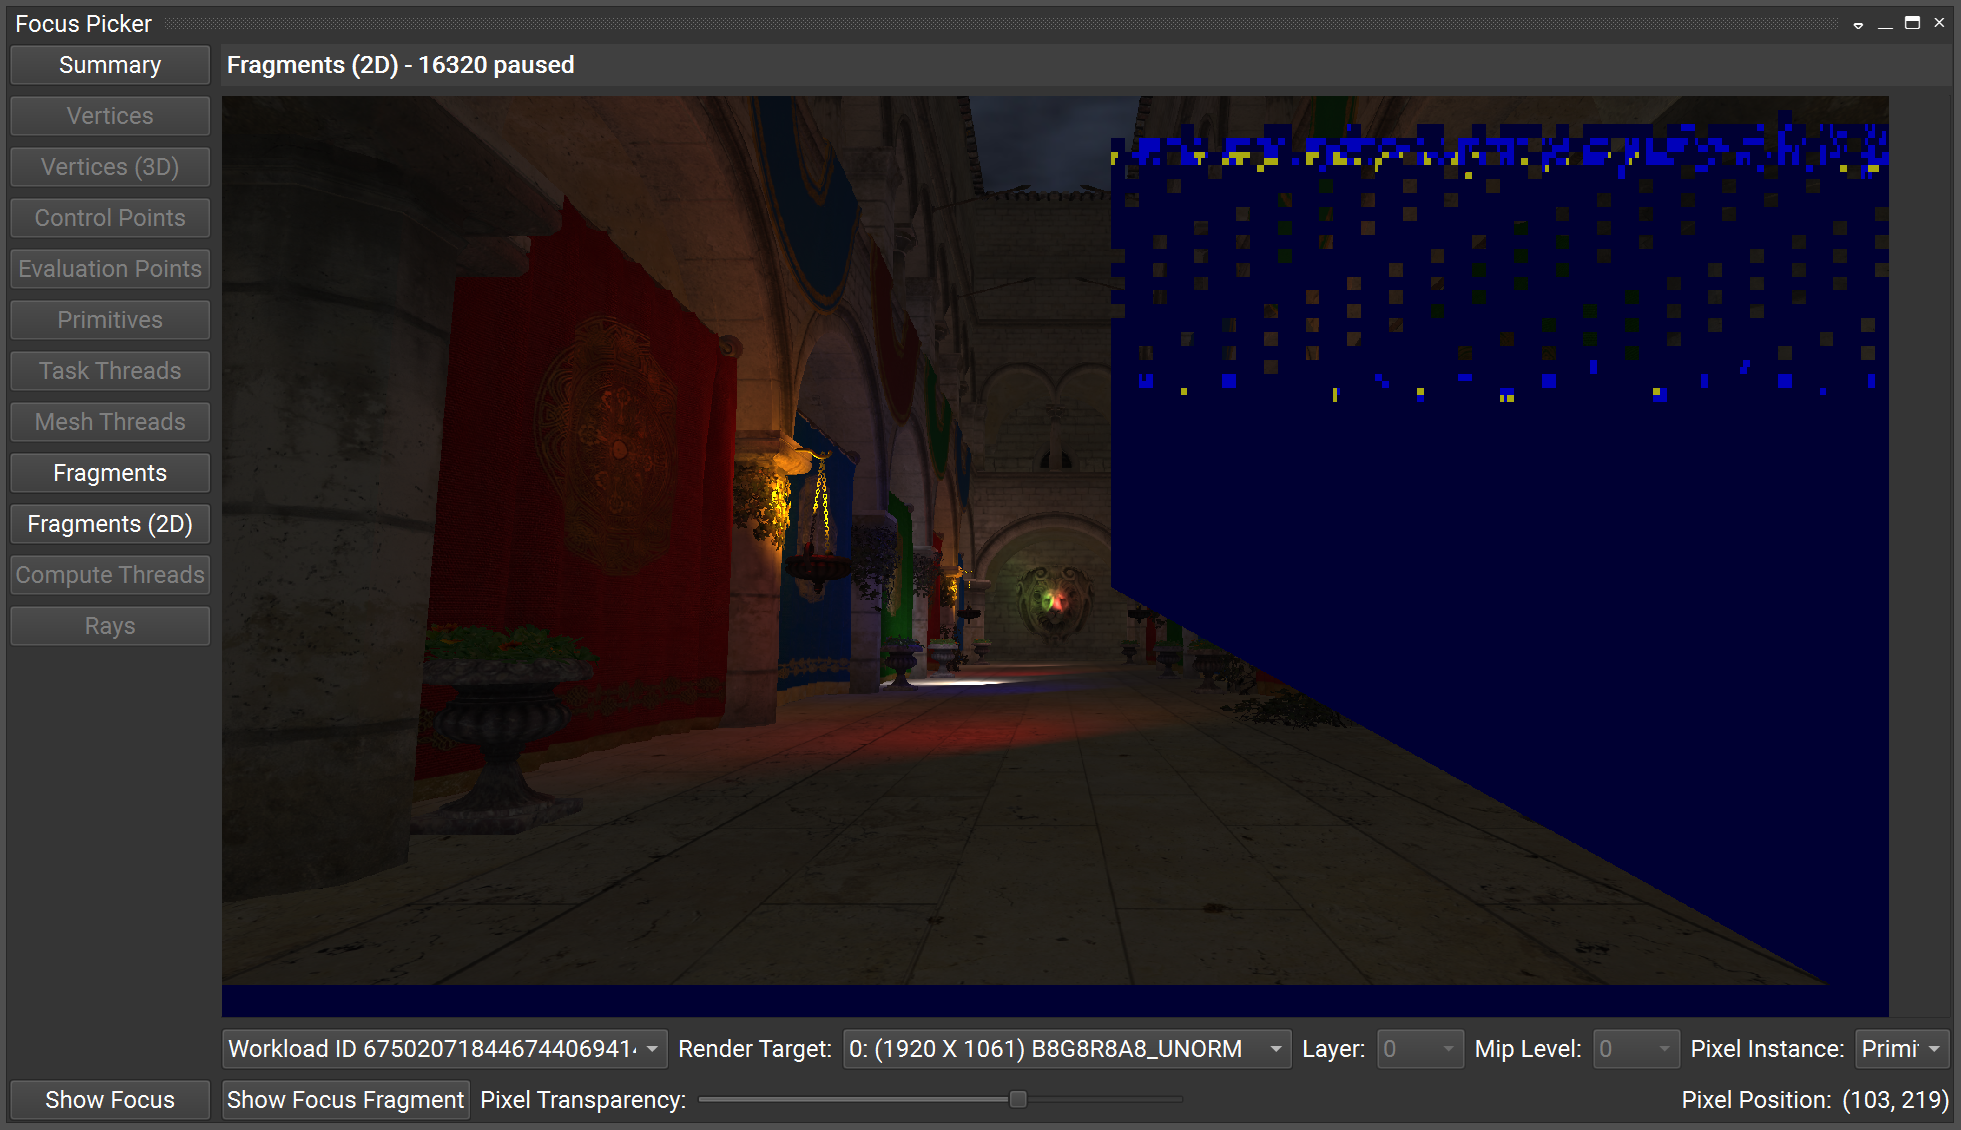
The currently active fragments are shown as a color overlay:
A red pixel corresponds to the fragment shader thread that has the current debug focus.
Yellow pixels correspond to fragment shader threads stopped at a breakpoint.
Blue pixels correspond to any other active fragment shader thread in flight.
It is possible to zoom in and out using the mouse wheel or to change the opacity of the overlay to better see the render target image in the background. Similar to the Fragments table view, the Fragments (2D) view also allows changing the focus thread by clicking on any of the highlighted pixels. You can select which render target to view using the combo boxes below the image view.
Using the Warp Info View#
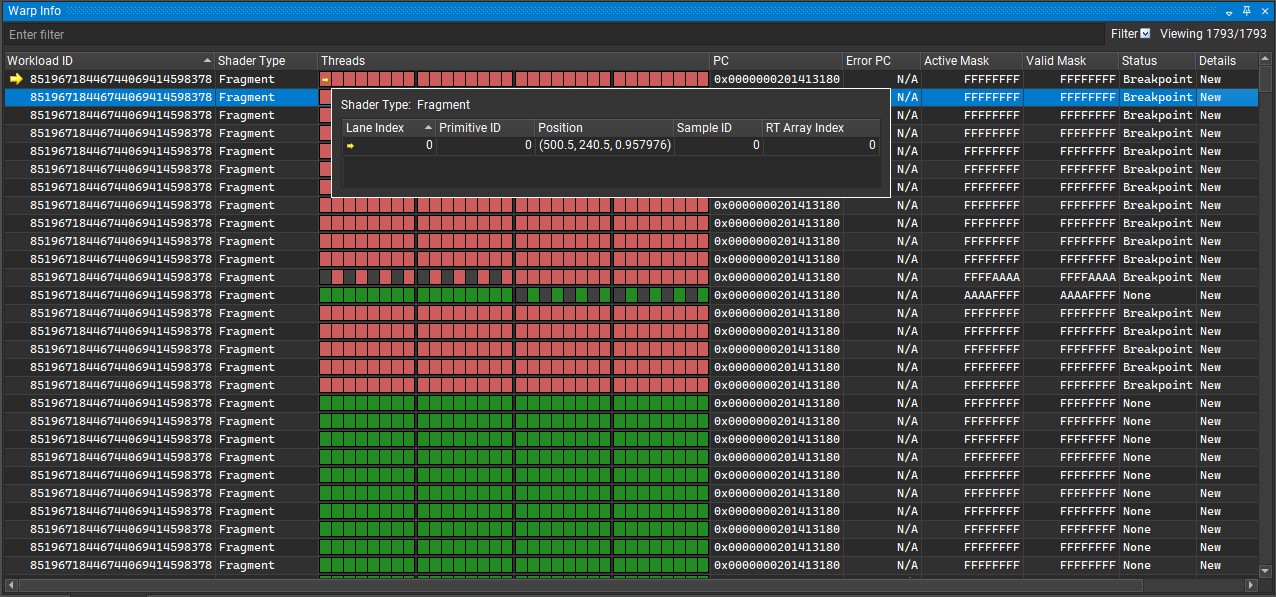
The Warp Info view provides the ability to see an “SM-centric” view of the warps and threads in flight. Each row represents a single warp running on an SM, and the colored boxes in the middle are the threads within the warp. A red box indicates a thread has hit the breakpoint. A dark red box indicates a thread that has hit an exception. Green boxes indicate other active threads. Light green boxes indicate threads waiting at a barrier. Light gray boxes indicate threads that are inactive due to control-flow divergence. And last, dark gray boxes indicate threads that are unused or have terminated. The other columns show data about the status of the warp, etc. Hovering the mouse pointer over a row shows a tooltip window with additional detail about the warp. Similarly, when hovering the mouse over a thread box a tooltip window shows details about this specific thread.
The Warp Info View also allows changing the current debug focus. Double-clicking a row changes the debug focus to that warp. Double-clicking a thread box changes the debug focus to that particular thread.
Stepping, Breaking, and Resuming Execution#
In addition to breakpoints, the Shader Debugger allows stepping through the shader code and other means of controlling shader execution, such as resuming all active GPU warps or breaking into the execution. The supported commands are:
Pause
Resume (F5)
Step In (F11)
Step Over (F10)
Step Out (Shift-F11)
Due to hardware organization, stepping is always on a warp level. That means instead of individual GPU threads or workloads, a group of threads (up to 32) is always stepped.
The Shader Debugger UI does not support explicit per-thread or per-warp control over which warps are frozen during a step operation. Instead the debugger supports a number of stepping modes that control how non-focused warps behave during stepping. The supported modes are:
Mode |
Resume |
Step In, Step Out, Step Over |
|---|---|---|
Resume All |
Nothing is frozen |
Nothing is frozen |
Resume Group (Same as Resume Warp, if not a compute shader) |
All warps outside of the current (compute) group are frozen |
All warps outside of the current (compute) group are frozen |
Resume Warp |
All warps except the current are frozen |
All warps except the current are frozen |
Step Group (Same as Step Warp, if not a compute shader) |
Nothing is frozen |
All warps outside of the current (compute) group are frozen |
Step Warp (default) |
Nothing is frozen |
All warps except the current are frozen |
The currently active mode can be selected in the Scheduling drop-down in the shader debugging toolbar.
Using the Locals and Watch Window#
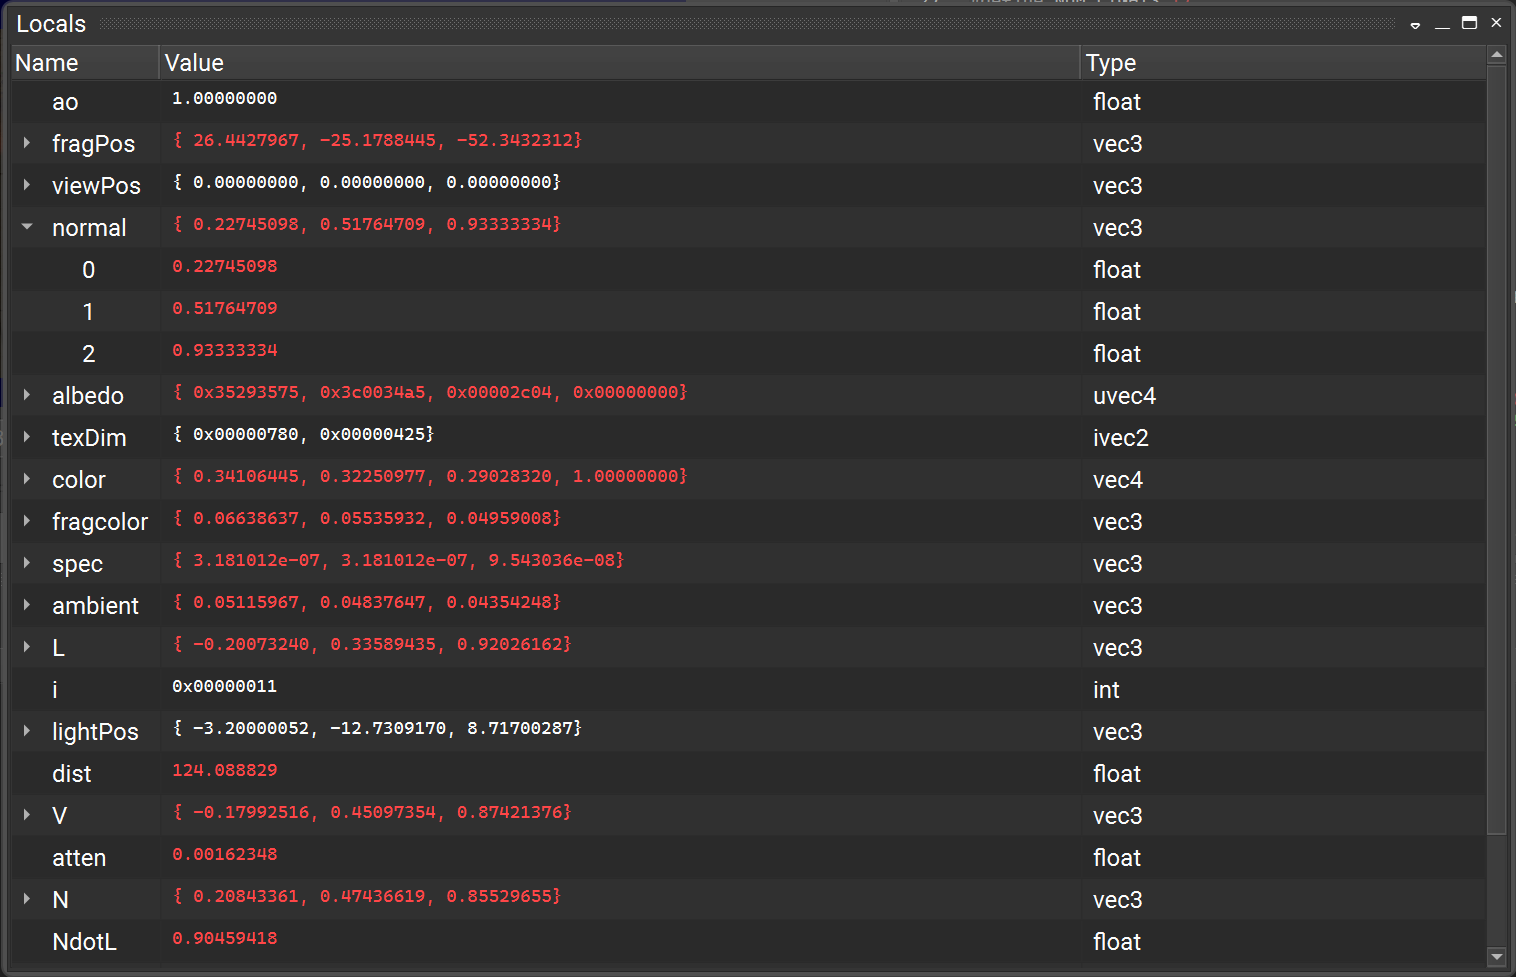
The Locals window lists the local variables defined in the current scope and their current values.
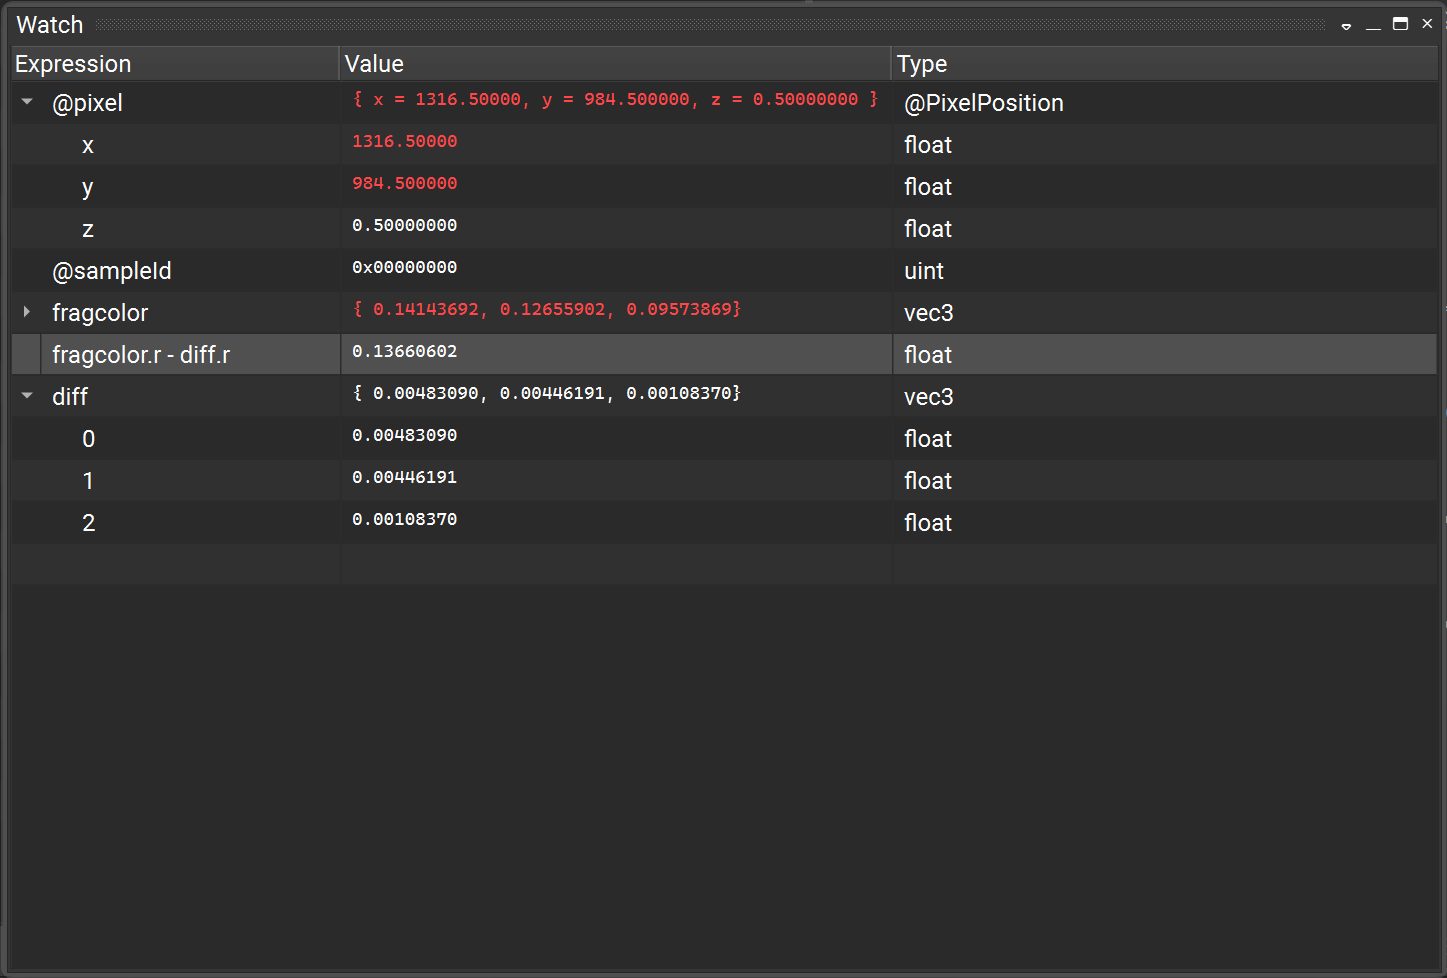
The Watch window allows evaluation of shader variables defined in the current scope and its parent scopes. That means, in addition to local variables, it is also possible to inspect global variables, like uniforms and varyings. Furthermore, it is possible to use expressions that use scalar operators, like arithmetic operators, type casts, or struct component and array element access operators. In addition to local and global variables defined in the debugged shader, a number of intrinsic variables can be used in the Watch window or in breakpoint conditions. The intrinsic variables supported differ by shader type:
Shader Type |
Supported Intrinsic Variables |
|---|---|
Vertex |
@vertexId, @instanceId |
Tessellation Control |
@controlPointId, @primitiveId |
Tessellation Evaluation |
@domainLocation, @primitiveId |
Geometry |
@instanceId, @primitiveId |
Fragment |
@pixel, @sampleId, @primitiveId, @rtArrayId |
Compute |
@groupThreadId, @groupId |
Exiting Debug Mode#
To exit shader debugging, remove any breakpoints you have set and resume the GPU. Then you can terminate your application as you normally would, or use the Terminate button on the toolbar.