Shader Debugger Overview#
Nsight Graphics provides a fully hardware accelerated Shader Debugger for debugging your shaders as they execute on the GPU. This can be used on Ampere and later hardware, and runs on your live application, not during a capture/replay scenario like in the Frame Debugger activity. The Shader Debugger functions similarly to how CPU source debuggers do, including the ability to put breakpoints in your source with optional conditionals based on variables, step in/over/out from the current PC, view shader program state via Locals and Watch windows, and select the warp/thread to debug via the Warp Info and Focus Picker windows.
Note
Shader debugging is currently only supported for the Vulkan API.
When to use the Shader Debugger Activity#
You use the Shader Debugger activity whenever you need to better understand how your shader code is executing on the GPU.
You have written a new section of code and want to step through it in order to ensure your algorithm functions as you expect it to.
You see a rendering anomaly and want to better understand what may have caused it.
Basic Workflow#
To start this activity, select Shader Debugger from the Connection dialog.
The basic workflow for the Shader Debugger activity is to launch your application and then use the Shaders View to select the pipeline and shader you are interested in debugging. Once you have that selected, you can put breakpoints in the shader and step through the code, inspect variable values, etc.
Note
Shaders must be generated with debug information in order to debug at a source level. Please refer to the Shader Debugger Setup section for additional setup details.
Configuring The Shader Debugger Activity#
The Shader debugger enforces certain system configuration requirements, and will require the user to configure the system if those requirements are not met. Refer to Shader Debugger Setup to find out more about system requirements.
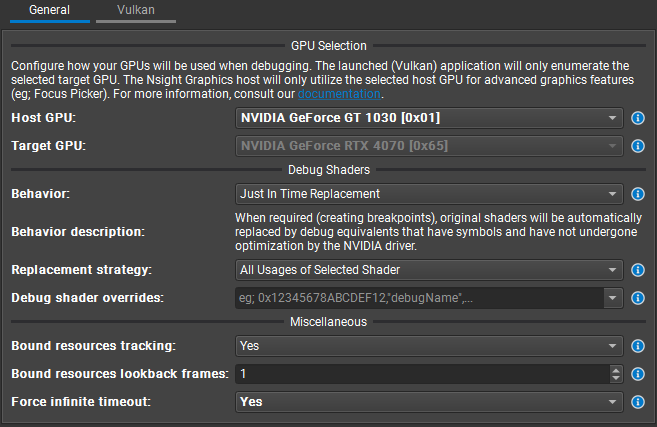
GPU Selection#
The Shader Debugger activity allows the user to select the GPU that the application should run on. The launched application will only be able to create a graphics API device context on the selected GPU.
Note
When local system debugging, The selected target GPU must not be the same GPU that is running the Nsight Graphics host.
Debug Shaders#
The debug compilation of shaders heavily impacts both overall shader compilation time and the applications runtime performance. The Shader Debugger allows the user to control the strategy of when the NVIDIA driver will compile shaders as debug (full symbol information, no optimizations).
The supported modes are:
- Just-In-Time Replacement
Shaders will only be compiled as debug when the user creates a breakpoint in a shaders source. When creating a breakpoint, a new shader/pipeline will be created that will replace the usage of the existing shader/pipeline.
- Just-In-Time Replacement + Source Recompilation
Same as Just-In-Time Replacement, but the shader’s source will first be recompiled for use by the replacement shader/pipeline.
- Always
All shaders will be compiled as debug by the NVIDIA driver at load time. This mode has the highest impact on load times and runtime performance. This mode is practical for debugging shaders that trigger exceptions on first use, or for users who wish to be able to readily inspect warp state for any user shaders that are currently executing, not just ones stopped at a breakpoint. This mode should be used with caution.
When either Just-In-Time Replacement or Just-In-Time Replacement + Source Recompilation is selected, the user may also select a Replacement Strategy. The Replacement Strategy determines the scope of pipeline/shader replacement that will occur when a breakpoint is created.
The supported strategies are:
- Selected Shader Only
Only the specific shader/pipeline will be replaced with a debug equivalent, even if the shader was used by multiple pipelines.
- All Usages of Selected Shader
All shaders/pipelines that utilize the selected shader will be replaced with a debug equivalent. A shader is equivalent if it shares the same UID.
- All Shaders
All shaders will be replaced with a debug equivalent once a breakpoint is created. This is functionally similar to the Always mode, but will not impact the initial applications runtime performance.
Note
By detaching the host or removing all breakpoints, all shader replacements will be reverted to their original shaders.
Debug Shader Overrides will allow the user to control when a specific shader should be compiled as debug at load time. This field will accept a comma delimited list of either the shaders App Hash or debug name. This activity setting can be managed by right clicking shaders in the Shaders View to add or remove entries.