GPU Trace UI Reference#
GPU Trace profiles live applications. Once a trace is complete, the data is saved in a trace file and can be analyzed offline on any computer where NVIDIA Nsight Graphics is installed, without the need to have the specific GPU installed or the profiled application running.
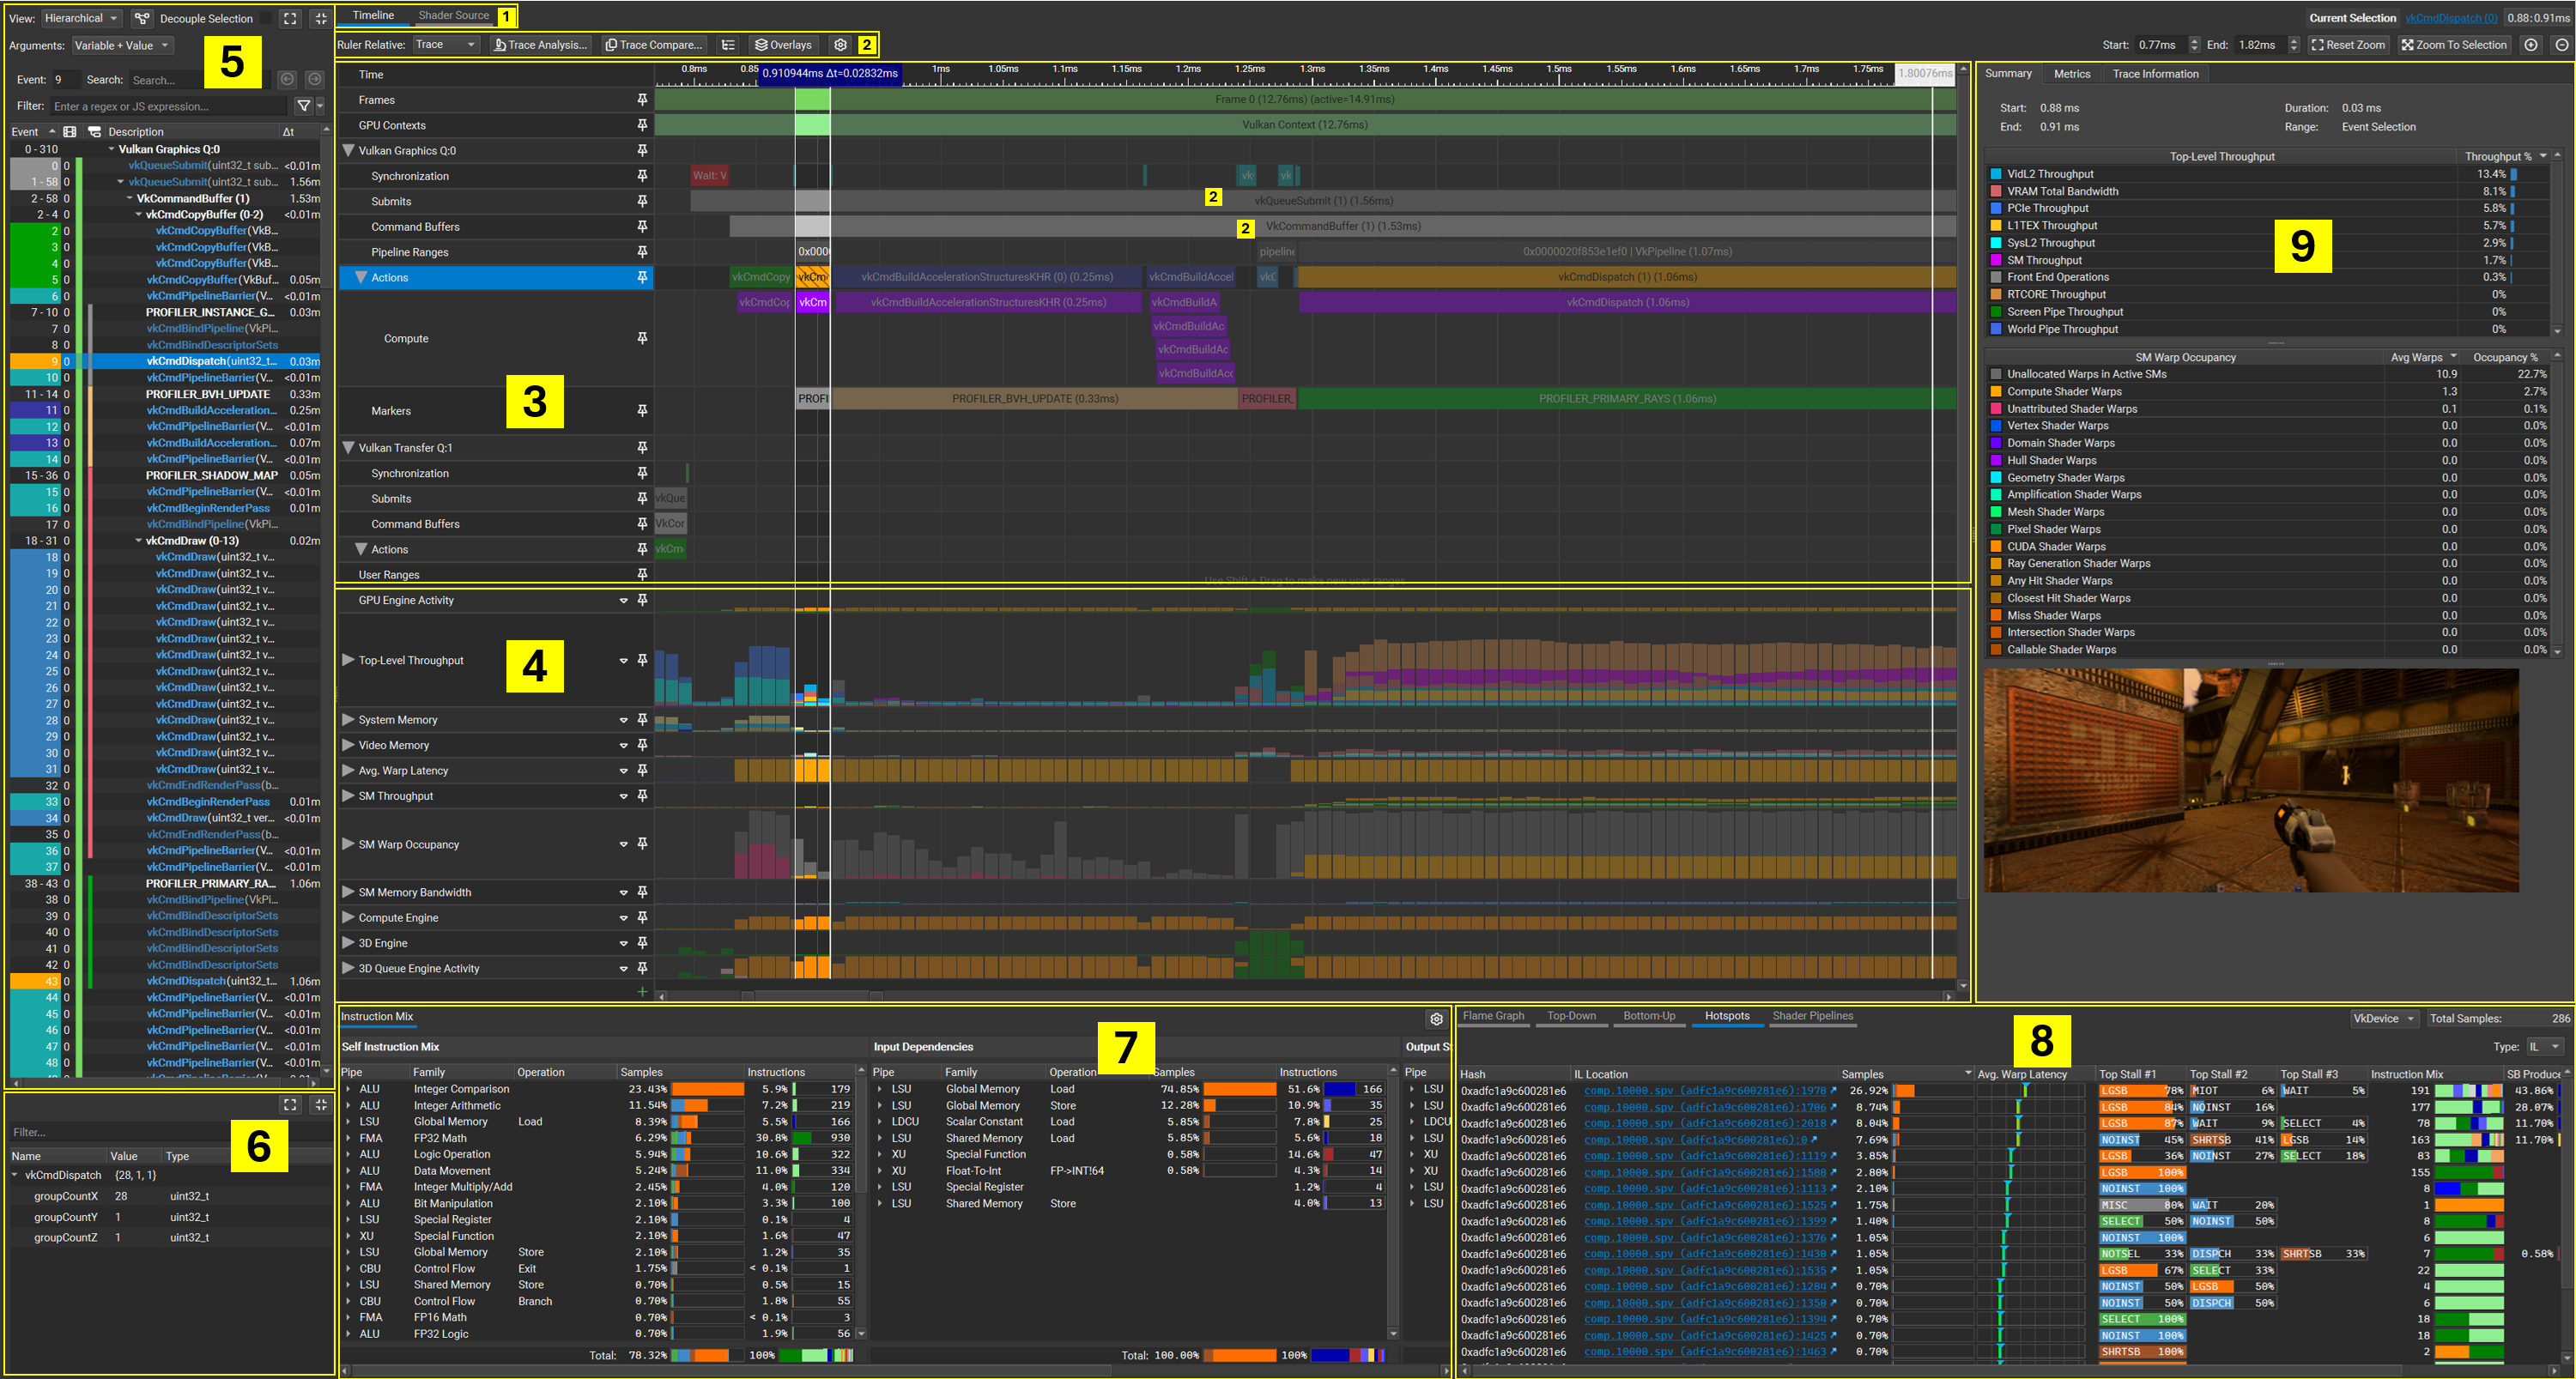
The GPU Trace window is comprised of up to 8 main sections:
Tabs to switch between the timeline view and the shader source view.
Timeline Control Scheme#
The GPU Trace timeline view provides a variety of controls to select and interact with presented data.
Binding |
Command |
|---|---|
|
Select Event |
|
Select Event and Zoom |
|
Multi-Select Event |
|
New Timespan Selection |
|
Add Timespan Selection |
|
Erase Timespan Selection |
|
Zoom to Selection |
|
Horizontal Panning |
|
Horizontal Panning |
|
Vertical Scroll |
|
Zoom In/Out |
|
Event Row Header Context Menu |
|
Event Context Menu |
|
Metric Row Header Context Menu |
|
Move Row |
Trace Toolbar#
At the top left of the timeline view, there are 6 buttons that extend the timeline’s capabilities:

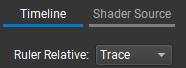
Ruler Relative: Controls the zero point of the ruler. This can be:
Trace: Zero is when the trace begins.
Viewport: In this mode, if you select a range and expand it, the beginning of the selected range is the zero point of the ruler.
Cursor: Zero is where the mouse is.
Trace Analysis: See Trace Analysis.
Trace Compare: See Trace Compare.
- Queue Rows Hierarchy Toggle: In modern graphics APIs: actions, commands, and markers can be executed on different queues.
GPU Trace traces these events according to the queue they were executed on, and shows it by default according to this hierarchy. For better granularity, it is possible to toggle this view from hierarchy to flat mode. The flat mode can be used to pin, remove, and rearrange individual queue subrows.
Overlays: Toggle different overlays, see Barrier Overlay and Subchannel Switch Overlay.
Miscellaneous Options:
Aggregate Frames: This option is supported only when the report contains multiple frames, and turning it on activates aggregate mode. In this mode:
The timeline shows only the first frame.
The metric values shown in the GPU Trace (metrics tab and timeline tooltip) are values averaged across all the frames (hovering over the values shows a tooltip displaying the original values used to compute the average).
Values that have significant variation between the frames are shown in gray. The threshold for determining this is available in the settings.
This mode is useful when analyzing a report with multiple frames, to see averaged data and minimize the effect of frame variation.
At the top right of the timeline view, there are buttons controlling the zoom level. These buttons may assist in navigating the timeline to the desired view.

Start / End: Marks down the exact time for your start and end selection.
Reset Zoom: resets the timeline zoom for the entire trace.
Zoom to Selection: zooms to the selected range. Not available when the selection consists of multiple disjoint timespans.
Timeline: Frames Data and Per-Queue Events#
Frames Row#
GPU Trace allows you to collect up to 15 consecutive frames in a single trace. The Frames row shows the frame execution boundary. Double-clicking on a frame automatically zooms in the timeline to the frame boundaries.

Context Row#
Using multiple different APIs, such as D3D12 and CUDA, or multiple graphics queues, can generate multiple distinct contexts. The GR Engine (combining Graphics and Compute) can execute only one of these contexts at a time across the entire GPU.

In the GPU Trace timeline, the Context row shows the boundaries of all context ranges, indicating which context is active over time. And in cases where contexts from other processes are detected, those ranges will include the process name, if it can be determined.
Ideally, limiting the number of contexts if possible, and, consequently, the number of context switches can improve performance, as context switches incur some overhead.
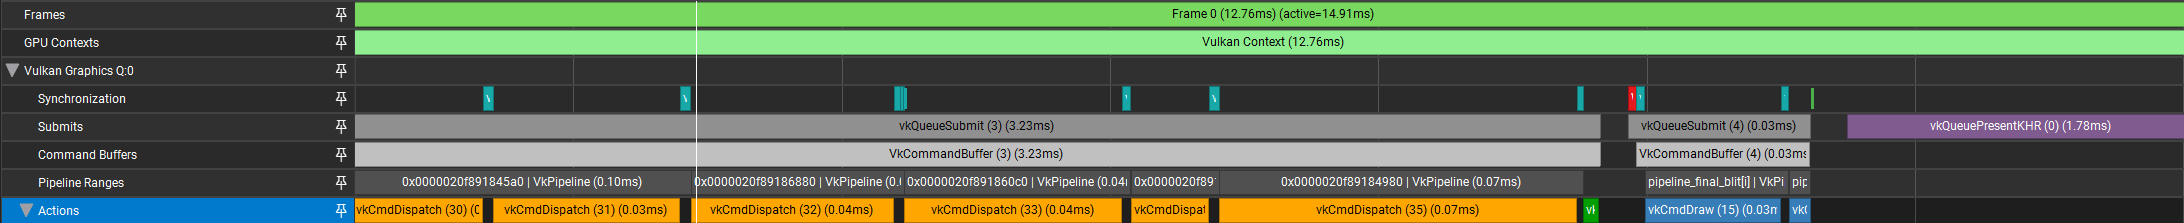
Per-Queue Events#
NVIDIA GPUs contain multiple independent engines that provide specialized functionality. These engines (e.g., graphics, compute, and copy) can execute work in parallel, and work can be submitted to them in separate queues.
In the GPU Trace timeline, you can observe actions and events that occurred throughout the frame execution, according to the queue they were submitted on. The per-queue part of the timeline presents events, user markers, and actions.
Queue Synchronization Objects#
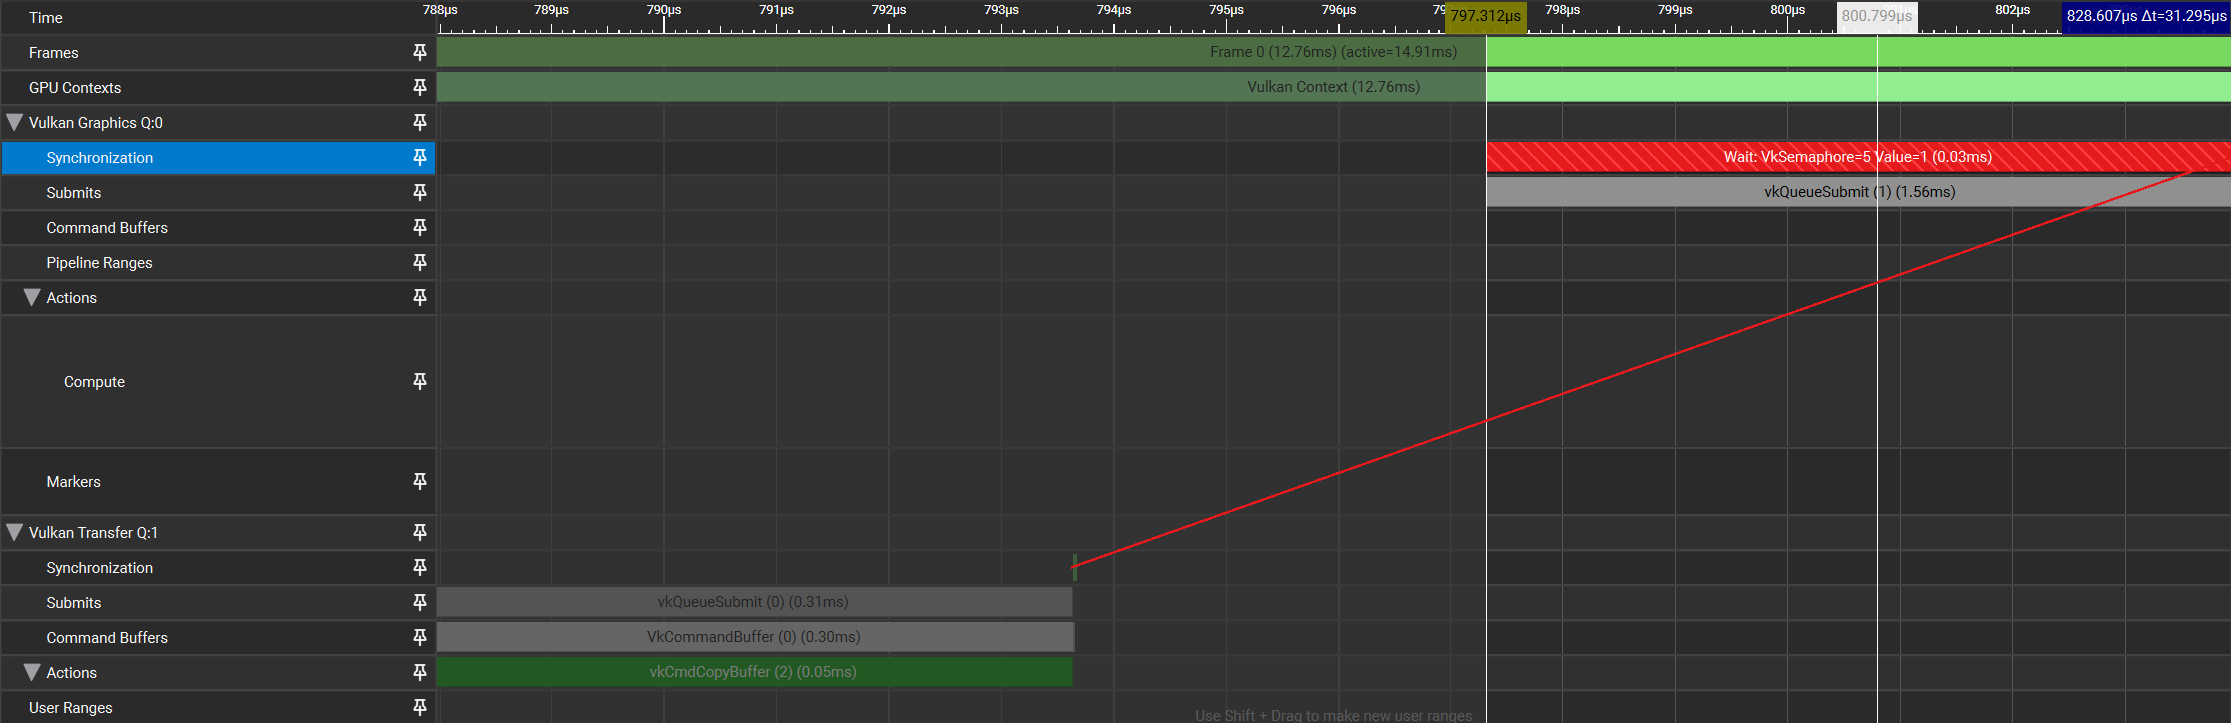
Since work can be submitted in separate queues, graphics APIs support synchronization of work between queues. GPU Trace capture unveils when Wait and Signal commands are being executed with relevance to the queue. Once such a synchronization object bar is selected, a line connecting to the relevant event is drawn. This makes it easy to understand when a wait event was triggered, when a signal event released it, and how much time a queue was in a ‘waiting’ state.
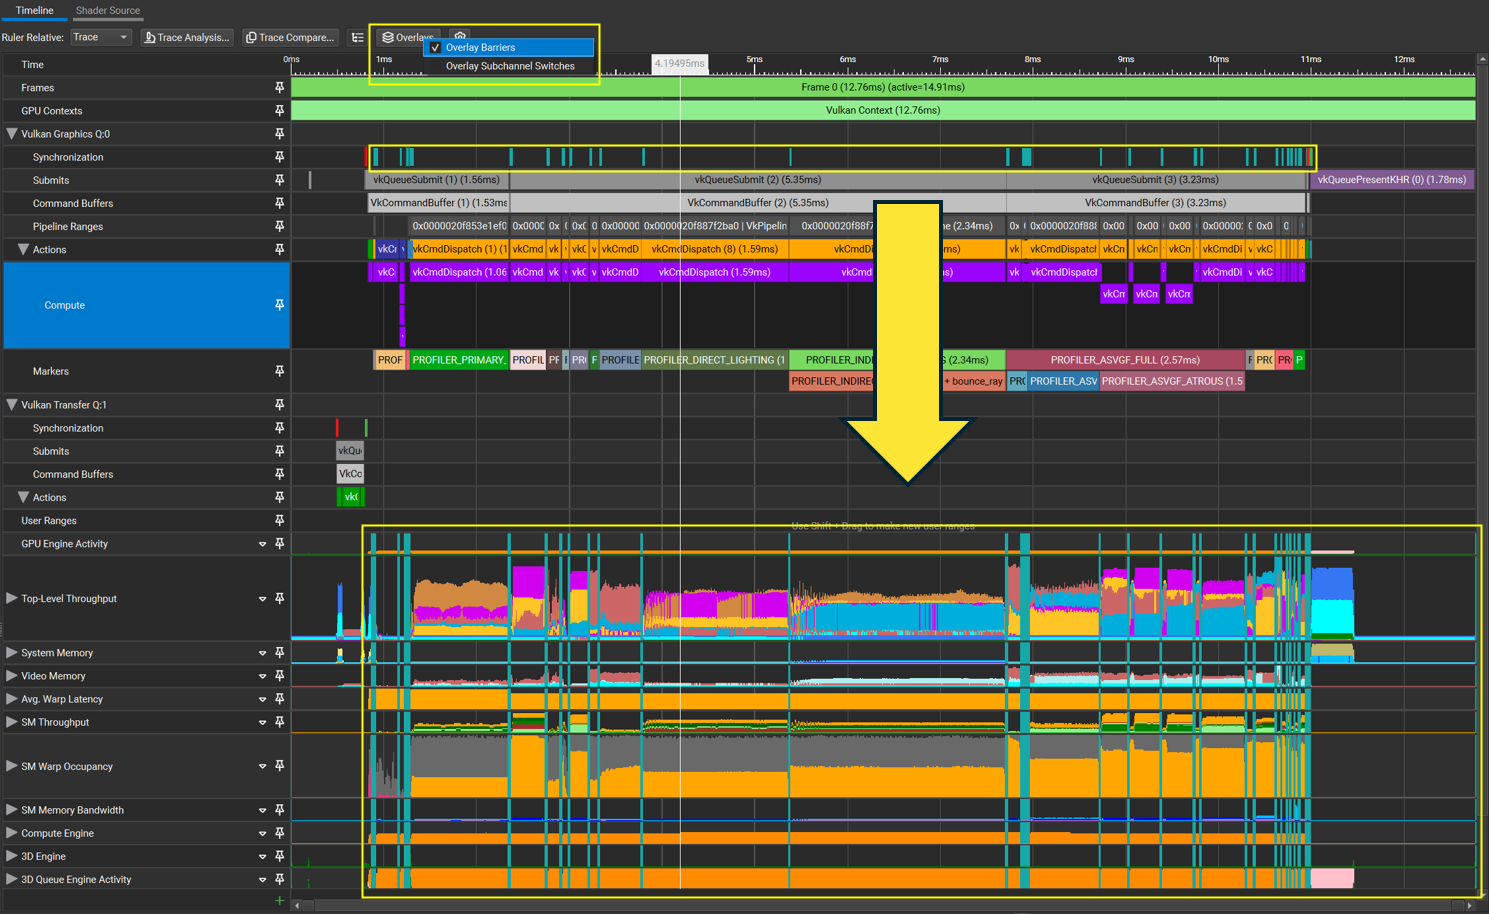
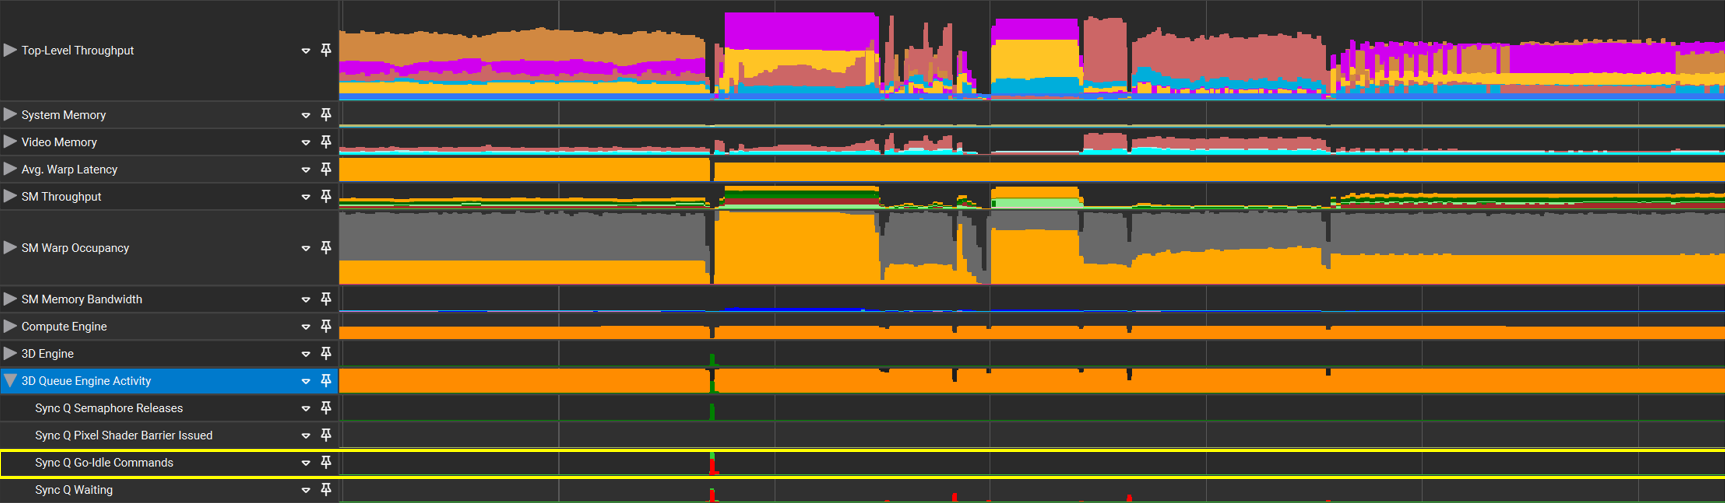
Resource Barriers#
GPU Trace can capture resource barrier calls. These calls appear as additional events in the synchronization row, relevant to the queue they were triggered on.
Use the “Overlay Barriers” toggle button under the “Overlays” menu to see how the resource barrier event impacts the metrics graph data:
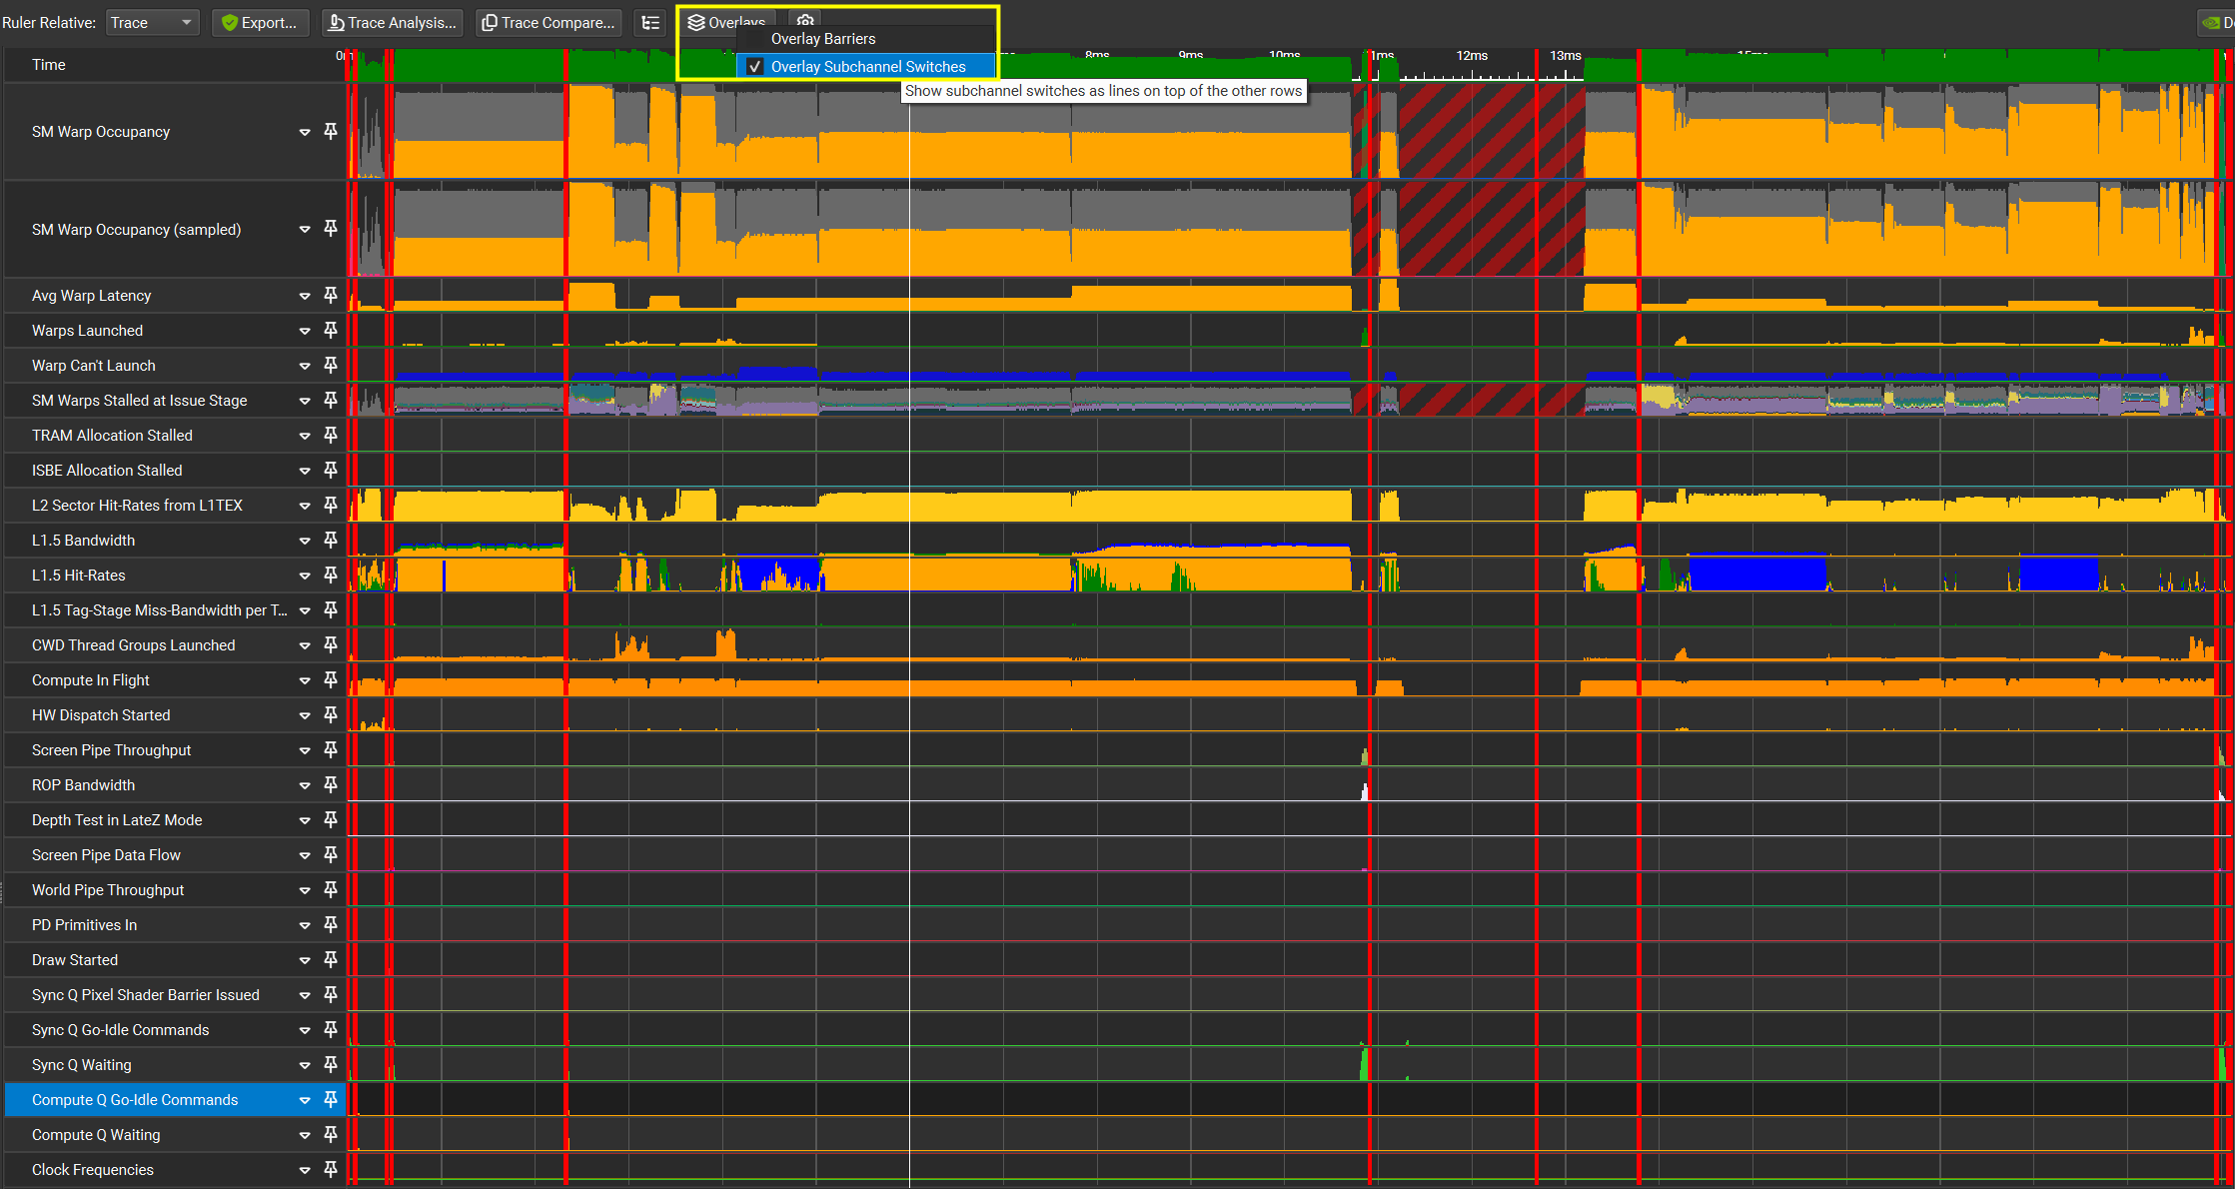
Subchannel switch overlay#
When an application submits a sequence of different work types (e.g., Draw, then Dispatch) within a single queue, the hardware may insert an implicit barrier between them. This implicit barrier is called a Subchannel Switch; it involves a pipeline flush and wait-for-idle at the Front End, preventing parallelism across the barrier. To identify where these occurred on the timeline, under the “Overlays” menu, enable the “Subchannel Switches” checkbox. This feature is available on NVIDIA Ampere and Ada Lovelace Architecture GPUs. On NVIDIA Blackwell Architecture GPUs and newer, subchannel switches do not occur between 3D and compute workloads. The overlay is therefore unavailable for those architectures.
Use the “Overlay Subchannel Switches” toggle button under the “Overlays” menu to see how subchannel switches impacts the metrics graph data:
User Markers#
GPU Trace also collects any User Markers that exist in the application, and displays them on the relevant queue it was executed on. This may help understand the frame workflow. GPU Trace supports API-specific markers as well as NVTX markers generated through the NVIDIA Tools Extension SDK.
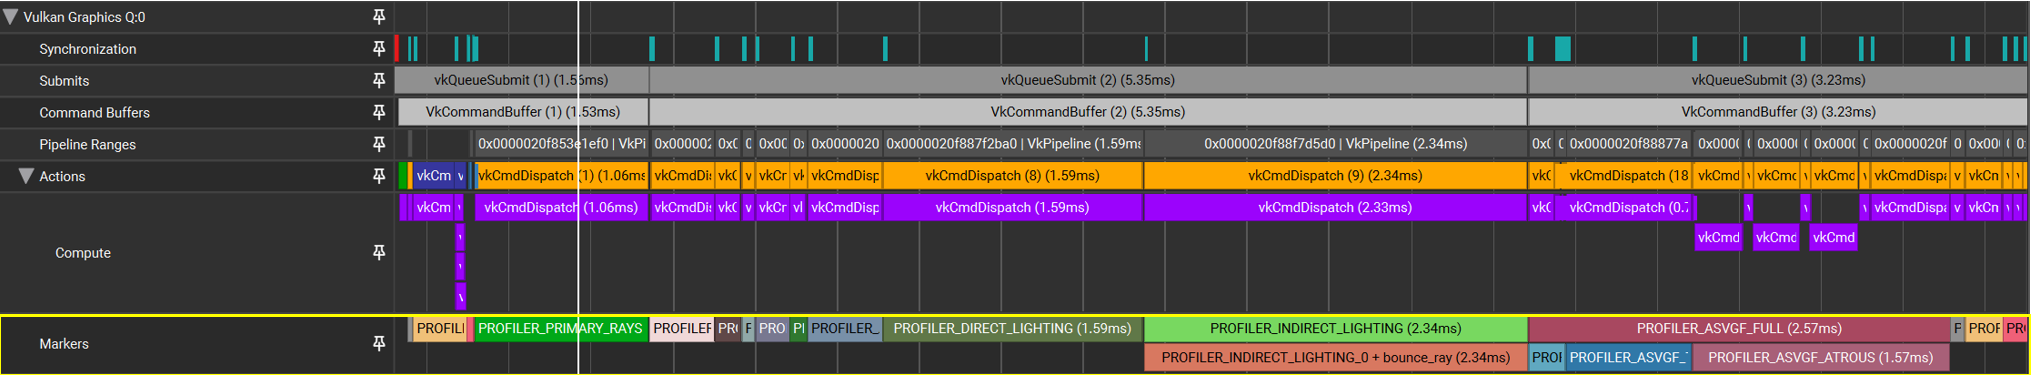
Actions Row#
The Actions row shows work submission actions, such as draws and dispatches, in correlation to the time it was executed and the queue it was executed on.
Each range in the actions row shows what the incremental time cost is for each succesive API call.
Compute Row#
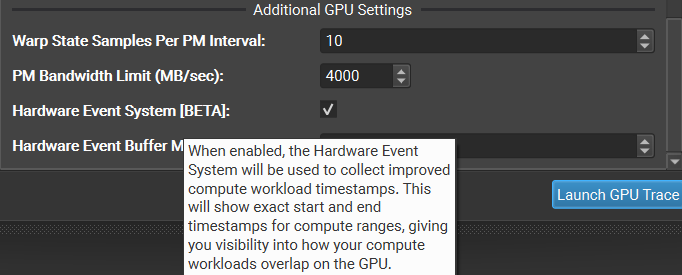
On NVIDIA Blackwell Architecture GPUs and newer, GPU Trace can collect various hardware events, including start and end timing information for compute workloads from D3D12, Vulkan, and CUDA APIs.
The Compute row uses this timing information to construct ranges that indicate when your compute workloads start and end, and which compute workloads are executing in parallel.

Enable Hardware Events:#
Check the “Hardware Event System” checkbox in the activity window settings under “Additional GPU Settings” to enable Hardware Event collection.
Timeline: Metrics Graphs#
The Metrics Data Rows can track NVIDIA GPU hardware units’ activity using performance monitors. GPU Trace enables collecting this data and observing in detail the hardware utilization during frame execution.
Note
In order to understand more what action items you can conclude from this data, the following blog is recommended:
The Peak-Performance-Percentage Analysis Method for Optimizing Any GPU Workload
https://devblogs.nvidia.com/the-peak-performance-analysis-method-for-optimizing-any-gpu-workload/
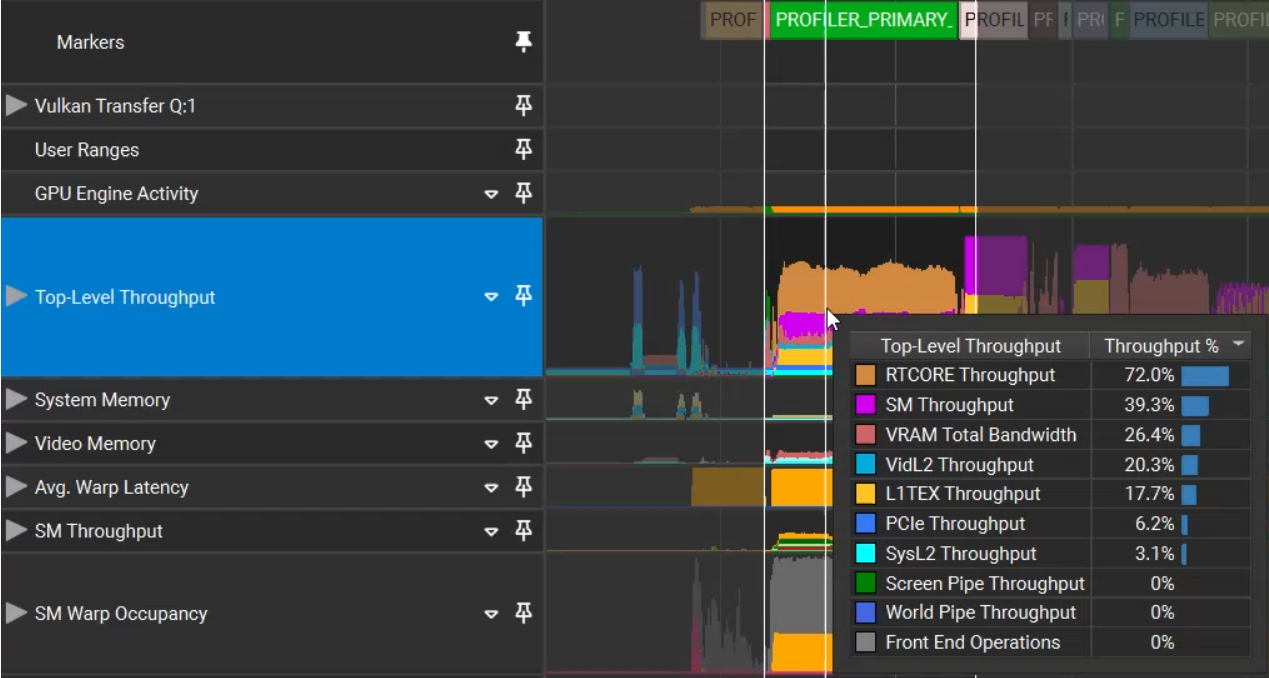
When hovering your mouse over the timeline, a tooltip appears that displays the average of the metrics data per the selected time. The data is sorted from high to low:
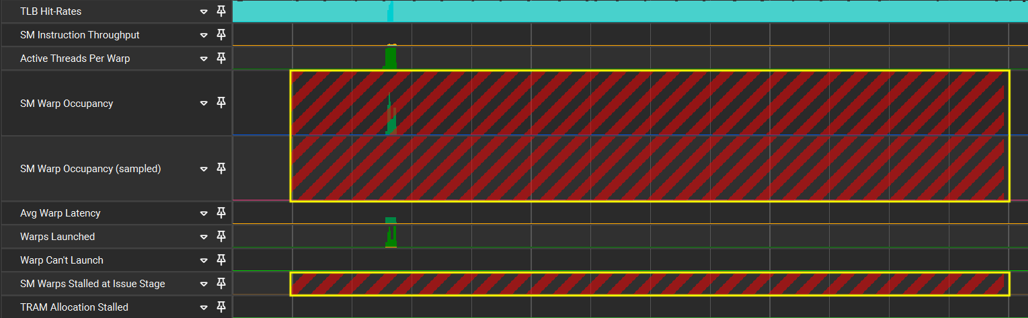
GPU Unit’s Metrics Data Rows
GPU Trace presents hardware units’ metric data collected throughout the frame execution. This data is presented in the timeline. Each counter data is presented in a specific row, while some counters are grouped for convenience. Hovering over the metric’s name, a tooltip is presented with the counter description. Group rows can be expanded to view individual counters.
The tooltip shows the counter data for the specific time where your mouse is pointed, or the average counter value for the selected range.
Note
Regions of the timeline that contain rows without any sampling data are clearly marked and crossed off to indicate the absence of samples. For example, this can occur in regions corresponding to another process’s context as a result of context switching.
Handling Rows in the Timeline
GPU Trace collects a lot of data. It is possible to arrange the timeline in a way that betters meet your current needs and allows you to focus on the area of your interest.
Hiding Rows
Focus your performance triage operation by hiding rows that are not the main concern by right-clicking the row of interest and then selecting the hide option.
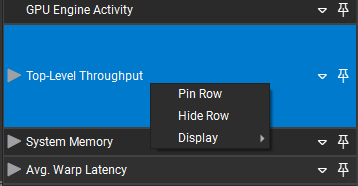
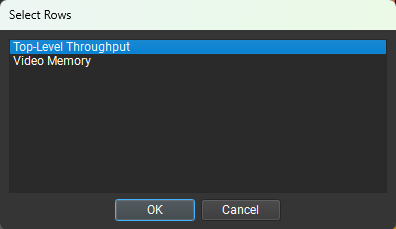
Hiding a row removes it from the timeline, but does not delete the data from the database. You can add the row back to the timeline by clicking the green + square at the bottom of the timeline and then selecting the row you wish to add back.
Change Rows Location
You can change the Metrics Data Rows’ location by pressing Alt + Left Click and dragging the rows to the desired location.
Pinned Rows Option
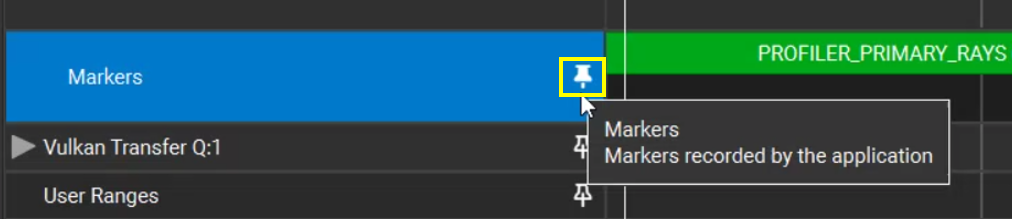
The GPU Trace timeline allows you to pin rows. You can either click the pin icon on the right of the row or right-click a row and select to pin the row. The row will maintain it’s position within the view or be anchored to the top or bottom depending on whether you scroll up or down.
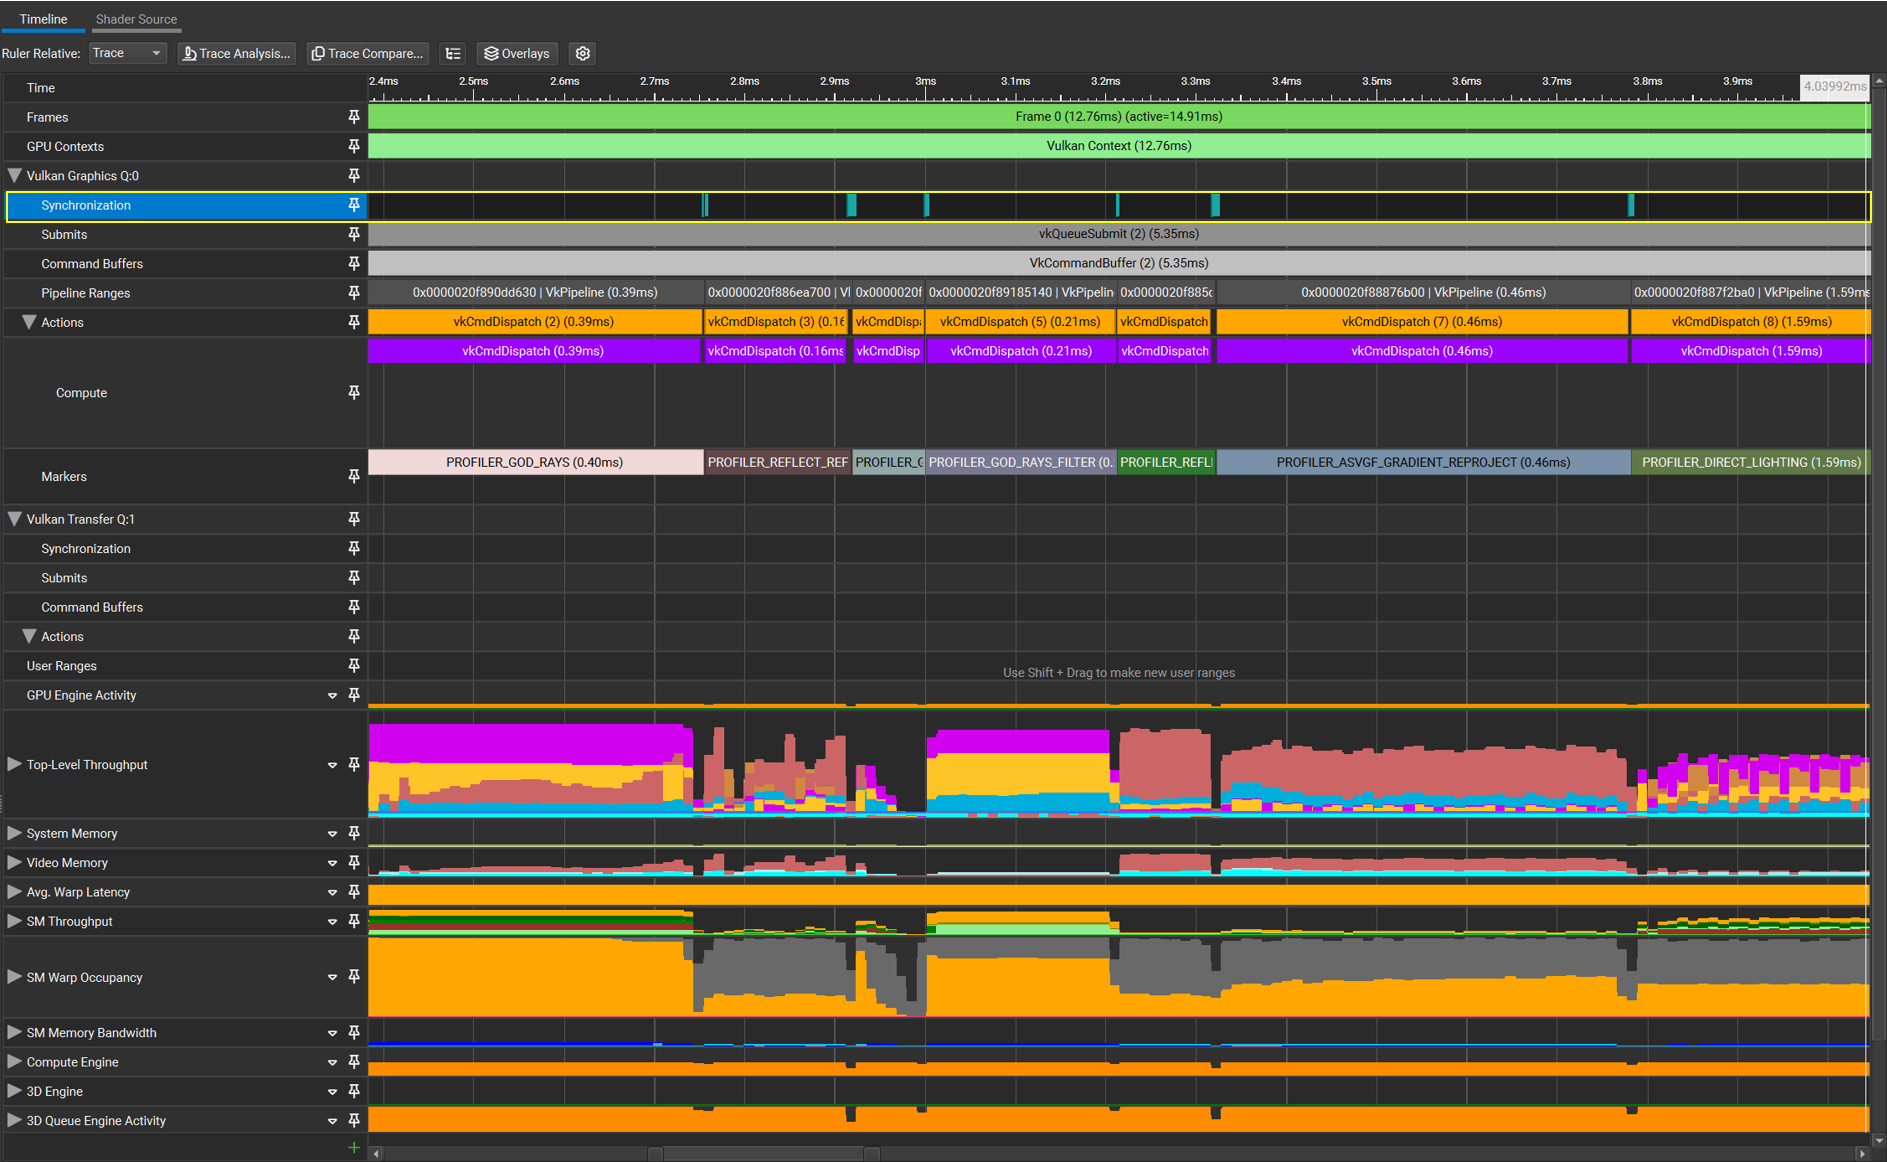
This information is saved so when reopening the report, the settings remain. In the below example, the Top-Level Throughput row is pinned, and this allows you to keep this row visible:
When hovering over the row, a pinned button pops up. If you click this row, it automatically moves to the top of the timeline and remains anchored when scrolling down the other rows. You can choose more than one row to pin.
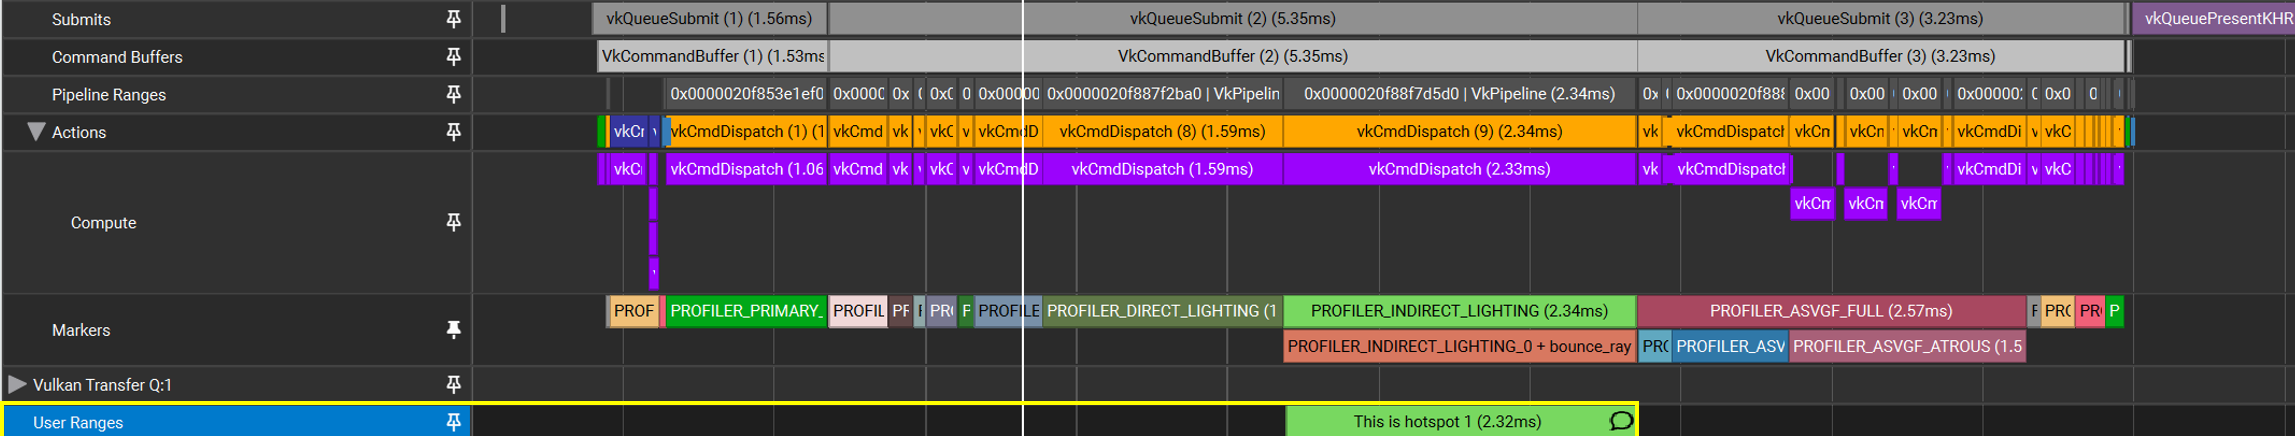
User Ranges
User Ranges are ranges that can be added and edited on the GPU Trace report. This can be used as personal notes and enhance performance triage capabilities.
To add a user range:
Select a range in the User Ranges row with “SHIFT + Mouse Right-Click.”
In the dialog that pops add you label and description.
Press OK.
Next to the file name, there is an asterisk (*), which indicates that this report has been edited.
You can edit or remove the range by using the right-click menu.
A user range acts like any other range and its data is reflected accordingly in the Summary and Metrics tab.
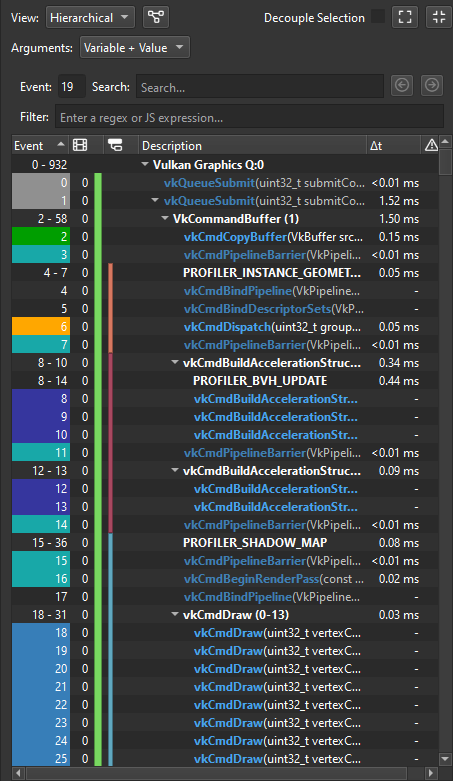
Event List#
The GPU Trace Event List view shows a subset (relevant to GPU performance) of API calls made by your application. It allows you to more easily identify a specific API call and find its duration on the timeline. The event list is searchable and filterable through text edits at the top of the view.
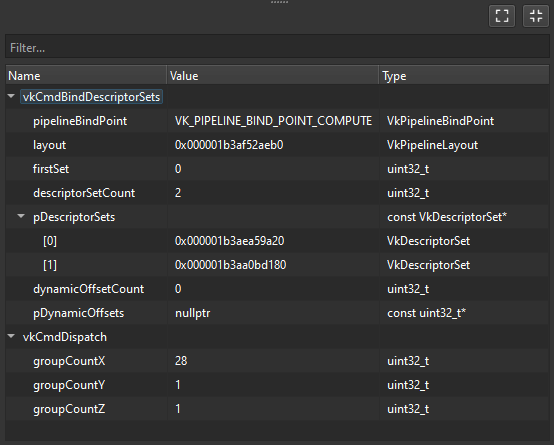
Event Details#
The GPU Trace Event Details view shows API parameters of selected events in the Event List view. Parameters are listed in the same order as the selected event in a hierarchical structure. The event details are filterable through text edits at the top of the view.
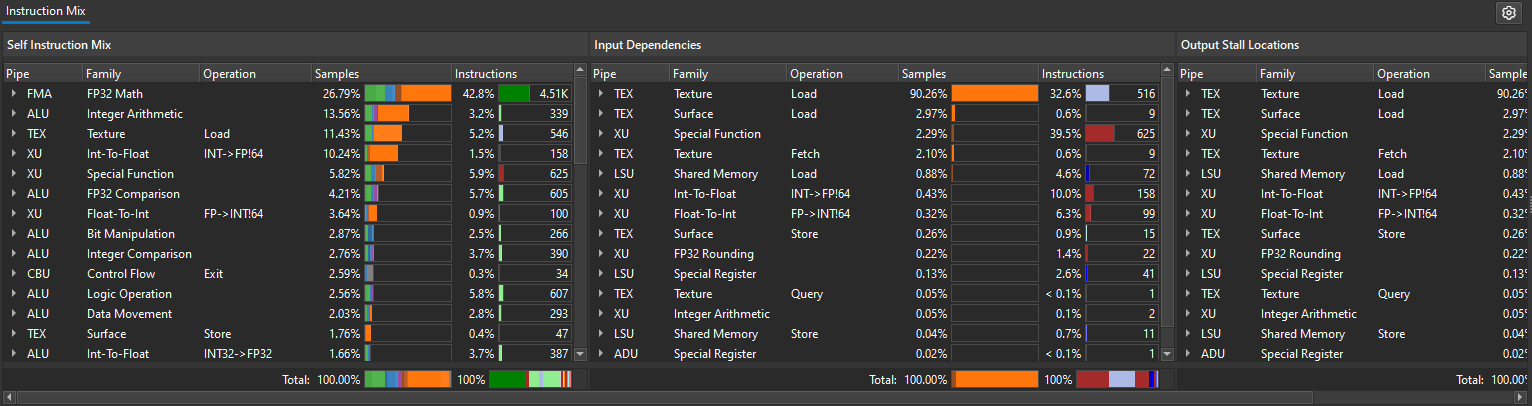
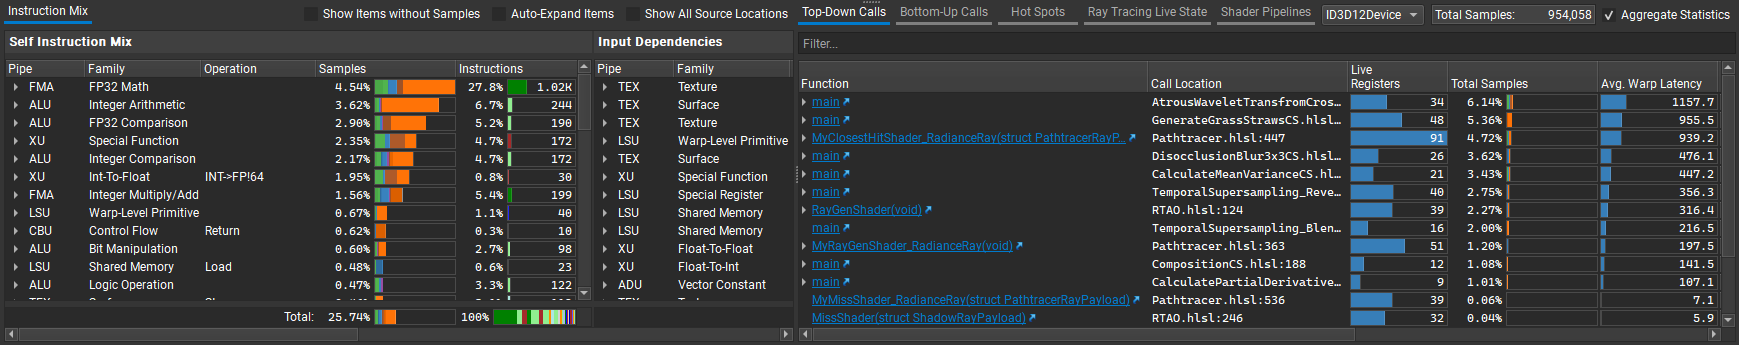
Instruction Mix#
The Instruction Mix view provides a breakdown of the instruction types, input dependencies and output stall locations in your shader(s). It is context-sensitive to the selection on the Timeline and Source views. See Shader Profiler Instruction Mix for more information.
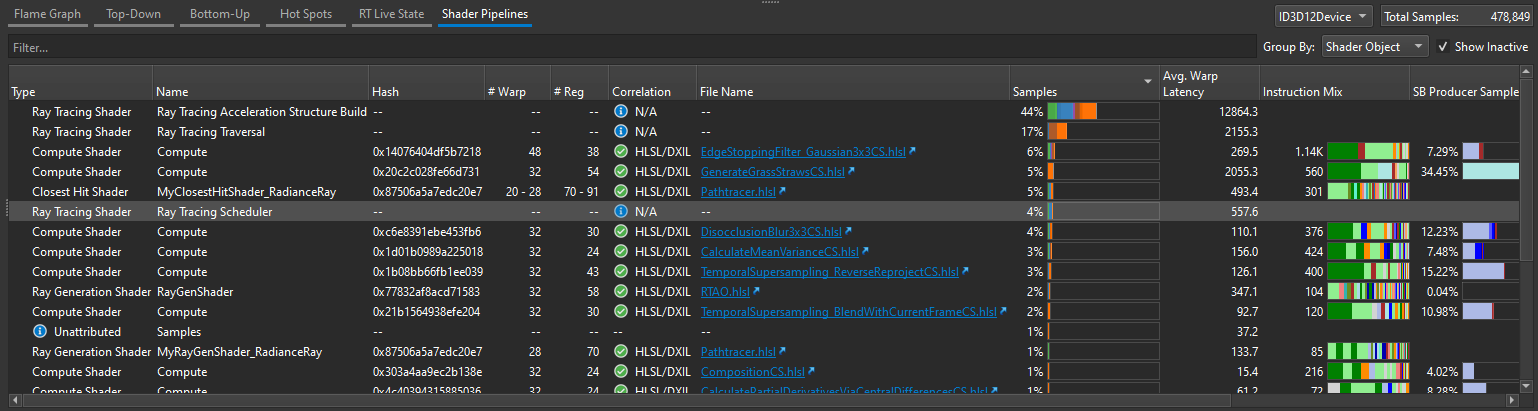
Real-Time Shader Profiler Tabs#
The real-time shader profiler views provide high-level insight into shader performance and can be used to jump to source code in the source view. It is context-sensitive to the selection on the Timeline view. See Shader Profiler Sections for more information.
Shader Profiling#
The Shader Profiler is a tool for analyzing the performance of SM-limited workloads. It helps you, as a developer, identify the reasons that your shader is stalling and thus lowering performance. With the data that the shader profiler provides, you can investigate, at both a high- and low-level, how to get more performance out of your shaders. See the Shader Profiler section for more information.
Shader Source#
When Collect Shader Pipelines is enabled the timeline shows a second tab called Shader Source. Switching to this tab hides the timeline and instead shows a source-level view of your shaders. If Real-Time Shader Profiler was also enabled, the shader source contains additional profiling information. See the Shader Profiler section for more information.
When Real-Time Shader Profiler is enabled, the views below the timeline and shader source view are useful to navigate between and find optimization opportunities within your shaders. See the Shader Profiler Tabs section for more information.
Information Tabs#
The Information Tabs section provides general information on the trace, and also provides an additional view on the metrics data that were collected.
It contains 3 tabs:
Summary Tab#
The upper section on the Summary tab provides details for the selected range. If no selection has been made, the information is relevant to the entire visible range:
Start: The start time of the selected range or the visible range.
End: The end time of the selected range or the visible range.
Duration: The duration on the selected range or the visible range.
Range: An indicator whether the relevant data is applicable to a selected range on the visible range.
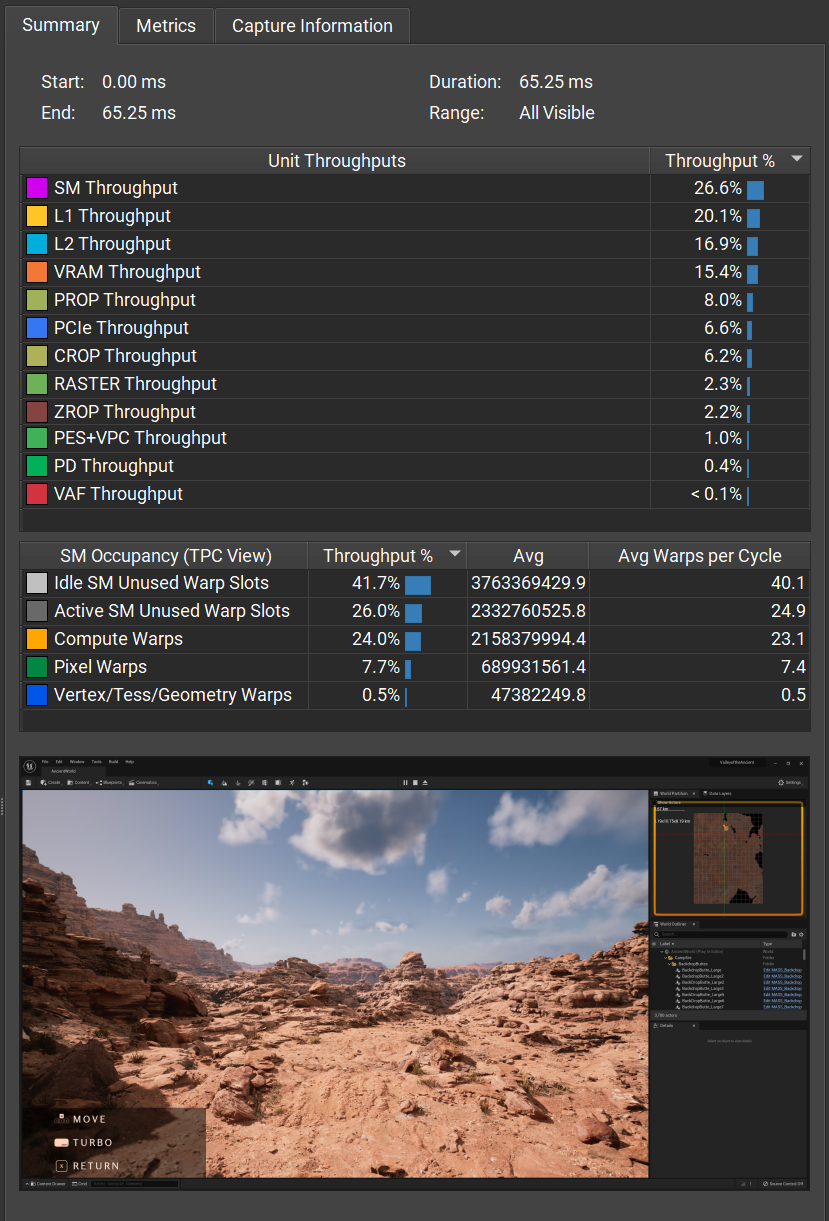
Unit Throughput Summary Table
In this table, you can easily see the average value of the throughput units for the selected range. You can sort values from high to low.
Warp Occupancy Table
In this table, you can easily see the average value of the warp occupancy counters.
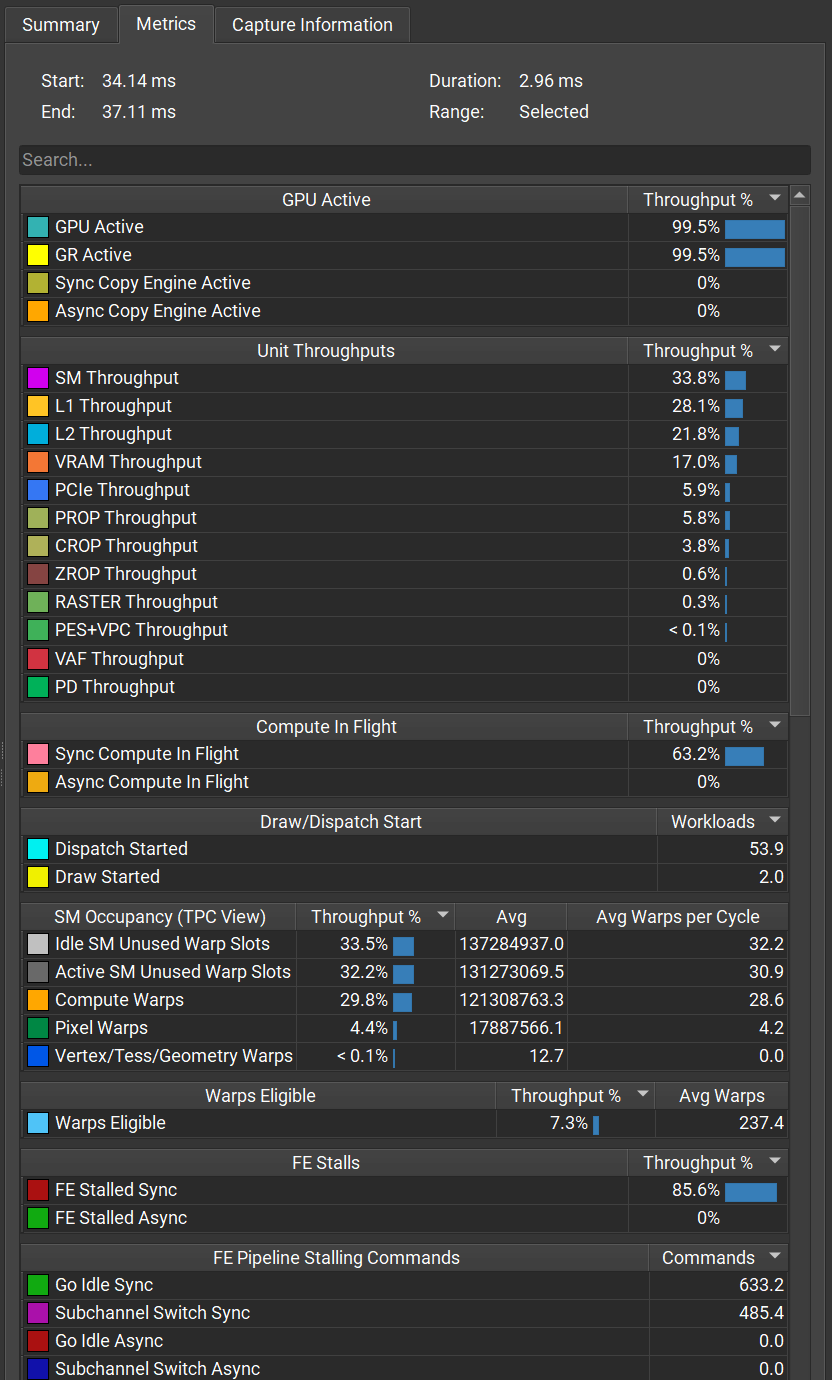
Metrics Tab#
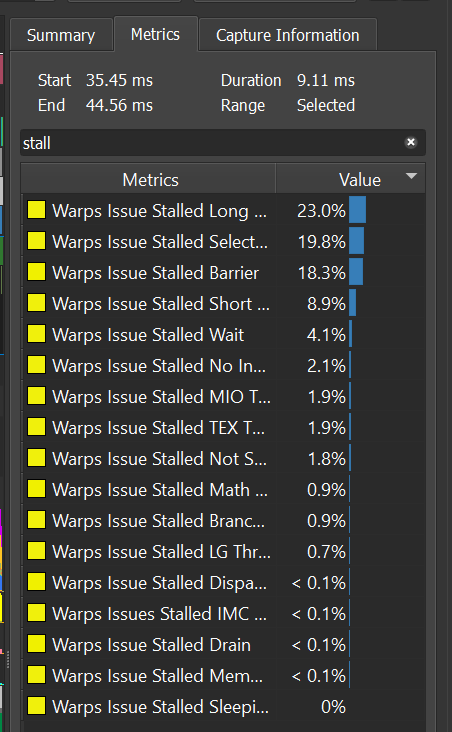
The Metrics tab encapsulates all metrics data and shows the average value for the selected range. You can easily filter and search for the desired counter using the text search bar. To do so, simply type the counter name (or part of the name), and the table is filtered automatically.
The metrics are divided according to the GPU Units / roll they represent.
Values in the metrics tab changes according to the corresponding selected range in the metrics graph area.
Trace Information Tab#
The Trace Information tab provides general information of the trace, such the GPU model, CPU, and operating system that were used for the executable and command line arguments. This might be useful when trying to analyze workload behavior or reproduce issues.
In addition, the Trace Information tab also provides a User Comments section where you are able to add detailed notes about the trace to help you recall more information about the trace, such as what analysis you may have already done.
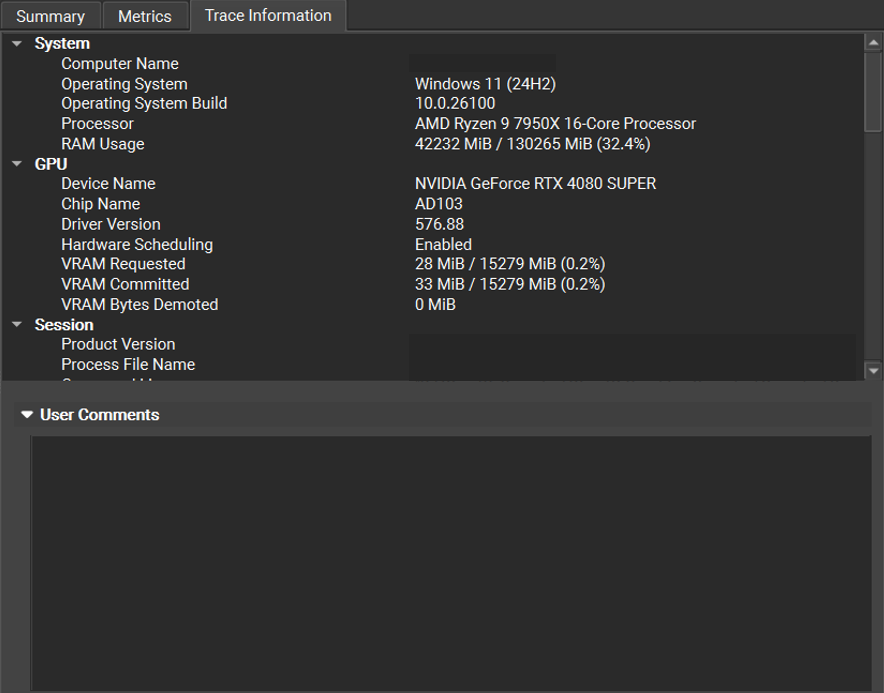
Note that if there were any warnings or errors occurred while making this trace, they will appear in this tab.
Analysis View#
GPU Trace provides a live analysis trace of the occupancy and throughput of the GPU’s various units. With the “Throughput Metrics” metric set, data for these metrics is collected in a single frame. This data provides to the user a good overview of how the GPU was occupied over time, with correlation to user markers, draw / dispatch commands, command lists’ execution, and synchronization objects. When using the “Multi-Pass Metrics,” data for more metrics is collected, but this time across multiple frames. In this mode, the trace contains not only throughput and occupancy data but also stall reasons, memory usage breakdown, and more. This mode is very beneficial to understand not only the limiting unit but also to understand the reason. However, in order to correctly understand the provided data and interpret it, in-depth understanding of NVIDIA hardware is required. The GPU Trace analysis tool aims to simplify the work for the end user by analyzing the provided data and automatically generating recommendations of where to look, potential areas that should be fixed and how. The analysis mode contains more than 40 common and advanced use cases and ‘lessons learned’ provided by our top devtech personnel. The goal of the tool is to provide actionable insights into the quality of every range in the trace. The tool will evolve over time and will always be up-to-date with more annotations that reflect our gained experience while doing performance triage.
Anlysis Ranks and Concept
The analysis tool contains many rules and formulas (limiters) that analyze the trace. The rules are grouped according to the relevant GPU Unit or role. Each group may contain one or more limiters. Each limiter consists of metrics data and has “Projected range gain” and “Projected frame gain.” The trace analysis ranks ranges according to the projected frame gain. The recommendation is to look at the markers’ leaves first, since this is easier to focus on a specific range. When looking at the bigger ‘parent’ markers, there is a need to take into consideration that the projected gain is bigger as the range itself is bigger, and may have a larger impact on the overall frame by nature.
Prerequisites
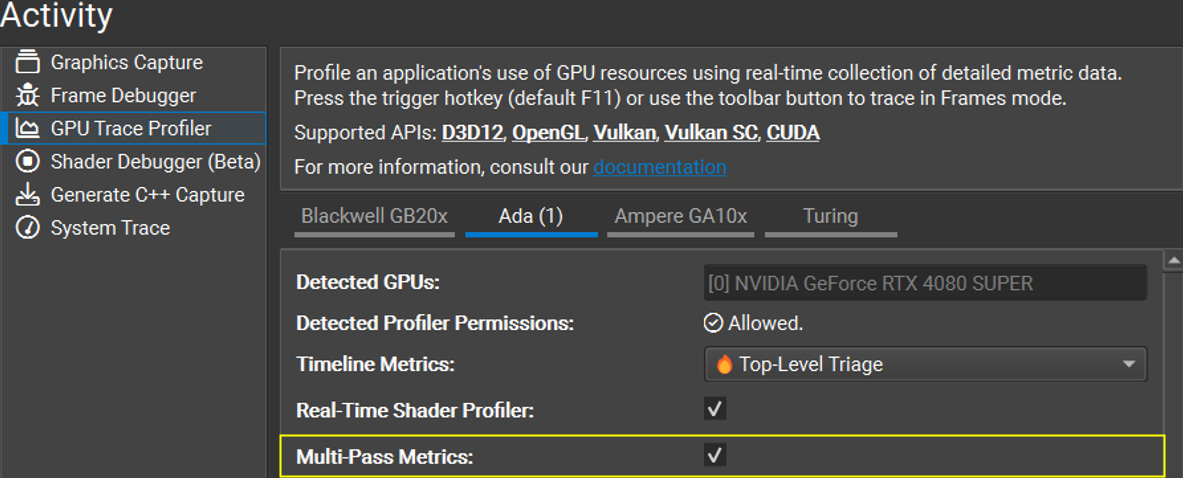
To get the most out of the analysis report, be sure to generate a trace using the “Multi-Pass Metrics.” You can enable “Multi-Pass Metrics” in 2 ways:
Check the “Multi-Pass Metrics” checkbox in the GPU Trace project settings:
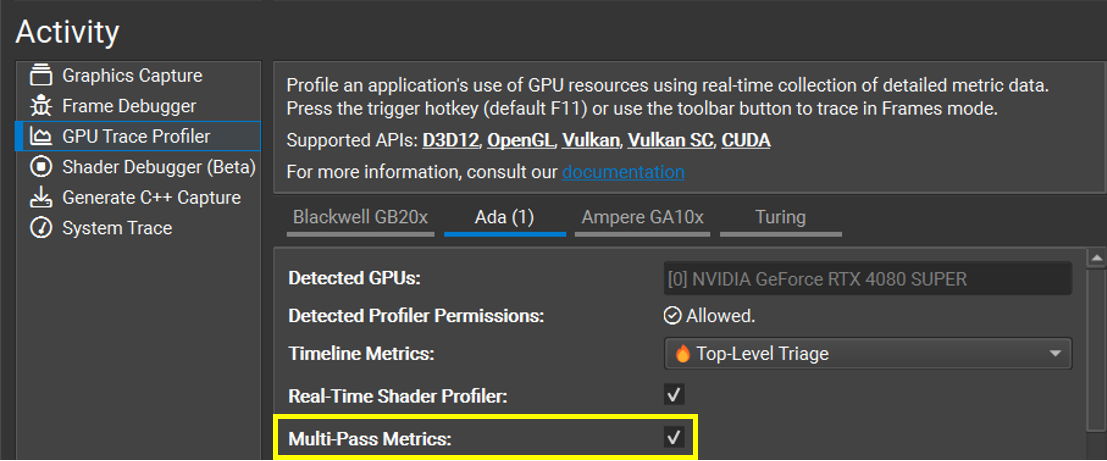
If a GPU Trace session is already running, there is an option to enable “Multi-Pass Metrics” in the toolbar:

Note
Since the “Multi-Pass Metrics” collects data from multiple frames, you can help get more accurate results by following these recommendations:
Make sure no other applications are running.
Make sure the option “Lock Clocks to Base” is checked.
It is recommended to run on a C++ capture or pause the application engine if you can.
It is also recommended to trace 3 frames so the “Aggregate” mode is applicable.
Activating the Analysis View
After you make a trace using “Multi-Pass Metrics” on the desired frame, open the trace file. Once opened, select aggregate mode if you traced more than a single frame. This can also be changed in the analysis view. Click the “Analyze” button, and the analysis view is opened in a new tab. (Note that this feature is currently available only on Windows.)

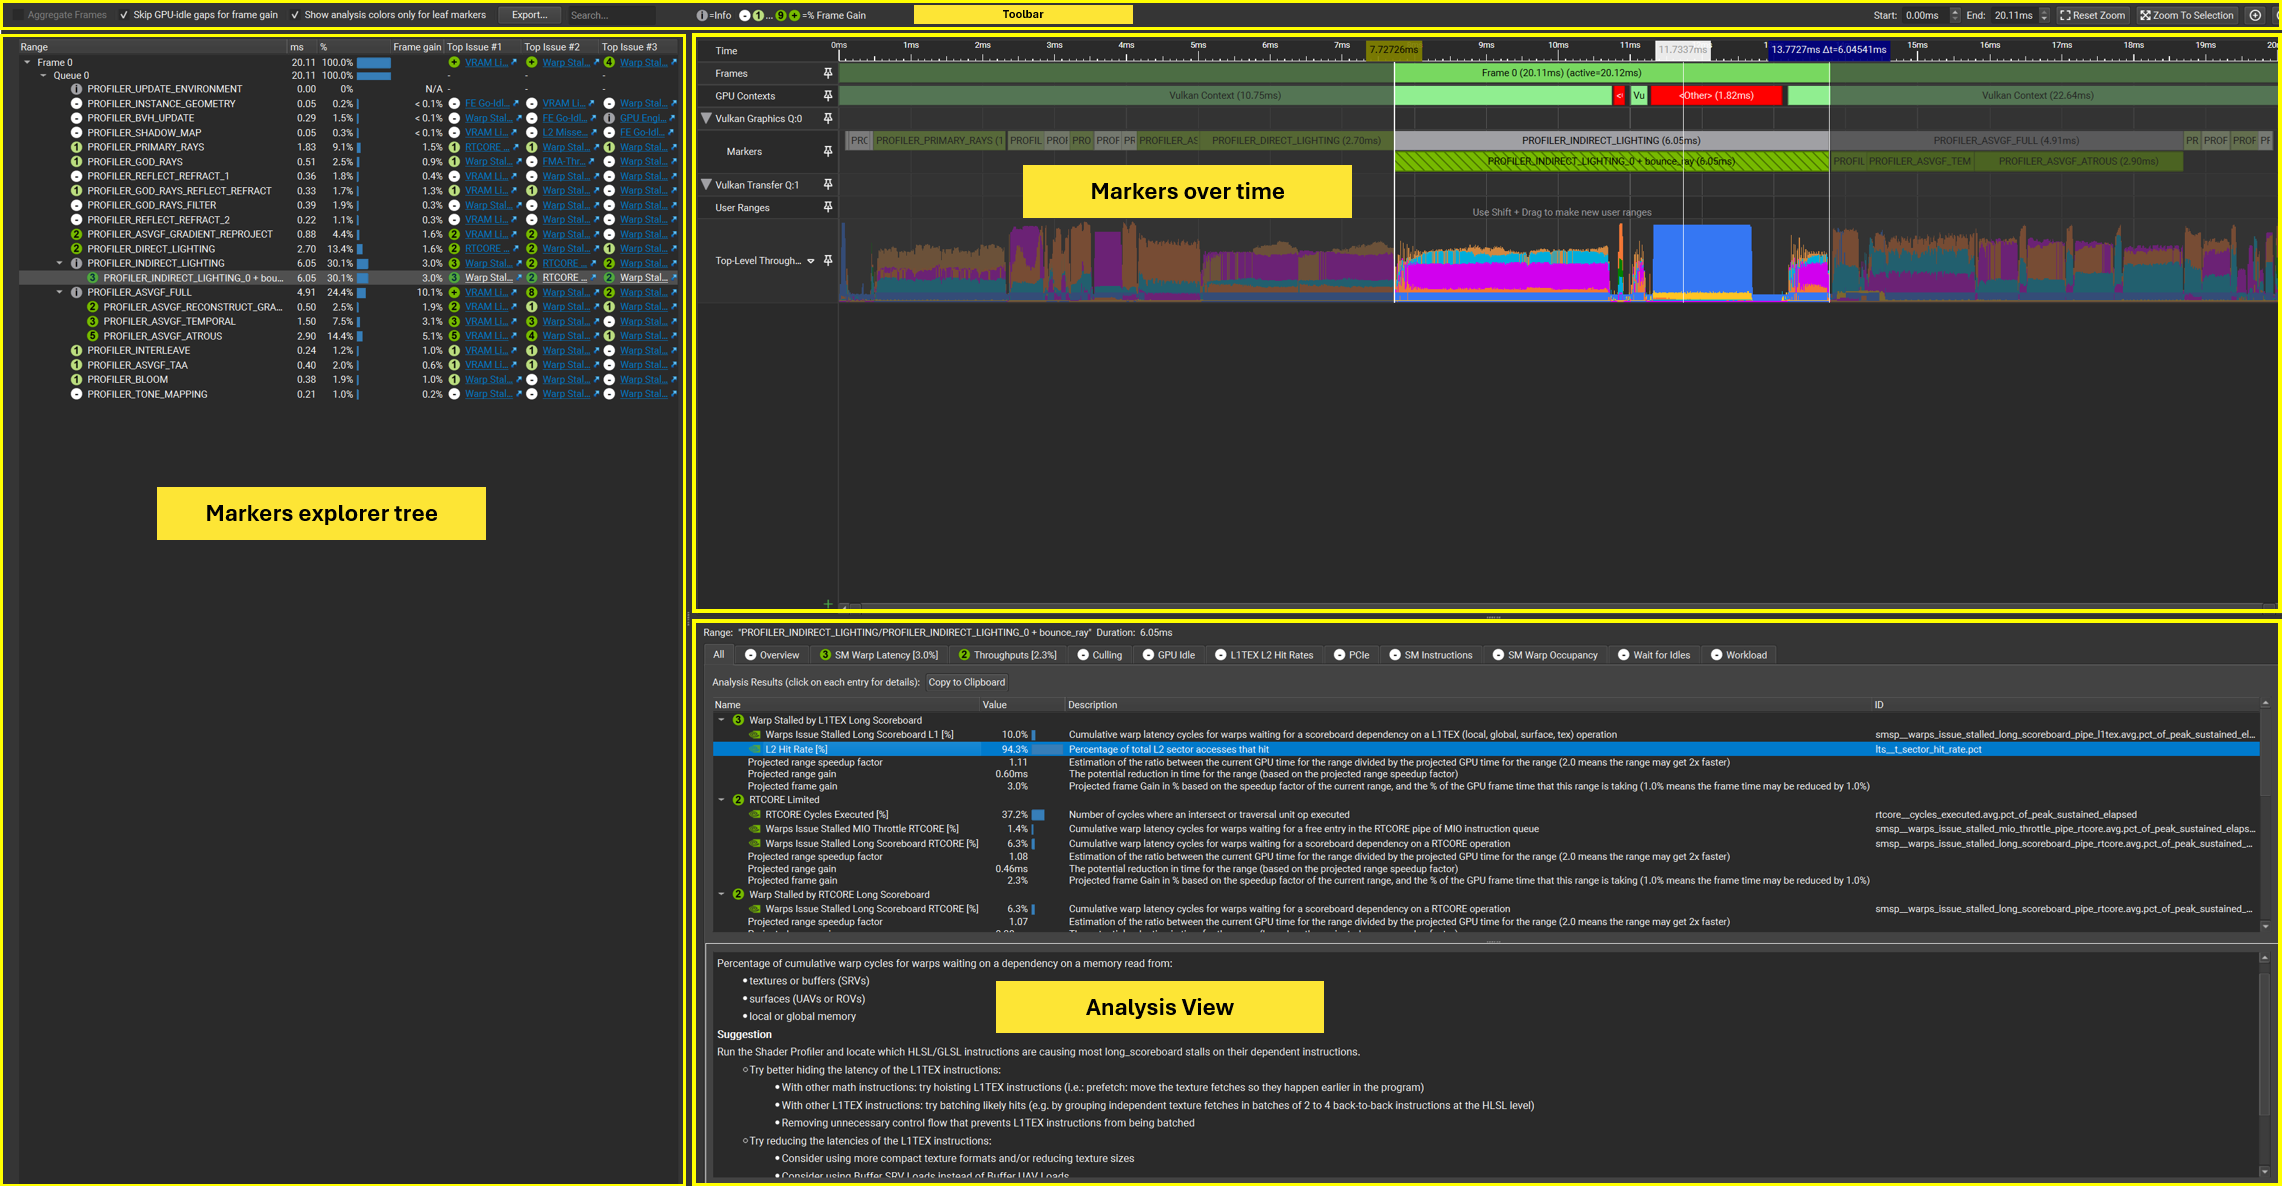
Understanding the Analysis View
The analysis view is divided into 3 main sections (and a toolbar): Markers tree, Timeline, and the Analysis view.
The Toolbar Area

Aggregate Frames
This option is only enabled if more than one frame was traced. This improves accuracy since the metric values are calculated as an average and it reduces the influence of noise.
Skip GPU-Idle gaps for frame gain
When this is checked, the frame gain is calculated out of the frame duration without the GPU-Idle gaps. This is especially handy when profiling a CPP-Capture frame where there might be some artificial CPU work ranges that cause the GPU-Idle and can influence the projected gain calculation.
Show analysis colors only for leaf markers
Usually when doing performance triage, it is better to focus on the leaves first, since it is easier to fix code that performs a specific task. This is why the analysis tool performs analysis on the markers leaves first. In addition, since we rank markers according to the “projected frame gain,” the bigger markers may get higher rank by nature. Check “Show analysis colors only for leaf markers” if you want to perform full analysis, on all markers.
Icon legend for the different severity levels:
Icon |
Explanation |
Denotes ranges where the maximum projected frame gain is around 10% gain or higher |
|
Denotes ranges where the maximum projected frame gain is around N%, where N is the number appearing in the icon |
|
Denotes ranges where the maximum projected frame gain is less then 0.5% |
|
Denotes ranges where the maximum projected frame gain is 0, or not available |
Note
The info annotations represent a collection of metrics with “normal” values. The annotation’s explanation and metrics values may still assist in understanding a potential issue.
The markers tree:
The markers tree shows all the performance markers according to their hierarchy. Each marker has the correlated icon, the duration, the % of the marker’s duration from the entire frame, and the frame gain.
Timeline:
This view shows the markers on the timeline. It helps to understand in a glance the way the frame is being executed over time. In this mode, the markers are color-coded by the potential frame gain. By default, we mark only leaf nodes as we recommend starting to triage the leaves first.
Analysis view:
This is the main content of the analysis. Limiters and formulas and divided into multiple categories. Each category represents a certain unit or a collection of units in the GPU. Each tab in the analysis view represents a category such as those shown in the below figure:
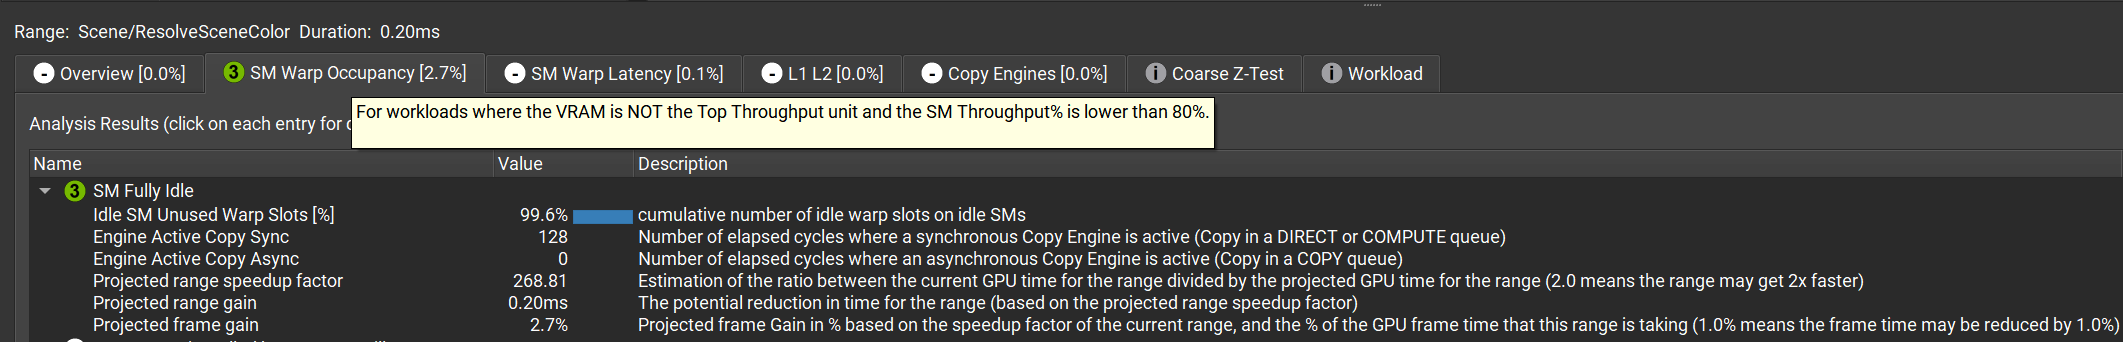
The categories are sorted according to the severity so the more severe is on the left-hand side. Hovering over the name of the category shows in an informative tooltip that explains the essence of this category.
Each category contains one or more annotations. Annotations are a set of metrics that has some corresponding logic. Click the annotation to see the relevant explanation, suggestion (if applicable), and the potential frame gain.
You can also view the metrics which are taken into consideration while calculating this annotation, the metric value, and a short description.
The Overview Annotations Category:
The overview category is special and is always the first to look at. It gives a good indication of the overall performance of the specific range and what is be the main unit with sub-optimal throughput. It also follows the Peak-Performance-Percentage (P3) analysis method presented and explained in the blog post here: https://developer.nvidia.com/blog/optimizing-vk-vkr-and-dx12-dxr-applications-using-nsig
Trace Compare#
The Trace Compare tool enables the GPU Trace user to easily analyze the effect of his code changes on a specific frame. It displays a simplified version of the GPU Trace time line for 2 frames. The frames are placed one on top of the other, with their start time aligned. Trace compare enables to compare either 2 frames from 2 different GPU Trace reports or 2 frames within a single one.
Launch the Trace Compare Tool#
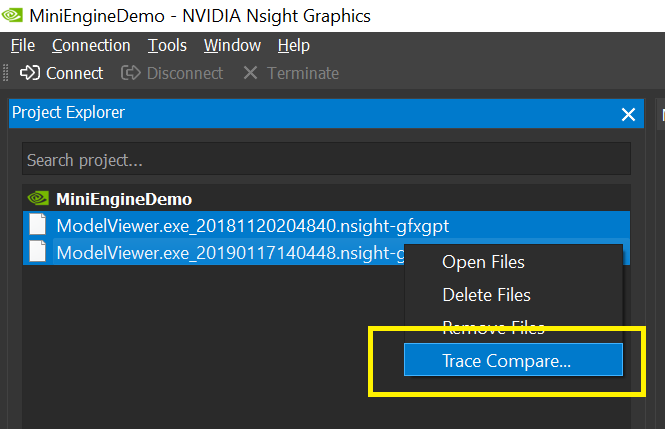
Option 1: Project Explorer:
Select two capture files in the explorer tree, right click and choose trace compare:
Option 2: Click on the toolbar button.
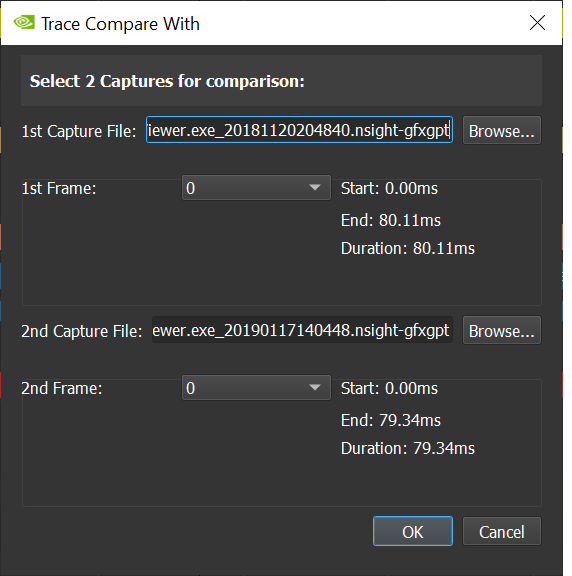
Trace Compare Dialog#
The Trace Compare dialog shows the selected files to compare. It also enables the user to choose the frame to compare from each capture in cases of multiple frames captures.
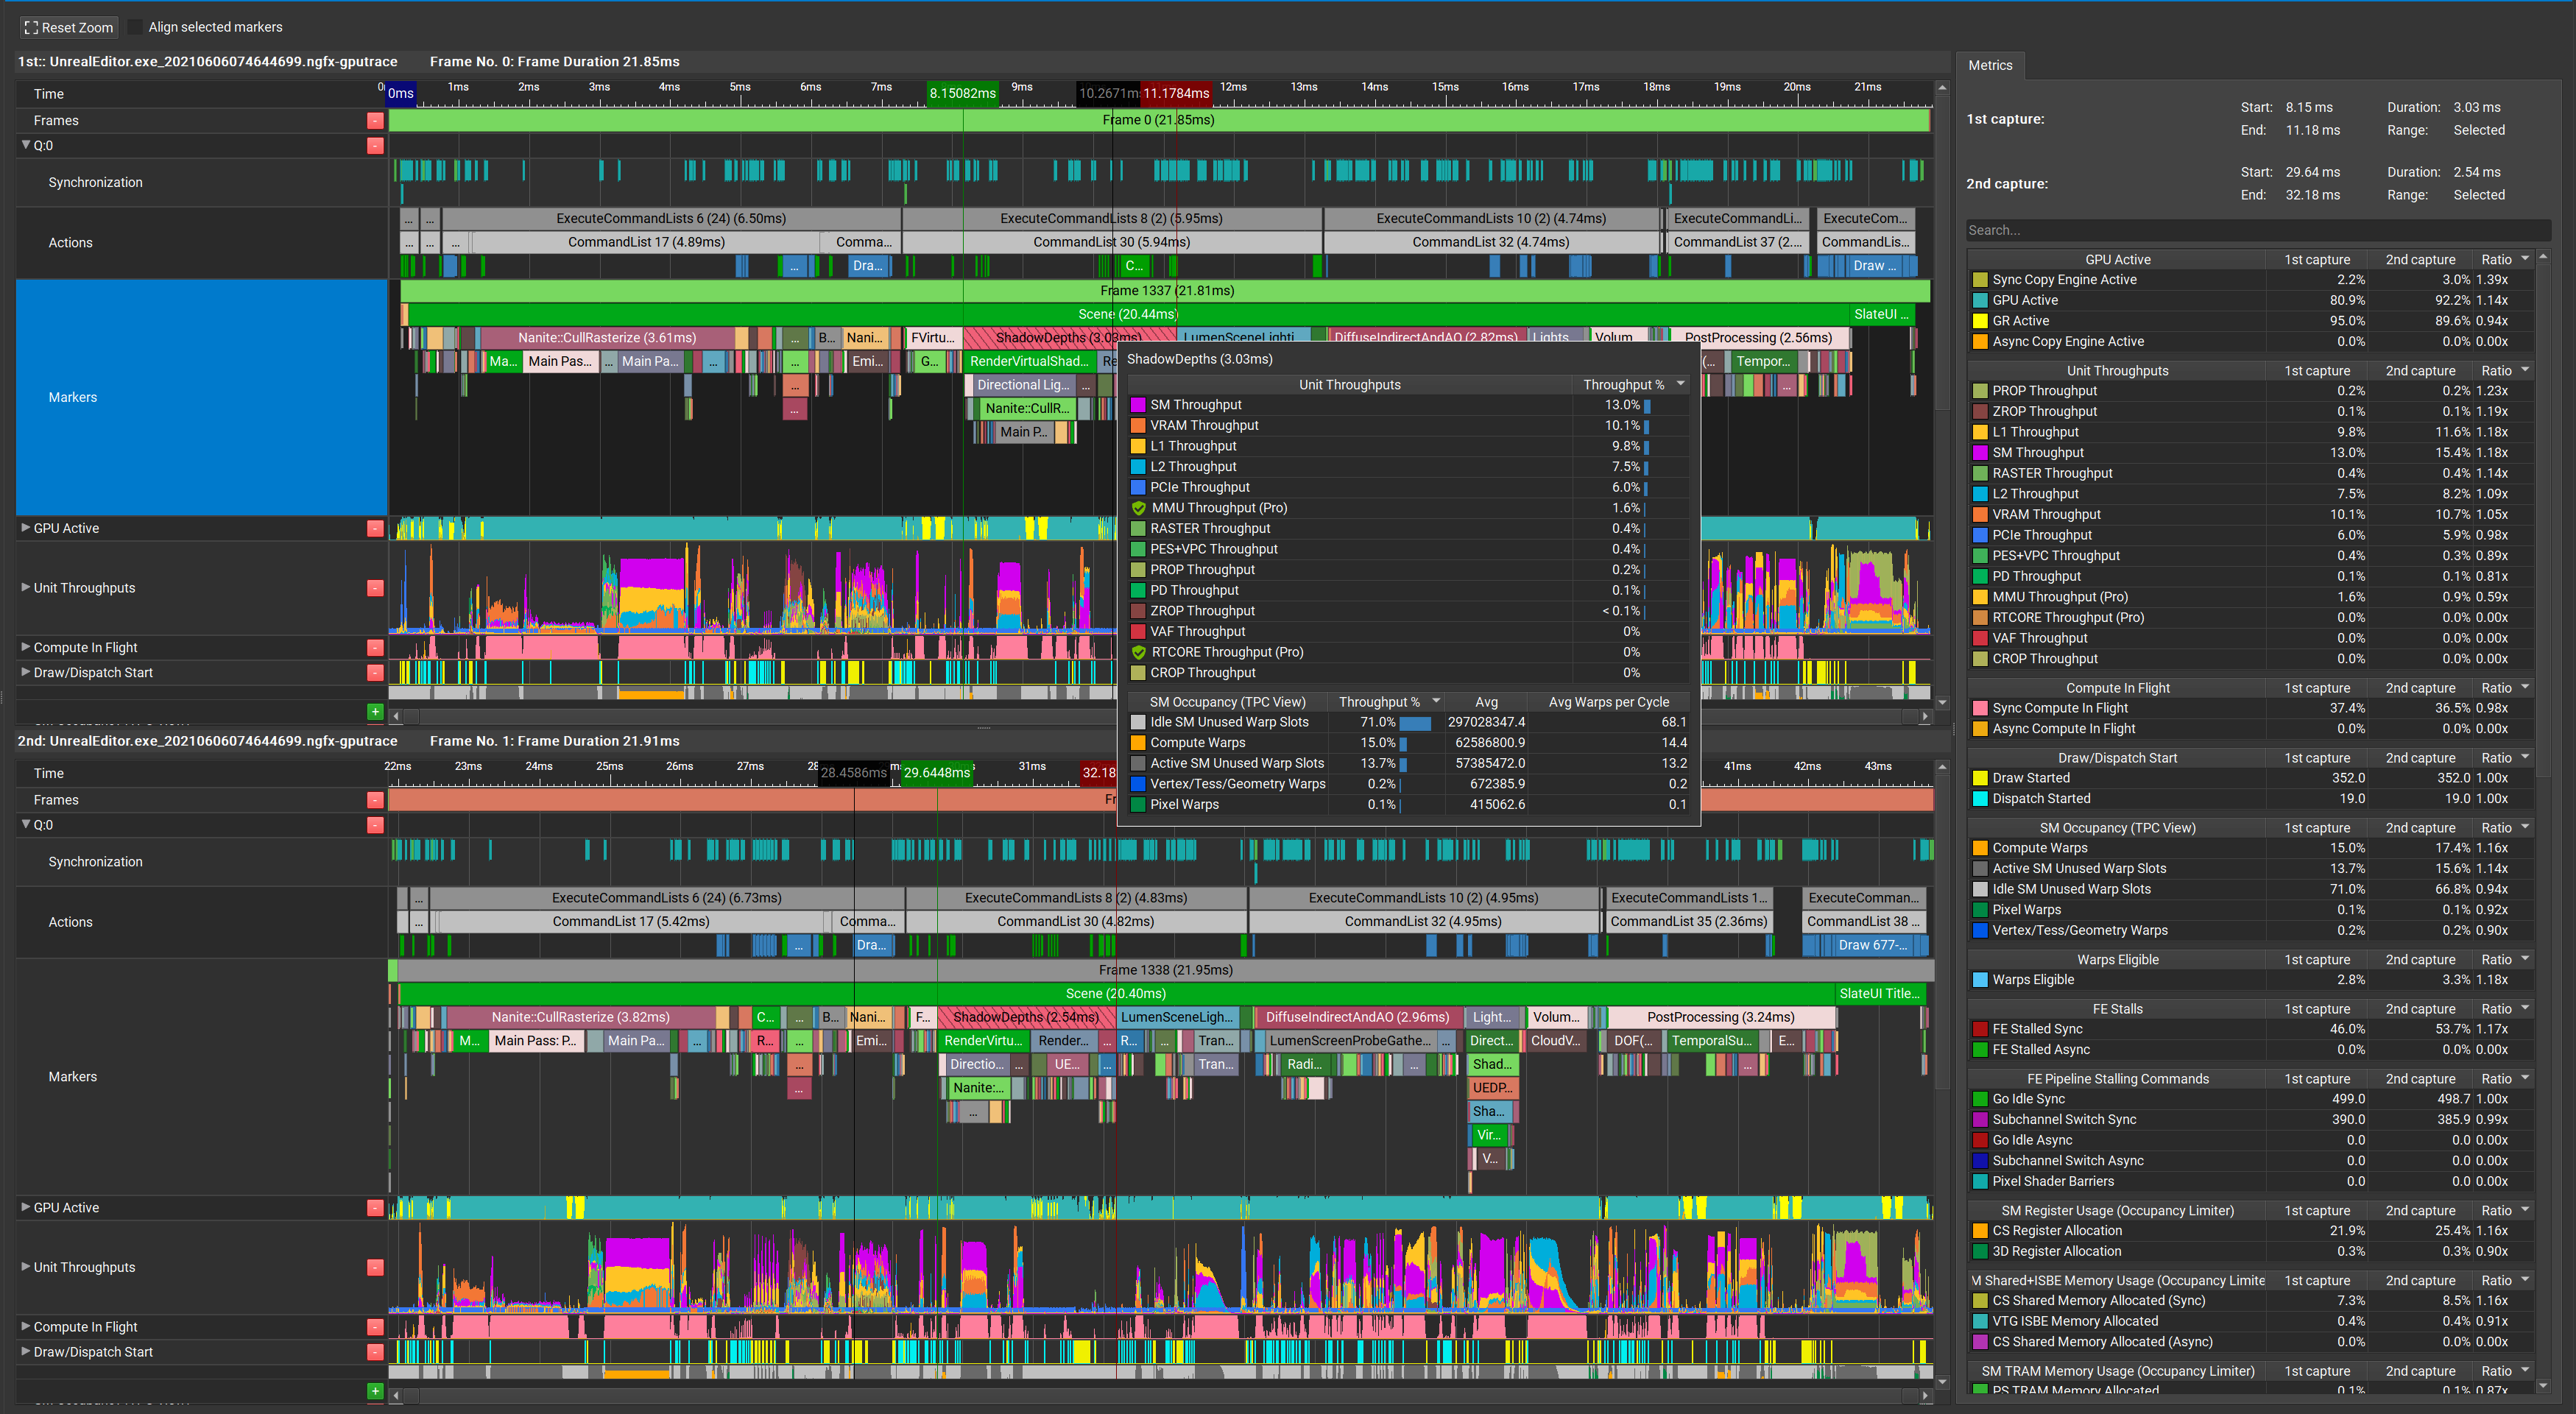
Using the Trace Compare Tool#
Trace Compare displays the selected frames in a simplified version of the GPU Trace timeline, one on top of the other, aligning the frames’ start time.
Markers are correlated as well, so when you click on a certain marker on one frame, the matching marker on the other frame is chosen, if found.
Align to Marker
Sometimes it is easier to spot differences when the selected markers’ start times are aligned. Choose a specific marker and click the Align matching markers check box to activate automatic alignment of matching markers.
Align Selections
It is also possible to manually align any pair of selections. Select any marker, action, or other range in the top and bottom views. Then press the Align Selections button to align the views on the selections.
Metrics Table in Trace Compare Mode
The detailed Metrics Table appears in this mode and shows the metrics data for each frame, side by side, and the delta between the values.
Metrics information
The trace compare tool shows the metrics data for each trace and the ratio between those values.
Profiling Frameless Applications#
GPU Trace is able to profile frameless workloads if different criteria are set for when the trace begins and ends.
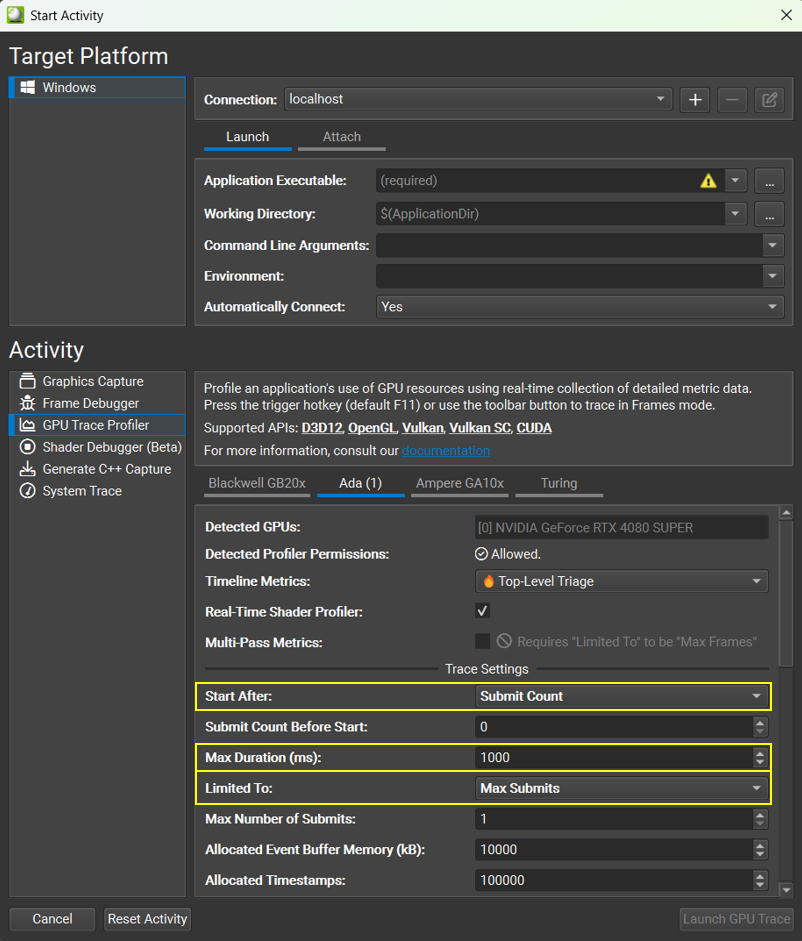
Configuring GPU Trace:
To profile such applications, change the Start After and Limited To settings within the GPU Trace connection dialog.
Change the Start After condition to one of the following options:
Manual Trigger: Specifies that the trace is manually triggered by the user through the host application or the Target application trigger hotkey on the running application.
Submit Count: The trace automatically starts after a select number of submits have been performed. Specifying 0 traces all submits.
Elapsed Time: The trace automatically starts after a select amount of time has elapsed.
Change the Limited To condition to one of the following options:
Max Submits: The trace is limited to a set number of submits in addition to the max duration. The trace starts on the the next submit once the Start After condition has been met.
None: The trace is only limited by the max duration. The trace starts on the the next submit once the Start After condition has been met.
Depending on the choice of the Limited To option, it may also be necessary to update the Max Duration setting.
Set the rest of the settings as you normally would, providing the executable file and path, working directory, command line arguments and environment variables.
Collecting a Trace:
To collect a trace, all you need to do is press the “Launch GPU Trace” button. A trace is automatically collected when GPU Trace detects the supported API is in flight.
Open a GPU Trace report:
Once the trace has been collected, simply open the generated report and analyze it as you normally would.
Things to keep in mind:
Allocated Timestamps
GPU Trace is a detailed profiler and it collects a lot of metrics data, hence it is limited in the profiling session duration. The Allocated Timestamps setting influences the size of the buffer that the GPU Trace allocates to keep track of the GPU events. If you get an error message in the Output Messages window saying you ran out of resources, you might want to try and increase the number of Allocated Timestamps.
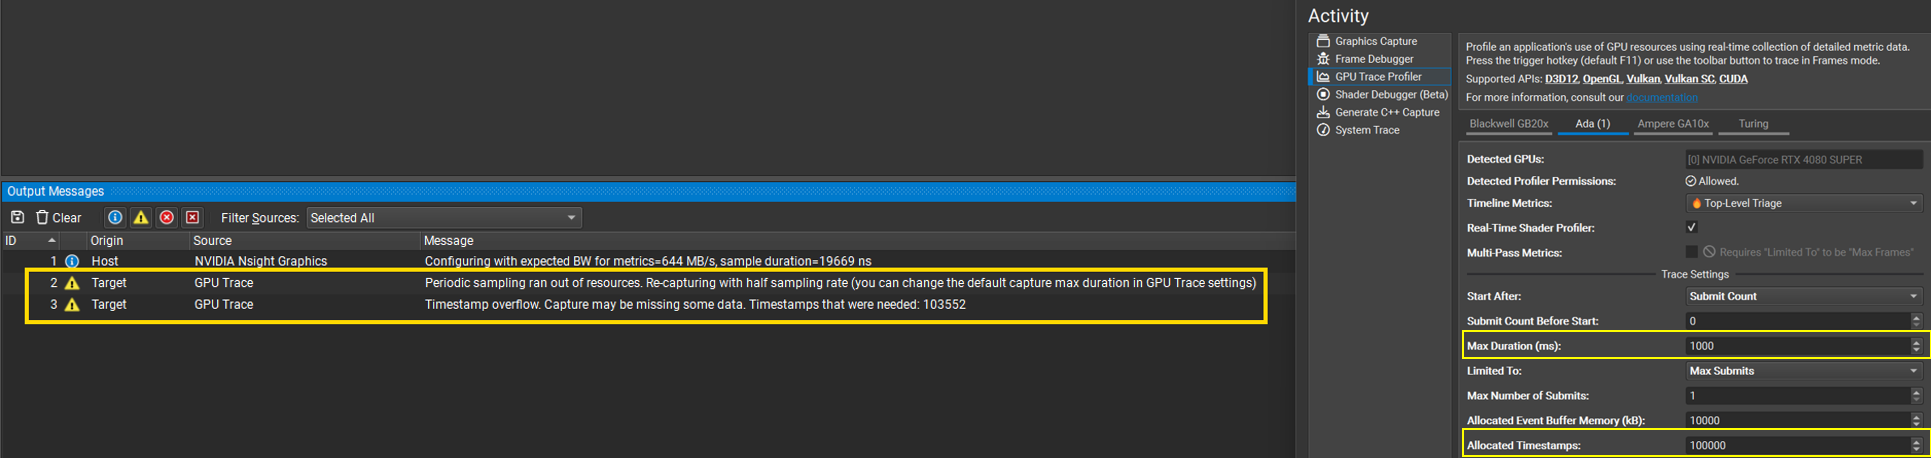
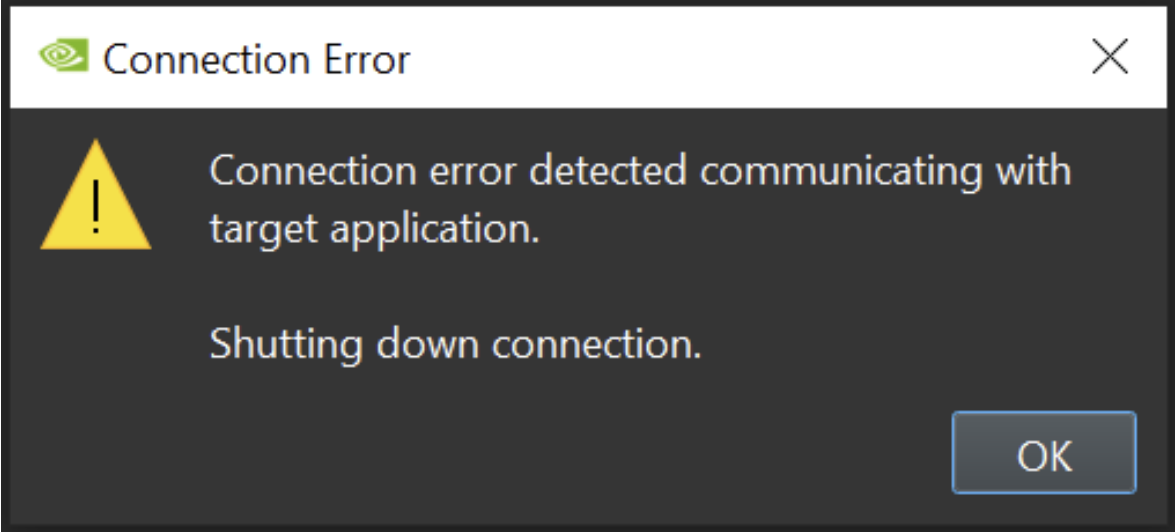
Application disconnected:
GPU Trace host launches the target application and profiles it. In this mode, the target application may exit automatically. Upon application end, you may get a warning message saying that the communication to the target was lost even though the trace was collected correctly.
Additional Capture Options#
Nsight Graphics framework enables launching an application with a specific set of command line arguments and/or environment variables. This is done via the ‘Connect to Process’ dialog.
Below are special pre-defined environment variables:
Automatic capture after X number of frames
Set WARPVIZ_CAPTURE_ON_FRAME to trigger a capture automatically after X number of frames elapsed.
For example:
WARPVIZ_CAPTURE_ON_FRAME=100 will trigger capture automatically, once, after 100 frames.
Repeat automatic capture for every X number of elapsed frames
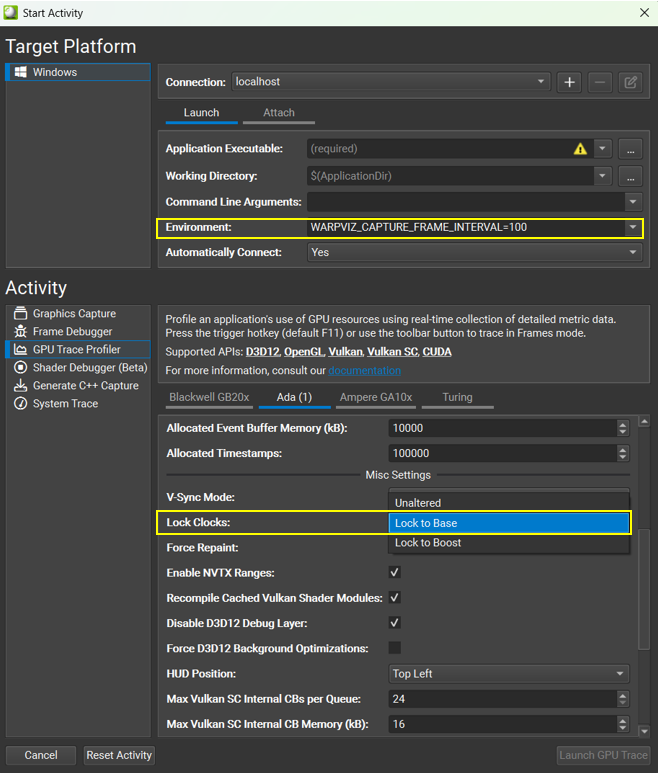
Set WARPVIZ_CAPTURE_FRAME_INTERVAL to automatically trigger a capture for every X frames elapsed.
For example:
WARPVIZ_CAPTURE_FRAME_INTERVAL=100 will trigger a capture every 100 frames.
Lock Clocks to Base
For better consistency between different captures, GPU Trace runs the target applications with ‘Lock Clocks to Base’. This means that the application will not run at maximum speed, but will be more consistent between runs. Turn it off if profiling at maximum speed is required.
Lock Clocks to Boost
GPU Trace offers the option to ‘Lock Clocks to Boost’ which attempts to lock to a higher frequency than base, but depending on thermal throttling, may still yeild a lower actual clock frequency.
Trace with Multi-Pass Metrics#
GPU Trace trace hardware throughput data on a single frame. This data is collected according to the metrics set defined when launching the application. It is now possible to configure the application to collect ‘Multi-Pass Metrics.’ In this mode, the GPU Trace automatically collects many more counters on consecutive frames. At the end of the collection, you are able to view all this data presented as a single profiling session.
It is required that when using this mode, the traced application has user markers since GPU Trace matched frames according to the markers. It is also preferred that the markers execution order is consistent.
This mode provides additional counters that may explain “Why” there is low throughput.
Enable Multi-Pass Metrics:
Check the “Multi-Pass Metrics” checkbox in the project setting dialog:
Trace with Multi-Pass Metrics:
You can collect using the Target application trigger hotkey or the “Collect GPU Trace” button as in the regular mode. However, you might notice that the process takes a longer time. This is because in this mode much more data is being collected.
This mode relies on markers consistency across frames. If GPU Trace detects such inconsistency, the inconsistent markers are removed with a warning message:
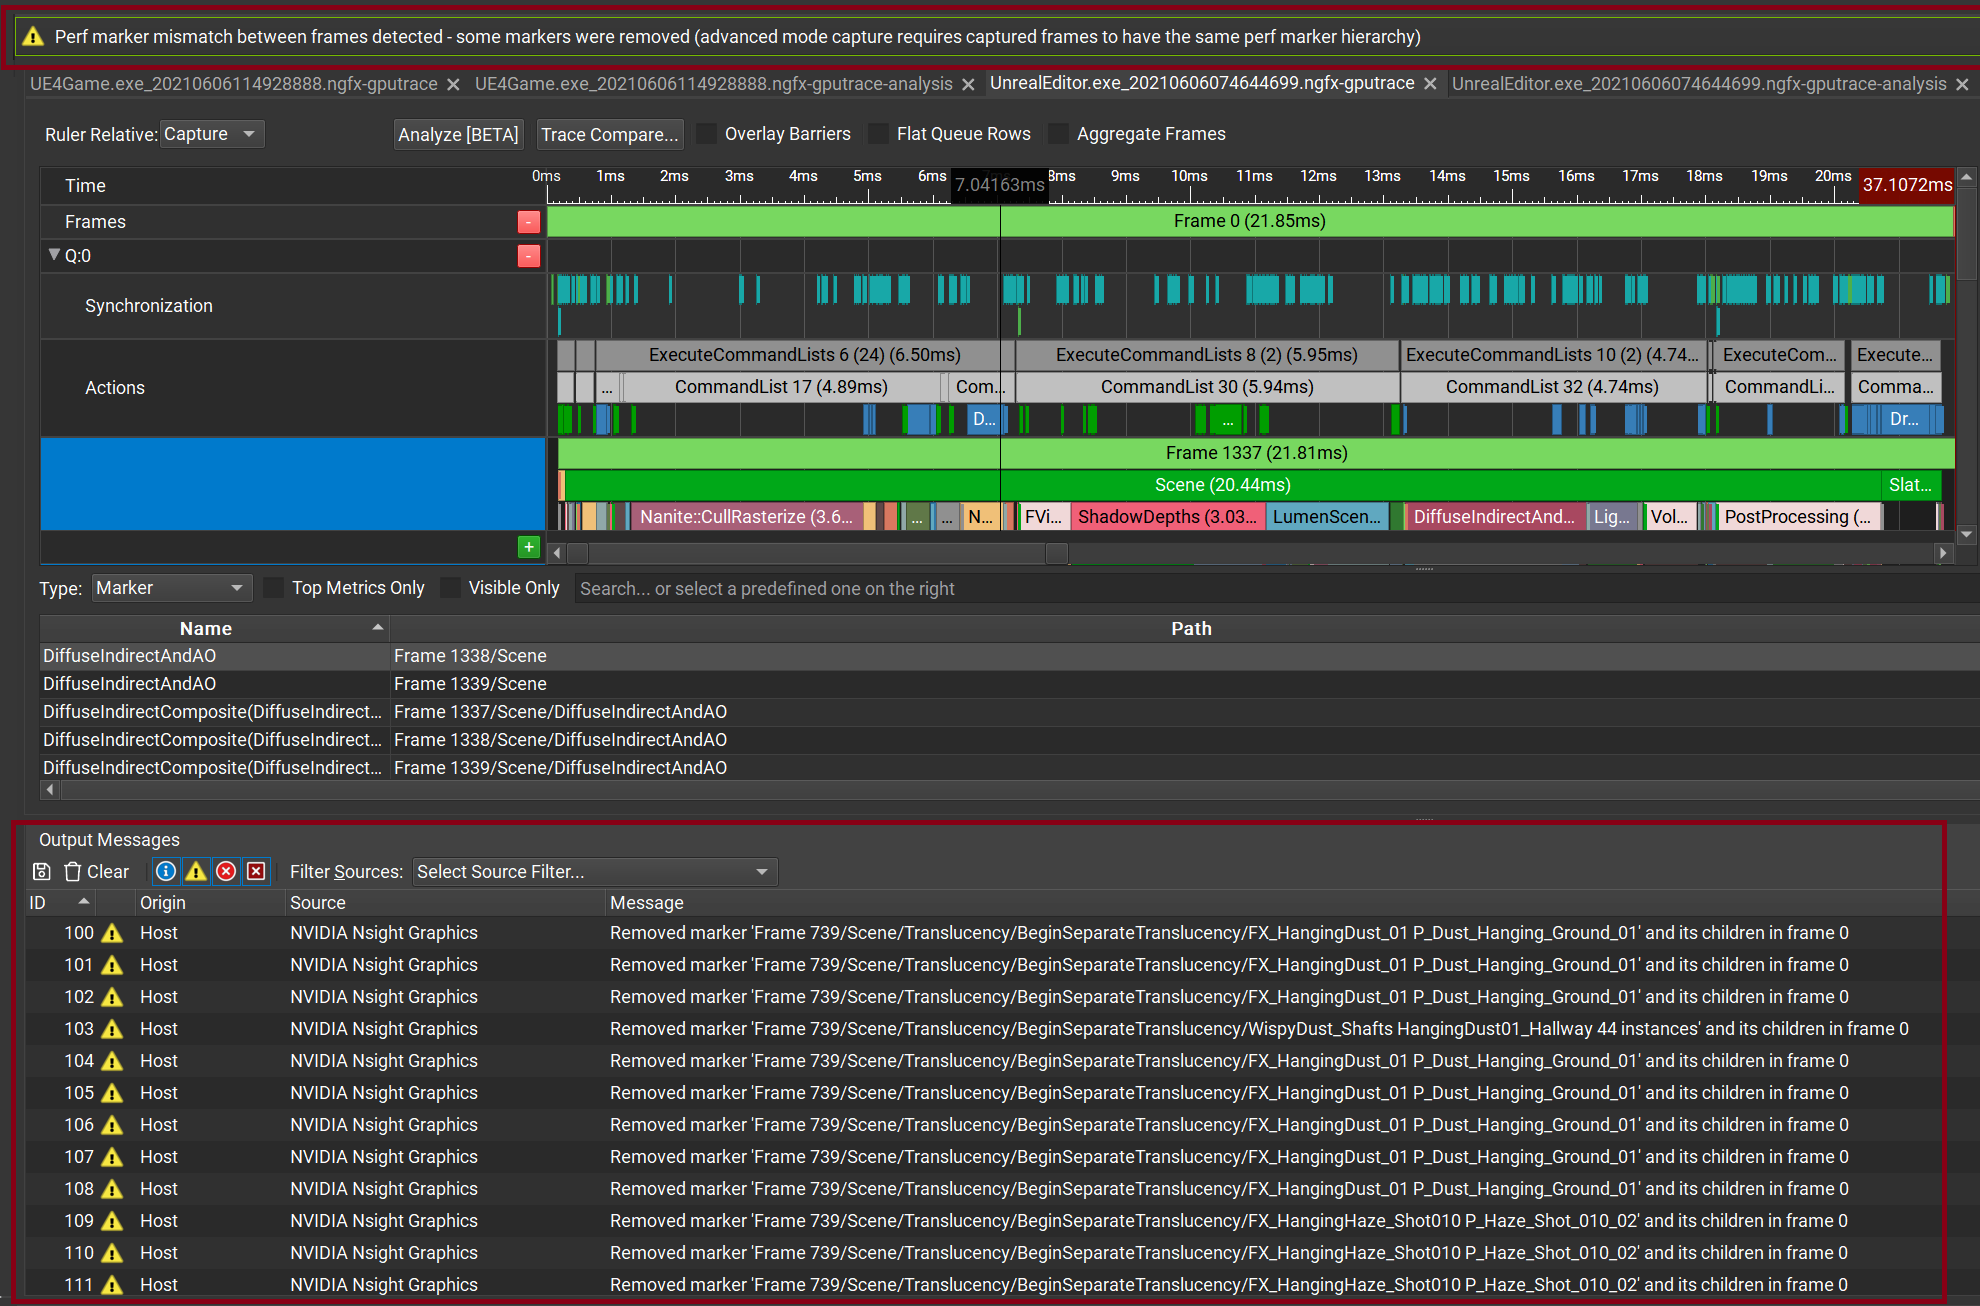
Markers matching algorithm:
The current marker matching heuristics have the following goals:
Generate valid timeline mapping for perfectly matching markers.
Deal with parameterized marker names (to some degree).
Put an emphasis on leaf marker matching (as those as typically used for performance analysis).
Mark markers which do not match as such, so they can be shown to the user as mismatched.
The current implementation handles the marker hierarchy bottom-up (compared to the previous approach, which was top-down), and is done in two phases:
Leaf markers matching
Parent markers matching
In addition, if multiple frames are traced per pass, the user optionally (on by default) uses “best-frame matching” (see below) to select the best matching frames from each pass (see below).
Markers name comparison:
When comparing marker names, the current heuristics trim any trailing numbers/spaces from the end of the marker names, and then perform the string comparison. This successfully deals with the Unreal Engine frame marker (“Frame N”) but fails for more complex cases.
Leaf Markers Matching:
For each queue, the algorithm collects a list of all the leaf markers (markers without child markers) of that queue, and for each one.
The algorithm considers leaf markers as matched if:
They have the same name.
They have the same number of parents.
All parent names are the same.
Parent Markers Matching:
After the leaf marker matching, the algorithm tries to match parent markers from the bottom up.
Parent markers are considered as matched if:
They have the same number of child markers.
All the child markers are matched.
Best Frame Matching:
To handle target applications which have workloads alternating in multi-frame cycles (e.g., executing a specific workload once every 2 frames) and improve marker matching chances in general, the best-frame matching logic was introduced.
This works when tracing multiple frames per pass with Multi-Pass Metrics, and results in the user having a single frame to view, which represents frames that match the most.
The algorithm operates as follows:
GPU Trace collects N>1 frames per pass with Multi-Pass Metrics.
When processing a pass, GPU Trace tries to match each frame from the first pass to each frame from the current pass and assigns a score to each frame-to-frame match, based on the total duration of matched markers (ending with NxN scores per pass).
The frame from the first pass that received the highest total score is selected, and used to build the timeline mapping by matching it with the frames from each pass which matched best against it.
To Activate “Best Frame Matching” go to Tools -> Options -> GPU Trace -> Multi-Pass Metrics.
Notes to be considered:
Note
The multi-pass metrics mode automatically traces consecutive frames. It is recommended to freeze the game if possible, or not move the scene throughout the entire process.
View Multi-Pass Metric data:
Note
To work with Multi-Pass Metrics, the target application should use user markers.
The additional counters which are being collected with Multi-Pass Metrics are presented in the summary and metrics tabs and the markers table.
Summary Tab:
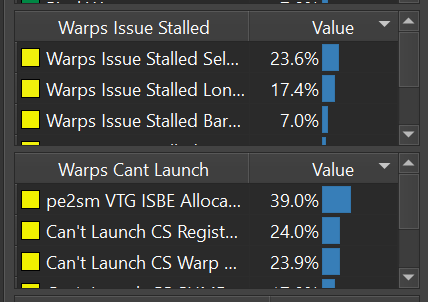
Metrics Tab:
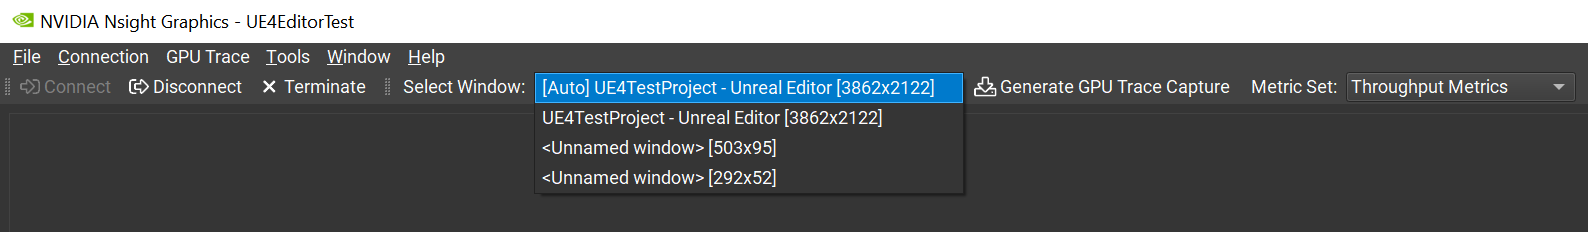
Profiling Applications with Multiple Windows#
It is possible to profile applications with multiple windows. When GPU Trace detects that there are multiple windows in the attached application, it automatically shows a drop-down menu where you can choose the windows you would like to profile. This enables profiling application from within editors:
Detect Interfering Processes While Profiling#
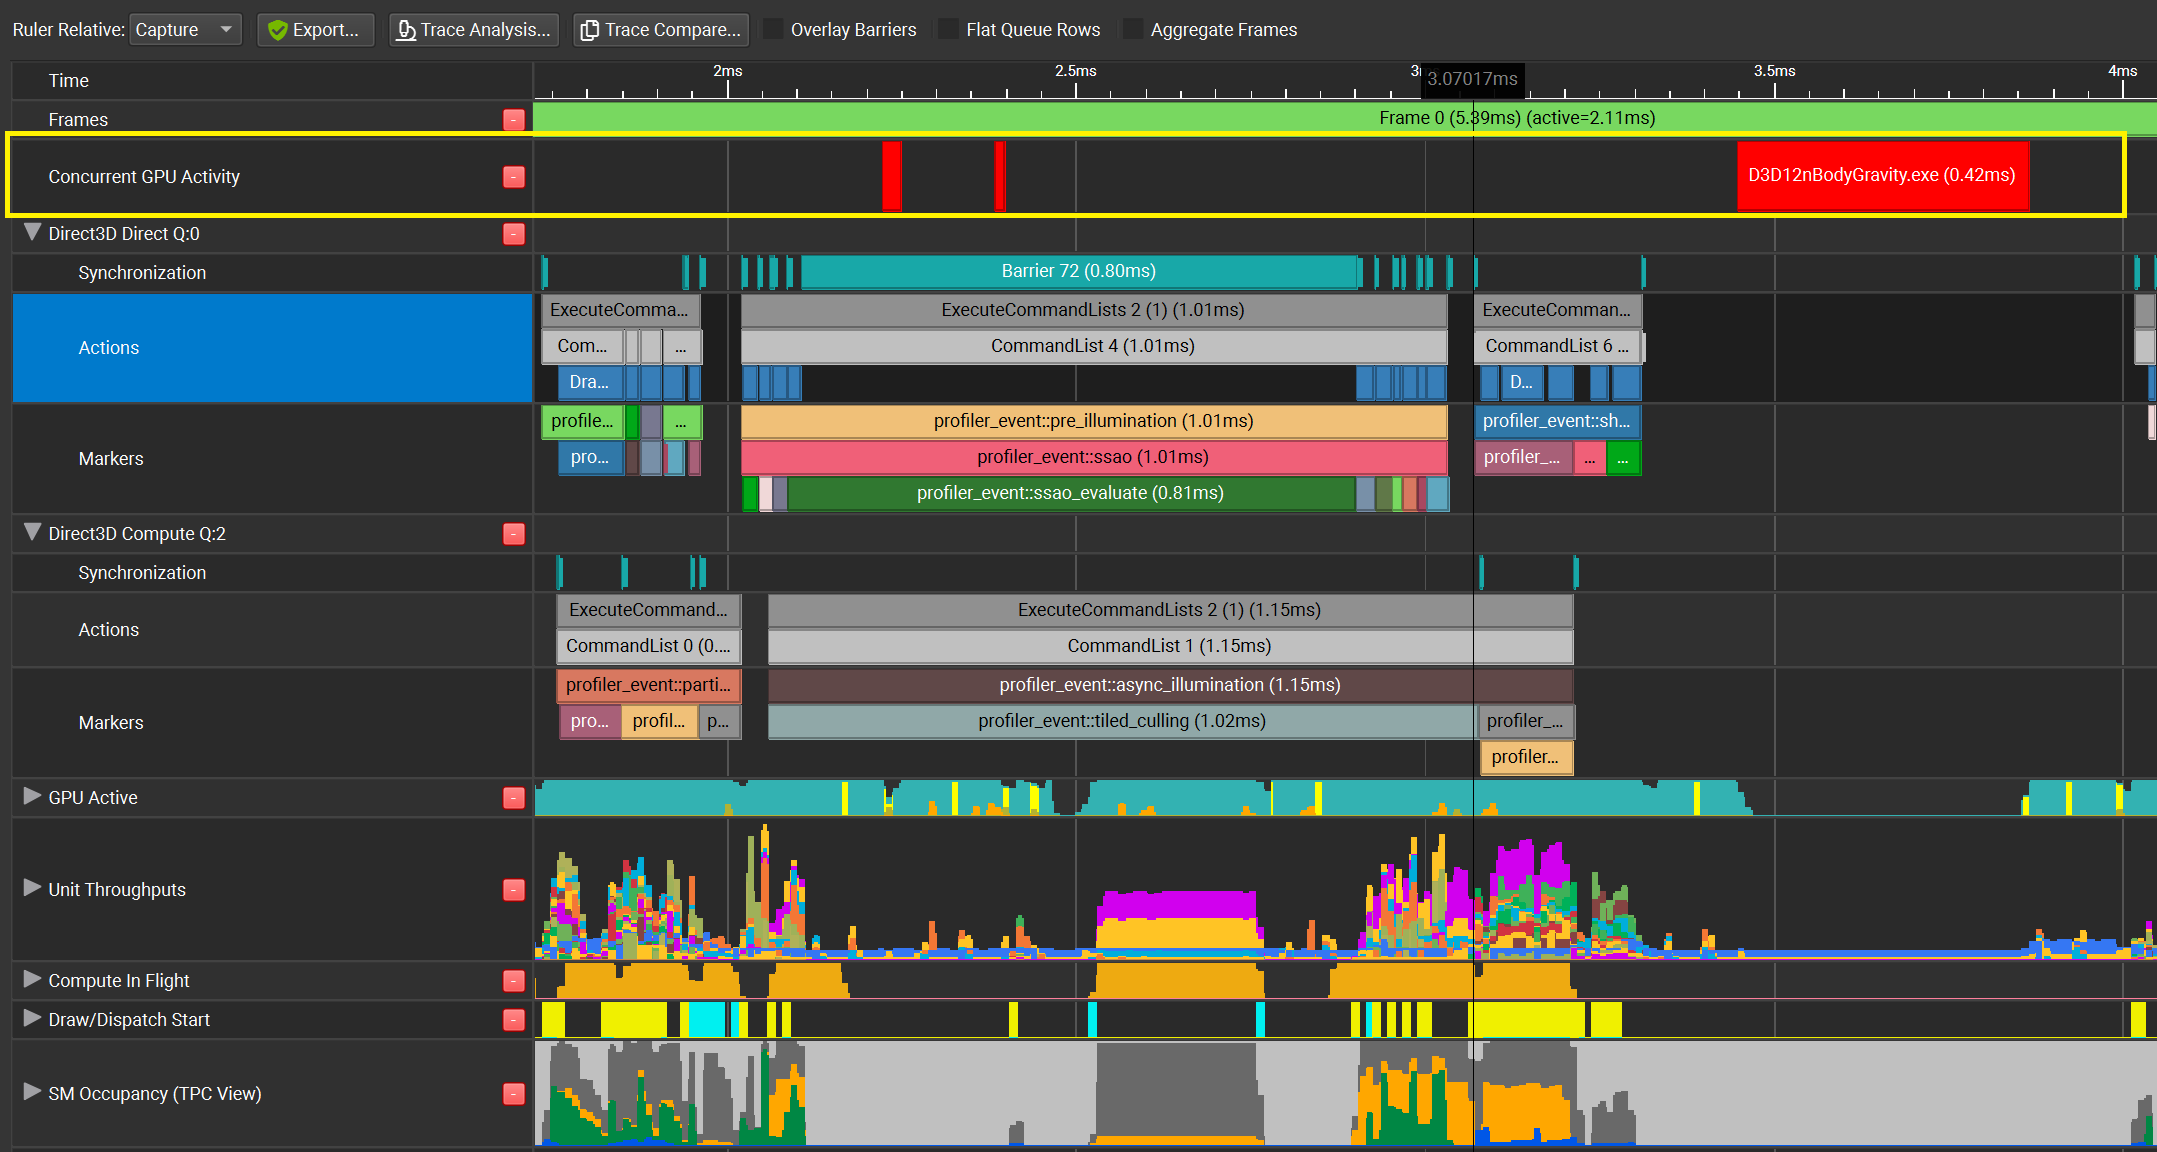
GPU Trace collects a performance trace of the GPU during a period that corresponds to the target application activity (whole frames for typical graphics applications). The assumption is that during that time, the GPU performance data represents work done solely on behalf of the target application. However, as the GPU is a shared device, the trace can contain workloads done on behalf of other processes, and this can affect the trace data and subsequent performance triage.
Some steps can be taken to minimize the chance of other processes interfering with the trace:
Run the target application on a dedicated test machine and do a remote trace
Close all other applications which might interfere (e.g., Outlook)
Run the application in full-screen mode
However, even with those steps, sometimes other processes can execute GPU workloads unexpectedly, such as the Windows Desktop Window Manager (DWM), and there is value in detecting these workloads and indicating them to the user in the trace.
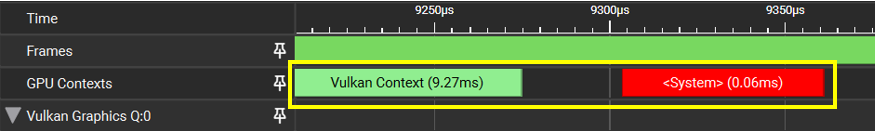
GPU Trace tries to detect if there was another process that used the GPU while profiling. If such a process was detected, this region is shown in the timeline.
You are able to see the process name to make sure to close it, or else you cannot rely on this range of metrics information for performance analysis.
Notes to be considered:
Note
This feature is currently limited to DirectX 12 on Windows and you must ensure that ‘Hardware-Accelerated GPU Scheduling’ is enabled for it to work properly.
Report Dialog#
The Report Dialog appears after you collect your first report and remains active for the rest of the current session. While open, it lets you easily track and manage all reports in the session.
The dialog contains:
Report List
User Comments
Transfer Progress & Status Log
Terminate Application and Open/Dismiss controls
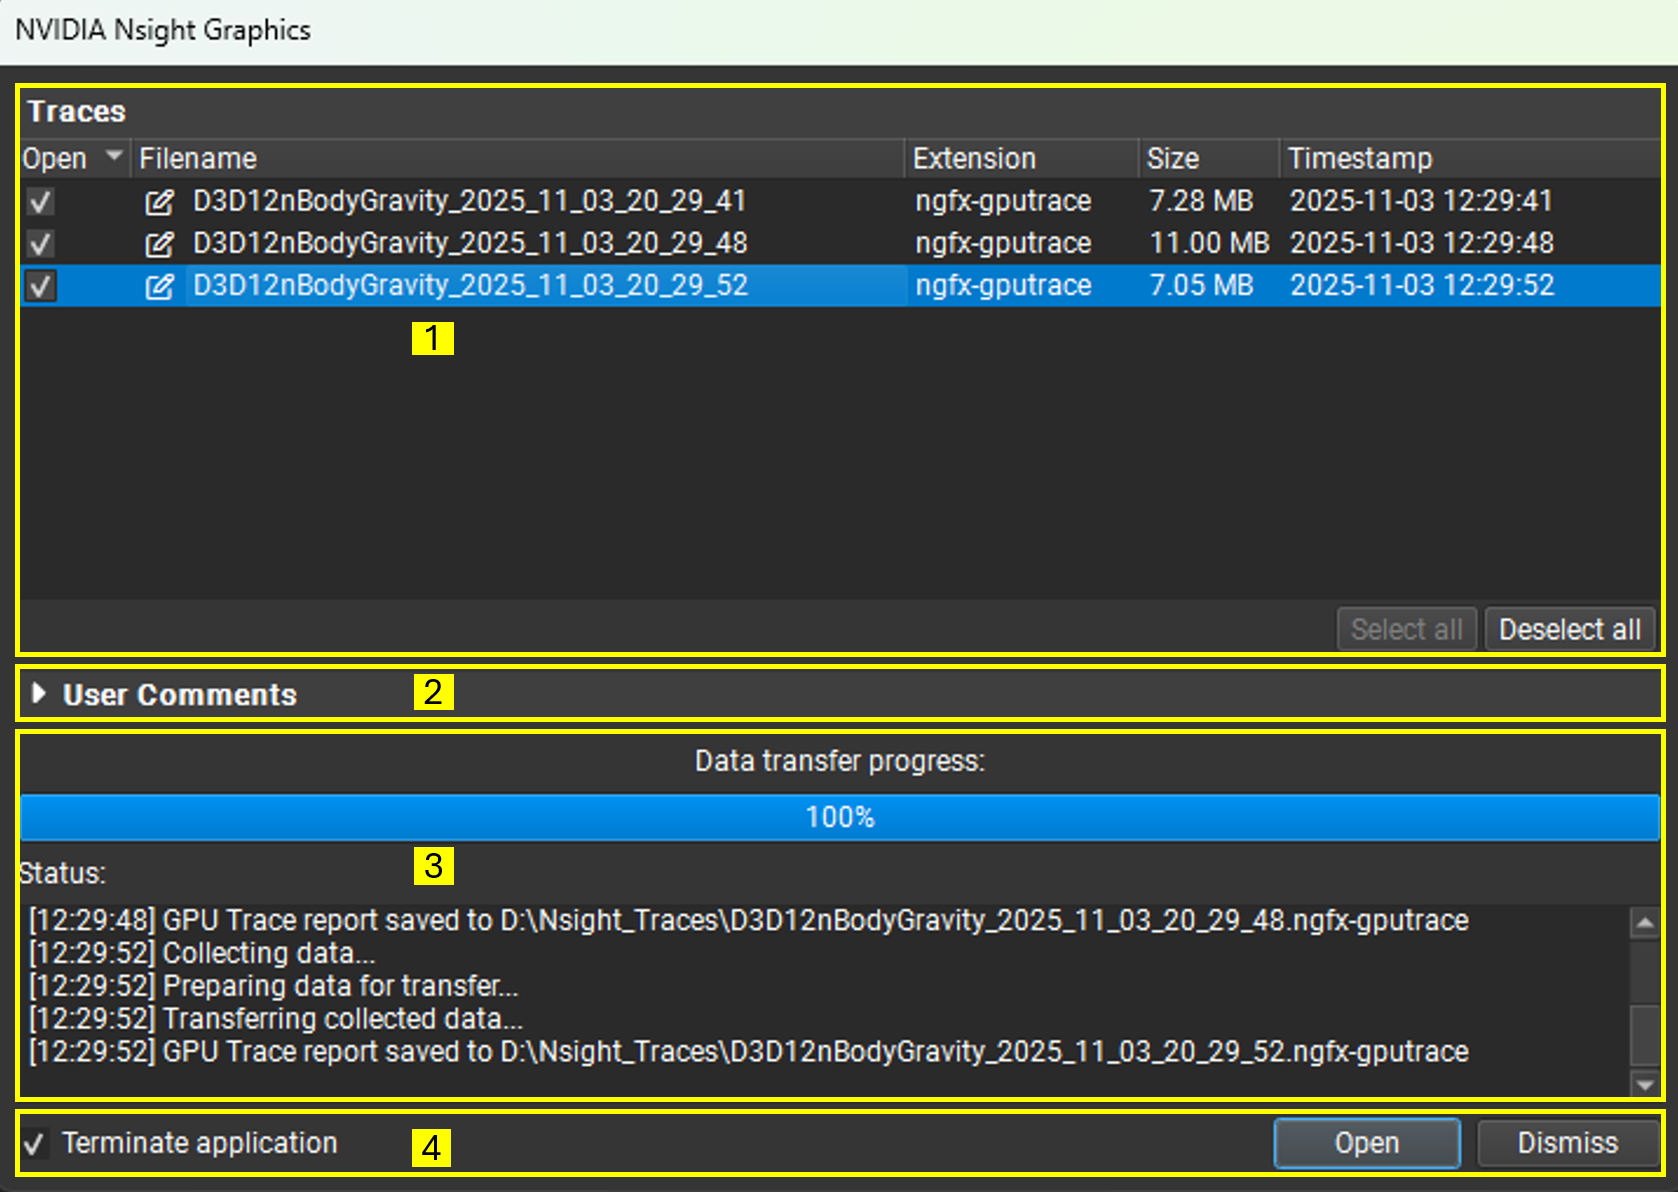
Report List#
At the top is a list of all reports collected in the current session, making it easy to track and manage them in one place.
Open: Select which reports are loaded when you click Open. Reports you don’t open remain available in Project Explorer.
Filename: Each report is given a unique default name. Rename by double-clicking the filename, using the context menu (Rename File), or pressing F2.
Extension: The report’s file extension.
Size: The report’s file size.
Timestamp: When the report was collected.
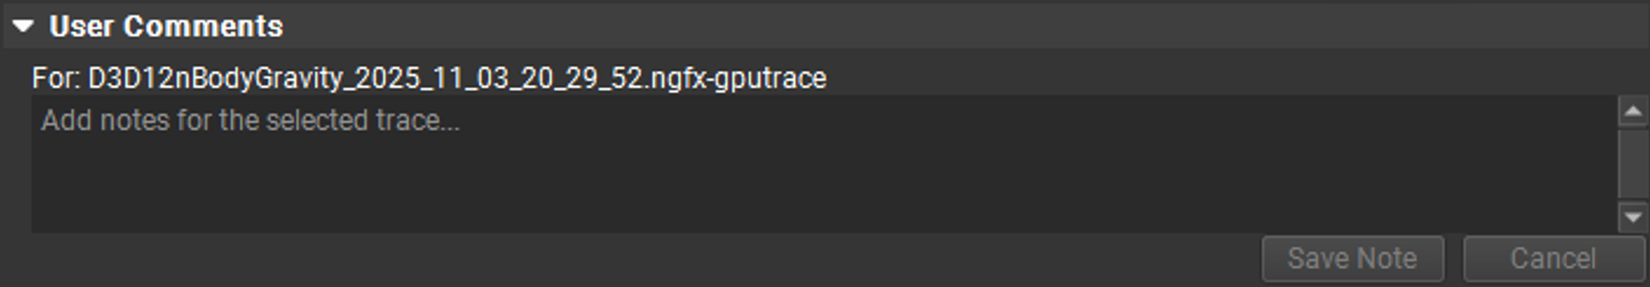
User Comments#
Below the list of reports is the User Comments section, which you can expand to add detailed notes that are saved with the report. After loading a report, you can view and update the saved notes under the Trace Information Tab. This is especially helpful when collecting multiple reports, allowing you to quickly capture the purpose of each one without losing focus.
Transfer Progress & Status Log#
This section shows the transfer progress for the current collection. The Status Log records all actions taken, including collected reports, renames, and any user comments added.
Terminate Application and Open/Dismiss#
Use Open and Dismiss to load selected reports or defer them. The Terminate application checkbox lets you decide whether to close the current application.