Troubleshooting#
Due to the complex nature of the underlying mechanisms that make arbitrary application analysis possible, there is the possibility of errors. Nsight Graphics offers a significant number of ways where you can discover opportunities to correct issues that you may encounter.
See the sections below for general tools as well as listings of common problems and possible solutions for them. Also, you may want to review known issues to determine if you are encountering an issue already known.
General Tools#
This section provides troubleshooting tips for Nsight Graphics.
Output Messages#
Throughout the operation of the tool, Nsight Graphics provides messages that inform on the status of operations, as well as if any issues are encountered. This could provide some assistance when trying to determine why your application may not run, connect, or capture correctly. Error messages are indicated by a red flag in the bottom right of the application window. This flag may be double-clicked to open the Output Messages window. Alternatively this window may be accessed via Tools > Output Messages.

Crash Reporting#
When an application crashes, or hangs, a crash report can be one of the most valuable pieces of information in helping to fix the issue. Accordingly, if you have the ability to send a crash report, it is greatly appreciated.
Automatic Crash Reports#
Nsight Graphics’ host and target are configured to automatically send crash reports when they encounter a crash. Submitting via the dialog is a good approach, but saving the minidump for explicit communication can be useful too.
Note
If you encounter a crash and do not have the option of sending a crash report, you may need to generate a crash report manually instead, as described below. One typical reason that crash reports might not be generated is if the application is configured with its own automated crash reporting that overrides the Nsight Graphics crash reporting mechanism.
Manual Crash Reports#
Manual crash reports are an effective approach to collecting information in case you are finding that automatic crash reports are not triggering. A process dump is collected by attaching to the crashing process with a debugger and manually creating a dump in the case of a crash.
Windows
A crash dump can be created by Microsoft Visual Studio. To accomplish this:
Start Visual Studio.
Follow the instructions for Debugging Your Application with a Debugger.
Start the application with Nsight Graphics.
Attach the Visual Studio debugger to it with “Debug > Attach To Process”
When you encounter a crash, use the Visual Studio “Debug > Save Dump As” menu option.
Linux
A crash dump can be created by GDB, the GNU Debugger. To accomplish this:
Start gdb.
Follow the instructions for Debugging Your Application with a Debugger.
Start the application with Nsight Graphics.
Attach gdb to it.
When you encounter a crash, use the “generate-core-file” command.
Next, while the process is still alive, use the core2md utility to translate the core file into a dump that can be consued by running:
core2md <core dump> /proc/<crash process ID>/ <minidump>The core2md utility can be found in the Nsight Graphics installation directory under
host/linux-desktop-nomad-x64.
Manual Hang Reports#
If the application encounters a hang, a process dump can be one of the most effective ways to identify the source of the hang. A process dump is collected by attaching to the crashing process with a debugger and manually creating a dump by following the instructions below:
Windows
A crash dump can be created by Microsoft Visual Studio. To accomplish this:
Start Visual Studio.
Attach the Visual Studio debugger to the hanging process with “Debug > Attach to Process”
Stop program execution by using the Visual Studio “Debug > Break All” command.
Generate a process dump using the Visual Studio “Debug > Save Dump As” command.
Linux
A crash dump can be created by GDB, the GNU Debugger. To accomplish this:
Start gdb.
Attach gdb to your process.
The process should stop after being attached to by GDB, otherwise press Ctrl + C to send a SIGINT to stop the process.
Generate a process dump using the “generate-core-file” command.
Next, while the process is still alive, use the core2md utility to translate the core file into a dump that can be consued by running:
core2md <core dump> /proc/<hang process ID>/ <minidump>The core2md utility can be found in the Nsight Graphics installation directory under
host/linux-desktop-nomad-x64.
Debugging Your Application with a Debugger#
Although launching your application with Nsight Graphics might appear to be an alternative to CPU debugging, the application that is launched is still very much a debuggable application. This can be useful to determine if a problem you are encountering is in your own code by tracing the paths taken by your application.
To do this, set an environment variable of NVIDIA_PROCESS_INJECTION_ATTACH_DIALOG=1 and attach a debugger when you see a message box. Click OK to resume your application once you have set breakpoints that will allow you to inspect if your application is following the expected paths.
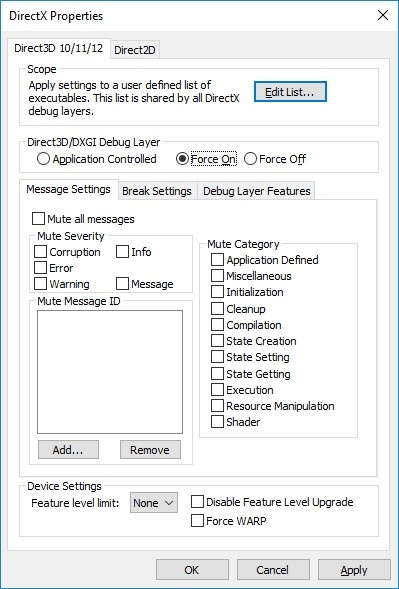
Collecting DirectX Debug Logging#
Sometimes a device lost or other issue can be narrowed by observing what the DirectX debug layer has to say.
If you need to install the layer, it should be part of the OS in Windows 10:
Apps & Features > Manage Optional Features > Graphics Tools
Open dxcpl, which should look like the below. Make sure your installed application is in the Scope List, and set the Direct3D/DXGI Debug Layer to Force On.
There are two ways to see the spew:
You can see logging without attaching Visual Studio by just running
DbgView.exe(https://docs.microsoft.com/en-us/sysinternals/downloads/debugview).Alternately, attach using Visual Studio. Logging will be in the Visual Studio Output window.
Setting an environment variable#
There are occasionally times where you might be asked to set an undocumented variable to help disambiguate problems.
Apply the environment variable in the connection dialog Environment setting when starting an application.
Common Problems#
Problem: Application Fails to Launch#
You’ve tried to launch your application, but it is failing to launch.
Possible Causes
Incorrect command line arguments.
Incorrect working directory.
You’re trying to launch on a remote machine that does not have the Nsight Monitor running.
Possible Solutions
Make sure that your command line arguments and working directory are as expected.
If you are trying to run on a remote machine, please ensure that the remote monitor is running and that the name of the machine is correct. See Remote Launching.
Disambiguate if the application is launching at all. Follow the instructions in Debugging Your Application with a Debugger. Check to see if your application is launched at all and if so, whether it is following its expected path. If the application doesn’t launch at all, please send an email to devtools-support@nvidia.com.
Problem: Application Crashes at Runtime#
You’ve found that your application appears to launch, but it crashes during runtime.
Possible Causes
Lack of API support by Nsight Graphics
Application not checking return codes from device/object creation, assuming it is successful
Interception-library crash
Internal-driver crash
D3D-debug runtime interaction
Possible Solutions
Try disabling the following features:
For D3D apps, try running without the D3D debug runtime enabled, as the debug runtime occasionally differs in behavior when compared with the release runtime.
If none of the above works, please try to collect a crash dump if possible and send it to devtools-support@nvidia.com.
Problem: Application Hangs at Runtime#
You’ve found that your application appears to launch, but it hangs during runtime.
Possible Causes
Multi-threading issue
HUD Issue
Possible Solutions
Try disabling the following features:
If none of the above works, please try to collect a process dump if possible and send it to devtools-support@nvidia.com.
Problem: Application Crashes during Capture#
You’ve found that you’re able to run the application successfully, but upon trying to perform a live analysis, the application crashes.
Possible Causes
Multi-threading issue
Out of memory
The application is tearing itself down due to a watchdog timeout
Possible Solutions
Try disabling the following features:
If you suspect a multi-threading issue (D3D’s runtime sometimes indicates this), try disabling multi-threaded capture.
If Nsight Graphics reports out of memory, try reducing the requirements of the application or try running with a more capable GPU.
If the application exits without any clear sign of a crash, the application could be tearing itself down. Please contact devtools-support@nvidia.com with your concern and we will investigate if there is any opportunity for deactivating the thread.
Problem: Application Hangs during Capture#
You’ve found that you’re able to run the application successfully, but upon trying to perform a live analysis, the application hangs. This hang sometimes appears as a white screen on the target application.
Possible Causes
The application is lazily presenting frames, preventing progress
Multi-threading issue
App is running in fullscreen mode
Possible Solutions
If the application is lazily presenting frames, it may prevent capture progress given that Nsight performs work on frame boundaries. If this is the case, try turning on the Force Repaint feature so as to force the application to present frames.
If you suspect a multi-threading issue, try changing the following feature to RenderOnly:
If none of the above works, please try to collect a process dump if possible and send it to devtools-support@nvidia.com.
Problem: Application Encounters an Incompatibility#
This problem arises when the application you are running is using API methods or patterns that are not supported by Nsight Graphics.
Possible Causes
An unsupported API method was used
An unsupported API pattern was used
Possible Solutions
When encountering this issue, Nsight Graphics presents a list of API methods or reasons that it has encountered as incompatible. This listing is listed alongside an explanation of the reasons why Nsight Graphics has prevented capture, which include application crashes, incorrect data, etc. Because Nsight Graphics is a replay-based debugger, the absence of methods may lead to critical issues as replay is attempted. In some cases, however, the missing methods are innocuous and replay may proceed correctly without them. When capturing through the host, Nsight Graphics offers the user an opportunity to capture despite these incompatibilities. From this point, it is up to the user to determine if the data is meaningful.
When encountering an incompatibility, we recommend that you communicate this incompatibility to devtools-support@nvidia.com so that the Nsight Graphics development team may track this issue and determine if it is something that will be supported in the future.
Note that if you wish to ignore all incompatibilities on every run, and wish to accept the possible errors that come with it, you may set the option of ‘Troubleshooting > Ignore Incompatibilities’ to accomplish that.
Problem: Application Captures Successfully, but Exits after a Time in Capture#
This problem indicates that you have had some level of success, but even if the application generally inactive, the application crashes.
Possible Causes
Serving a host query leads to a crash
Memory leak
Watchdog timer
Possible Solutions
When encountering this issue, take note of what you are doing when you encounter it. The first thing to try is doing nothing – does the application still crash when doing so? If there is nothing going on, this is either a memory leak or a watchdog timer.
Look at the memory usage of the process – is it growing? It’s a memory leak, either from the application or the tool.
Set a stopwatch to count how long it takes to crash – is it a “round” number like 30 or 60 seconds? It’s probably a watchdog.
If this is a memory leak (uncommon but possible) please contact support to help identify the issue.
If this is a watchdog issue, disable the watchdog in your application.
Problem: Application Runs Extremely Slowly#
You’ve observed that the application runs at a significantly lower rate than normal operation.
Possible Causes
Too much work is being done.
The application may be exercising uncommon paths.
Possible Solutions
Try disabling optional features, such as collecting shader source, collecting native shaders, or collecting hardware performance metrics.
Problem: D3D12 Replayer Shows More CPU Overhead than Expected#
If you encounter more overhead in your generated C++ capture, conservative synchronization may be the problem.
Possible Causes
Nsight Graphics’ default fence syncing policy may be too conservative for this application.
Possible Solutions
Try experimenting with replay fence behavior.
Problem: I Can’t Capture a Vulkan Application#
If you find that the button to Capture for Live Analysis is disabled, or you do not see a message that your application has Nsight Graphics analysis enabled, the Nsight Graphics Vulkan layer may not be enabled. This symptom is often accompanied by an error in the Output Messages window, so look for errors in that window for an indication of the failure.
Possible Causes
The Nsight Graphics Vulkan layer configuration has been removed from your system configuration.
Possible Solutions
One workaround is to re-enable the Nsight Graphics Vulkan layer explicitly. To do this, follow the steps for your system:
Windows
Run <install directory>/host/windows-desktop-nomad-x64/VK_LAYER_NV_nomad.bat
Linux
Check the existence of vulkan manifest file (.json) under <install directory>/target/linux-desktop-nomad-x64/NomadVulkanLayer/vulkan/implicit_layer.d/.
Delete any dangling manifest of uninstalled Nsight Graphics in
~/.local/share/vulkan/implicit_layer.d.If you still see the issue after above steps, then it could be an Nsight Graphics bug and please report it to us. Meanwhile, one possible workaround is to add environment variable at the “Start Activity” dialog: XDG_DATA_DIRS=<install directory>/target/linux-desktop-nomad-x64/NomadVulkanLayer
If, after repeating the steps, you find that your system still cannot capture, gather a log of the output of the vulkaninfo application from the Vulkan SDK and send it to devtools-support@nvidia.com.
Problem: I Can’t Attach to the Application#
The application launches, but you are unable to attach to it with the Nsight Graphics host.
Possible Causes
You launched a piece of the process hierarchy without Nsight Graphics.
You set the connection to automatically attach when the root application launches child processes that are the actual processes of interest.
The application is interfering with the interception of Nsight Graphics, preventing it from intercepting.
The application is using a software renderer.
Possible Solutions
Nsight Graphics is essentially an in-process debugger, so it cannot attach to an application that wasn’t originally launched through Nsight Graphics. The attach feature is meant to be used to attach to applications that have been launched through other means (e.g., a command line launcher), as well as to allow for some recoverability in the case of a host issue, as it allows you attach at a later time.
Make sure to kill any processes related to the process hierarchy of an application and try to launch it again.
Problem: The Host UI Crashes#
The host UI crashes while you are analyzing an application.
Possible Causes
UI Bug
Possible Solutions
Try reducing the number of views that you have open when running to pinpoint which view causes the issue.
If at all possible, try to collect a crash dump of the UI application and send it to devtools-support@nvidia.com.
Try deleting the UI persistence data with Help > Reset Application Data.
Problem: The Target Window Blocks the Host Window#
While running a live analysis, you find that the target window is blocking the host window and interfering with the analysis you wish to perform on the host. This is most often reported on machines that do not have access to multiple monitors.
Possible Causes
The application has fullscreen settings.
The application has a topmost flag set to keep the application on top.
Possible Solutions
We suggest running without fullscreen or topmost settings. If fullscreen-like behavior is desired, many applications support a borderless window mode.
If you must analyze an application with these characteristics, and you do not have access to a second monitor, the virtual desktop or workspaces support on most modern operating system shells presents an effective path forward. Creating one desktop for the target application and one for the host often avoids the target from interfering. For more information on using these features, see one of the articles below.
Note
If you wish to suppress the dialog that reports replay window interference, set an environment variable of NSIGHT_REPORT_REPLAY_WINDOW_INTERFERENCE=0 .
Linux/Gnome: https://help.gnome.org/users/gnome-help/stable/shell-workspaces.html.en
Problem: Force-failed QueryInterface is Reported#
It is possible that applications attempts to QueryInterface for types that Nsight Graphics does not know about or understand. To avoid crashes, incorrect rendering, or bad data with these unknown types, Nsight Graphics reports a force-failed QueryInterface warning. After reporting this warning, Nsight Graphics nullifies the result of this QueryInterface call and return E_NOINTERFACE to report that this interface is unsupported.
Possible Causes
Using an older version of Nsight Graphics against an application that uses newer runtime capabilities.
Using multiple tools that intercept the application at one time.
Lack of API support by Nsight Graphics.
Possible Solutions
When this issue is encountered, it is recommended that you first attempt to understand what the source of the incompatibility is. Nsight Graphics attempts to print out the source and target types in the QueryInterface call. When the target is unknown, however, this type is printed out as a GUID.
In some cases, the failure may be apparent, and you might be able to do a text search to determine where your application is making this problematic QueryInterface call. If that is too difficult to find, you may also try Debugging Your Application with a Debugger and setting a function breakpoint on MessageBoxA before running the application, which reports the call stack in which Nsight Graphics performs the report.
If you are unable to workaround this type support, you may attempt to set an environment variable to suppress this force-failed query. Note that this is not guaranteed to fix all concerns, and may result in future unspecified failures, but it is available as a possibility for working around problems. The environment variable of NSIGHT_PASSTHROUGH_UNKNOWN_GUIDS is a comma-delimited list of GUIDs to allow to passthrough without a force-failure. GUIDs must be fully specified with a brace syntax, as in NSIGHT_PASSTHROUGH_UNKNOWN_GUIDS={5b746c30-24e2-4385-81f6-39f7a068945b}.
If you suspect that the type being reported should be supported by Nsight, please send a report to devtools-support@nvidia.com to ask for assistance.