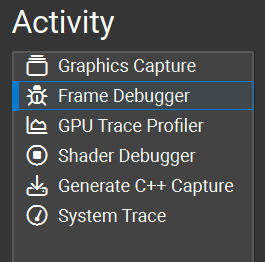
Frame Debugger Overview#
The Frame Debugger activity allows for:
Real-time examination of rendering calls;
Interactive examination of GPU pipeline state, including visualization of bound textures, geometry and unordered access views;
Pixel History shows all operations that affect a given pixel;
Shader profiling to explore shader performance;
C++ Capture exports for offline collaboration and analysis.
When to use the Frame Debugger Activity#
The Frame Debugger activity offers a comprehensive set of tools for discovering problems with your application’s rendering or general operation. This activity enables the inspection of events, API state, resource values, and dependencies to understand where your application might have issues. Use this activity when:
You have a render-accuracy issue.
You expect that you may have a synchronization issue.
You want to explore the performance of your application shaders (DX12 and Vulkan).
The Frame Debugger activity supports all APIs that are generally supported by Nsight Graphics.
Basic Workflow#
To start this activity, select Frame Debugger from the connection dialog.

The basic workflow for the Frame Debugger activity is to capture an application and then navigate the events, data, and resources that your application is submitting/using to identify your issue.
Whether you are debugging on the CPU or GPU, the first step of any debugging process is to narrow in on the set of data that you need to analyze to understand your problem. Generally, this means that you will want to scrub to a particular event of interest in either the Scrubber or the Event Viewer. Because Nsight Graphics™ shows you the rendering contribution of every draw call, looking at either the HUD or the Current Target View gives you an indication of where your rendering might be going wrong. Another alternative is to use the Pixel History experiment to automatically identify the draw calls that relate to a particular texture update.
From there, you want to use your knowledge of the graphics pipeline to try to understand what might be causing a problem. Some questions to ask yourself:
Is this a geometry problem? If so, is it a pre-transform or post-transform problem?
Is this a blending problem?
Is this a synchronization problem?
In some cases, there may be a combination of problems that exacerbate a given problem. Isolating the symptoms can be challenging, but an effective use of the tools can offer increased confidence that you are heading in the right direction.