GPU Trace Overview#
The GPU Trace Profiler activity runs a low-level profiler that can be used for developers to optimize application for NVIDIA Turing and above hardware. It runs on live applications and captures GPU Units’ utilization throughout frame execution. The GPU Trace report may help detect bottlenecks in the GPU Pipeline, as well as areas where your application is under-utilizing the GPU.
When to Use the GPU Trace Profiler Activity#
The GPU Trace activity provides detailed performance information for various GPU Units.
Use this activity when:
You wish to understand the GPU Units’ utilization and search for throughput bottlenecks.
You wish to understand how synchronization objects across queues are being executed.
You would like to search for opportunities where your application is under-utilizing the GPU.
You suspect your engine would benefit from asynchronous compute.
The GPU Trace activity currently supports profiling applications on NVIDIA Turing architecture and above.
System Setup#
The target system must be configured to allow performance metrics collection by GPU Trace. Please see documentation at this link for a guide on how to do this.
Memory Requirements#
GPU Trace allocates memory for a variety of purposes to deliver highly detailed profiling reports. The total memory required for a given workload is determined by factors such as the complexity of the scene being traced, the duration of the trace, and the amount of data collected per unit of time. All of these factors are configurable from the activity window before you launch your application.
While the default settings are suitable for most workloads, GPU Trace will report if a trace exceeds the allocated memory for any category. If your system has additional memory resources available, you can increase the memory allocation for the relevant category and attempt the trace again. In situations where resources are limited, you can choose to either shorten the trace duration or reduce the amount of data collected for the same duration.
For a comprehensive breakdown of all the memory allocation categories in GPU Trace, refer to the sections below.
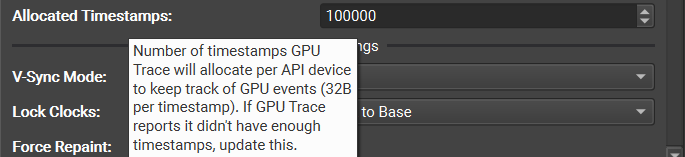
Timestamps#
GPU Trace uses timestamps to construct a detailed timeline of GPU events which allows you to see for example when each draw or dispatch event occured and how long it took to complete. In order to record this data, GPU Trace allocates memory to record each timestamp. By default, GPU Trace allocates enough memory to store 100,000 timestamps per API device, which is plenty for most workloads. However, for cases where there was not enough timestamps, GPU Trace will report that it ran out, allowing you to increase the number of timestamps and try again.
To learn more about how timestamps are used by GPU Trace, see Timeline: Frames Data and Per-Queue Events
PC Samples and Metrics#
Nvidia GPU’s allow GPU Trace to collect a detailed set of data with minimal overhead that can be used to understand how the GPU hardware is being utilized during the execution of the traced region. The amount of memory that is able to be allocated to record all this data has a fixed upper limit of ~4GB. Given this contraint, there are several settings available in the activity window before you launch your application that allow you to configure the usage of this memory. For example, you can collect data at a higher rate over a short period of time or alternatively you can less data over a longer period of time. A summary of the relevant settings are shown below:
Max Duration (ms): The maximum trace duration, with the actual trace duration being the minimum of this and the ‘Limited To’ setting.
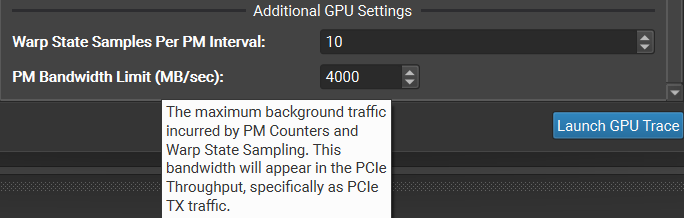
PM Bandwidth Limit (MB/s): The maximum amount of data per unit time given the max duration and memory constraints.
Warp State Samples Per PM Interval The final sampling rates are based on the number of samples per SM.
To learn more about these settings and others before you launch your application and for how GPU Trace uses this data, see Basic Workflow and Timeline: Metrics Graphs
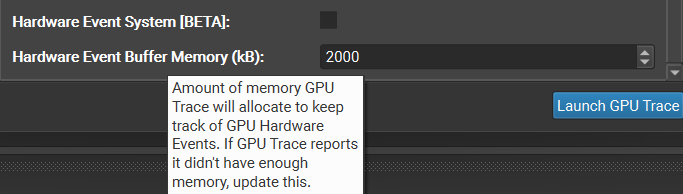
Hardware Events#
Note
This feature is only available on the latest Nvidia Blackwell GPUs and provides a new Compute timline row.
Hardware events provide GPU Trace with more detailed timing information for various types of events, including more accurate compute start and stop timestamps. Enabling Hardware Events does increase the total amount of memory that needs to be allocated in order to record all the events that are collected. The specific allocation size can be adjusted under the ‘Additional GPU Settings’ section. If GPU Trace reports that it ran out of memory to record all events, you can try increasing this setting and try re-tracing.
See Compute Row for more details.
GPU Trace will report when it was not able to record all of the events due to running out of memory. As with all the other settings, you can you adjust the amount of memory allocated for hardware events and try re-tracing.
Shaders#
In order to profile your shaders, GPU Trace needs to collect additional data from your shaders and pipeline state objects. In the activity window, under ‘Misc Settings’ the Collect Shader Pipelines and Collect External Shader Debug Info are two settings that control whether or not GPU Trace collects this additional data.
The Collect Shader Pipelines option allows GPU Trace to populate additional views with information about your PSO’s and shader source code.
Note
The Collect Shader Pipelines option is required when Real-Time Shader Profiler is enabled.
Additionally, the option Collect External Shader Debug Info allows GPU Trace to try and resolve debug information for shaders that do not contain embedded debug information. Any debug information that is found is then included in the trace report. You can also resolve missing debug info later when loading the trace report, see Search Paths to learn how.
See Shader Profiler for more information.
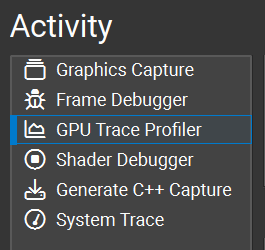
Basic Workflow#
To start the activity, select GPU Trace from the connection dialog.
Set up your application for connection (see How to Launch and Connect to Your Application for more information.).
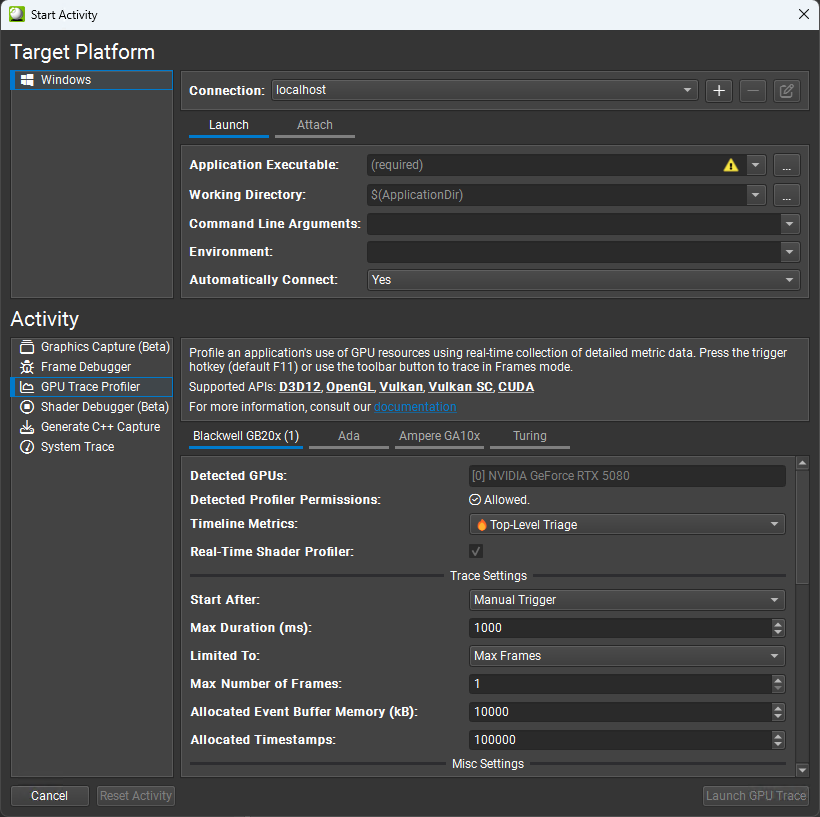
Specify a Start After condition. This parameter defines how and when the trace is started and are all mutually exclusive.
Manual Trigger: Specifies that the trace is manually triggered by the user through the host application or the Target application trigger hotkey on the running application.
Frame Count: The trace automatically starts after a select number of frames have elapsed. Frame boundaries are defined based on presents. If set to 0, tracing starts on the first present.
Submit Count: The trace automatically starts after a select number of submits have been performed. If set to 0, tracing starts on the first submit.
Elapsed Time: The trace automatically starts on the first present or submit call that occurs after the specified amount of time has elapsed on the CPU since the first present or submit call. If set to 0, tracing starts once data collection is ready.
Enable Real-Time Shader Profiler if you want source-level shader performance to be revealed per ~10 usec interval in the Top-Down Calls table and other shader profiler views. Shader performance is collected via a high-speed sampling profiler in the SM hardware, which incurs no shader execution overhead at runtime, and only consumes PCIe TX bandwidth (along with perf counters). When disabled, a more detailed list of SM and L1TEX perf counters is collected. This setting is compatible with Timeline Metrics with a ‘fire’ icon. Requires ‘Collect Shader Pipelines’ to be enabled. This feature is available on NVIDIA Ampere GA10x and newer architectures.
Specify a Max Duration for the trace. This parameter defines maximum duration of the trace on the target application.
Specify a Limited To condition. This parameter specifies if the trace should be limited to other events than the maximum duration. This parameter also has impact on when the trace starts after the Start After condition has been met.
Max Frames: The trace is limited to a set number of frames in addition to the max duration. Specifying this causes the trace to contain frame delimiters on the timeline. The trace starts at the beginning of the next frame once the Start After condition has been met.
Max Submits: The trace is limited to a set number of submits in addition to the max duration. The trace starts on the the next submit once the Start After condition has been met.
None: The trace is only limited by the max duration. The trace starts on the the next submit once the Start After condition has been met.
Note
GPU Trace consumes a lot of memory, especially in complex frames. You need to make sure that by collecting a large duration, there is enough memory to gather it all. See Memory Requirements to learn about how GPU Trace allocates memory and ways in which you can configure those allocations to suite your specific needs.
Example: |
Starting the trace after a manual trigger may be useful when profiling interactive applications. It makes it possible to interact with the app between traces in addition to allowing traces to be triggered at arbitrary points in time. |
Example: |
Automatically starting the trace after a select number of submits may be useful when profiling non-interactive applications. The trace will be automatically triggered without any manual action required by the user. |
Launch or attach to your application. (See How to Launch and Connect to Your Application for more information.)
Once the application is running, various indicators will appear inside the application window, in the GPU Trace target HUD.
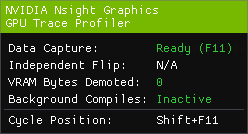
Data Collection: Indicates the current state of the data collection:
Initializing: The target is initializing.
Not Available: Tracing is unavailable, possibly due to an error, or the application is not running on an NVIDIA GPU.
Ready: The target is ready, waiting for the user to trigger it.
Waiting: The target is ready, waiting for the start conditions to be met.
Tracing: The target is in the process of collecting data.
Independent Flip (Windows only): Indicates whether the optimal presentation path on Windows (I-Flip) is currently taken or not. I-Flip is available in full-screen-exclusive mode, or in windowed mode when the GPU+driver supports Multi-Plane Overlay (MPO).
Cycle Position: Indicates the current hotkey that cycles the position of the HUD. Can be used to change the position of the HUD if it hides important parts of the application.
d. Background Compiles: Indicates the current state of background shader compilation in the graphics driver. If you’re attempting to profile a stable scene (unmoving camera), waiting for background compiles to reach an Inactive state will yield more stable and representative performance numbers.
Inactive: No background shader compiles are in progress.
Active: Background shader compilation is in progress.
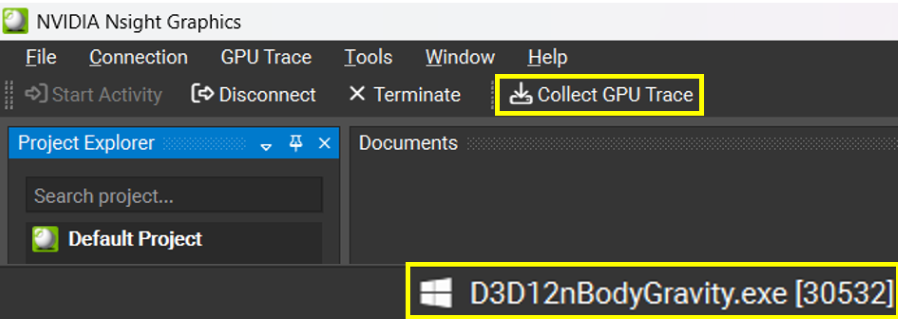
If the application successfully connected, the process name will appear in the lower-right corner of the window. If you configured the trace to start after a Manual Trigger then you can collect a new trace by clicking the Collect GPU Trace button or by pressing the Target application trigger hotkey on the running application. If you configured the trace to start automatically after a given condition is met, then wait for the collection to complete.
Note
GPU Trace collects all GPU activity. Therefore, it is preferred that you run the application on a remote machine and/or turn off all other applications while capturing.
Note
For best accuracy, it is recommended that you run your application in full-screen mode, wait for Independent Flip to be engaged (Windows only), and turn off V-Sync. You can turn V-Sync off from your application or set V-Sync Mode to Off in the activity dialog (this is the default option).
Note
By default, GPU Trace will lock the GPU clock to base before capturing. This methodology is recommended so consecutive reports will be comparable.
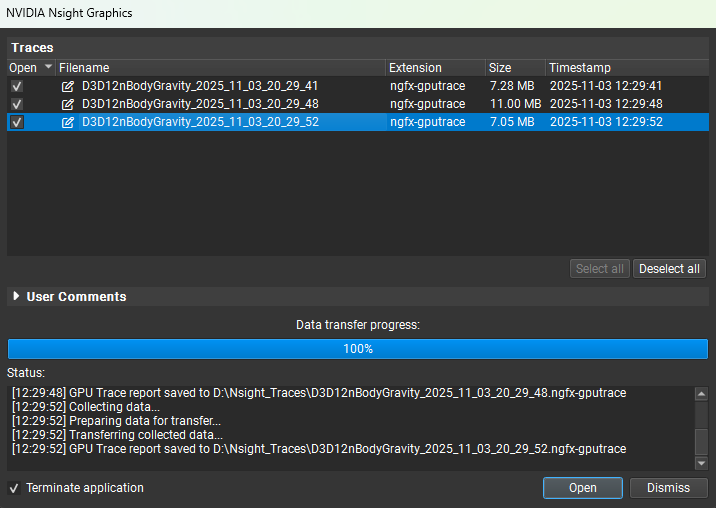
After a trace is collected, a popup will appear that allows you to manage all your reports for the current session, including the ability to select which reports to open and optionally terminate the application. To learn more, see Report Dialog.
Note
It is recommended that you close the application after collection, in order to free up your system’s memory while exploring the report.
How to Interpret a Report#
When interpreting a report, reference the GPU Trace UI section for information on how to interpret each of the pieces of information that is provided. Things to consider:
Am I GPU bound?
Am I using asynchronous compute?
Do I have opportunities for asynchronous compute?
What workloads are taking the most time?
Is my occupancy low for these workloads?
If you determine that you have opportunities for asynchronous compute and you are not currently using (or achieving) async compute, you may want to investigate your engine to understand where or how you can achieve it.
If you determine that you have expensive workloads with low occupancy, you should analyze your shader for opportunities to reduce work or reduce register/memory usage to allow for more occupancy.
Generate GPU Trace Capture from a Command Line#
To understand how to generate GPU Trace capture, start by launching the CLI with the --help-all argument. This will display all available options the CLI has.
The CLI can launch an application for generating GPU Trace capture in the form:
ngfx.exe --activity="GPU Trace Profiler" [general_options] [GPU_Trace_activity_options]
See CLI Arguments Details for the general options details, the GPU Trace activity options:
Option |
Description |
|---|---|
|
Wait arg frames (where each frame is defined as a present) before starting GPU trace. If set to 0, tracing starts immediately and does not wait for the first present to start counting. Mutually exclusive with other start options. |
|
Wait arg submits before generating GPU Trace capture. Mutually exclusive with other start options. |
|
Wait arg milliseconds after the first submit before generating a GPU Trace capture. Mutually exclusive with other start options. |
|
The trace is expected to be triggered by pressing the Target application capture hotkey on the running application. If enabled, the options about waiting in frames/seconds would be ignored. |
|
The maximum duration of the trace in milliseconds. |
|
Trace a maximum of arg frames (also limited by duration). Mutually exclusive with other limit-to options. |
|
Trace a maximum of arg submits (also limited by duration). Mutually exclusive with other limit-to options. |
|
The amount of event buffer memory (kB) to allocate per API device. |
|
The amount of memory (kb) to allocate for recording hardware events. |
|
Automatically export metrics data after generating GPU Trace capture. |
|
How many frames (1-15) to capture (may be limited by memory availability). |
|
Path to a json file that contains per architecture configuration. The file should be structured as a top-level array containing objects that specify “architecture,” “metric-set-name” or “metric-set-id”, and “multi-pass-metrics”, for example: [
{
"architecture": "Turing",
"metric-set-name": "Throughput Metrics",
"multi-pass-metrics": "true"
},
{
"architecture": "Ampere GA10x",
"metric-set-id": "0"
}
]
NOTE: The available architectures and metric sets can be found in the help message ( |
|
Select which architecture the arch-specific options configure. NOTE: The available architectures can be found in the help message ( |
|
Select metric set index to use with the given architecture. NOTE: The available metric set indices (and the corresponding metric set names) can be found in the help message ( |
|
Select metric set name to use with the given architecture. NOTE: The available metric set names (and the corresponding metric set indices) can be found in the help message ( |
|
Enable Multi-Pass Metrics, which will collect additional data over multiple passes. |
|
Lock GPU clocks during trace, available options: - unaltered - base - boost |
|
By default, VK_PIPELINE_COMPILE_REQUIRED is forcefully returned for pipelines being created that reference shader modules through identifiers from VK_EXT_shader_module_identifier. Disabling this setting while using VK_EXT_shader_module_identifier may lead to shader source correlation being absent for shaders modules using identifiers. |
|
Forcefully disables the D3D12 debug layer, even if the application requested for it to be enabled. |
|
Forcefully enables the D3D12 driver to perform background optimizations on shaders even if it detects that the additional CPU overhead may impact the application framerate. This is analogous to calling ID3D12Device6::SetBackgroundProcessingMode with D3D12_BACKGROUND_PROCESSING_MODE_ALLOW_INTRUSIVE_MEASUREMENTS, enabling this setting will cause application calls to the API to get overridden. |
|
Disables NVTX ranges. NVTX ranges allow the application to create markers around queue submits using the NVTX API, however this may introduce additional overhead. |
|
When enabled, individual actions will be timed separately instead of being coalesced with adjacent actions of the same kind. Enabling this option will result in a performance penalty. |
|
When enabled, source-level shader performance will be revealed per ~10 usec interval in the Top-Down Calls table and other shader profiler views. Shader performance is collected via a high-speed sampling profiler in the SM hardware, which incurs no shader execution overhead at runtime, and only consumes PCIe TX bandwidth (along with perf counters). When disabled, a more detailed list of SM and L1TEX perf counters will be collected. |
|
Disable collection of Shader Pipelines. If Shader Pipeline collection is enabled the Shader Pipelines view will list all PSOs, shader code will be available for browsing, the Top-Down Calls tree will contain the static inlined call graph, and the Ray Tracing Live State view will be populated. When Shader Pipeline collection is disabled, the Shader Pipelines, Shader Source, and Top-Down Calls trees will be empty. |
|
Disable collection of external shader debug info in the trace. If collection of external shader debug info is enabled, GPU Trace will try to resolve debug information for shaders without pre-embedded debug information on the target application. Any found debug information will be embedded in the trace report. |
|
The sampling interval in cycles, for the hardware sampling profiler in the SM. This is referenced to the GPC clock frequency, which may run at the boost clock. If you see a warning message that the hardware dropped samples, try increasing this interval. Must be a power of 2; minimum 32. |
|
The maximum background traffic incurred by PM Counters and Warp State Sampling. |
|
Disable collection of shader hashes as part of the trace. |
|
Enable keep going mode to collect another trace after the current trace is done. When enabled, can keep collecting traces until manually terminate the process or request to exit (Ctrl+C). |
Examples:
ngfx.exe --activity="GPU Trace Profiler" --platform="Windows"
--exe=D:\Bloom\bloom.exe --start-after-ms=10000 --architecture=Ada --metric-set-id=1
Launch an application for automatically generating GPU Trace capture after waiting the specified count of seconds, with using the metric set index of 1 on the Ada GPU architecture.
ngfx.exe --activity="GPU Trace Profiler" --platform="Windows"
--exe=D:\Bloom\bloom.exe --start-after-hotkey --auto-export
Launch an application for manually triggering generating GPU Trace capture. CLI is waiting for the capture triggered from the target side (pressing Target application capture hotkey on the running application). After the capture is finished, CLI also opens the generated GPU Trace capture and exports the metrics data.
ngfx.exe --activity="GPU Trace Profiler" --platform="Windows"
--project="D:\Projects\Bloom.ngfx-proj" ---start-after-ms=10000
Launch an application for automatically generating GPU Trace capture after waiting the specified count of milliseconds, but with using the launch options and activity options read from a Nsight Graphics project.