

Create Graph
Graph Setup
After connecting your tables, the next step is to link them into a graph schema to enable predictions.
- To begin, go to Graphs and select Create graph.
- Select the tables to include. As you add tables, you can view the graph on the right pane.
- Select Next to proceed.
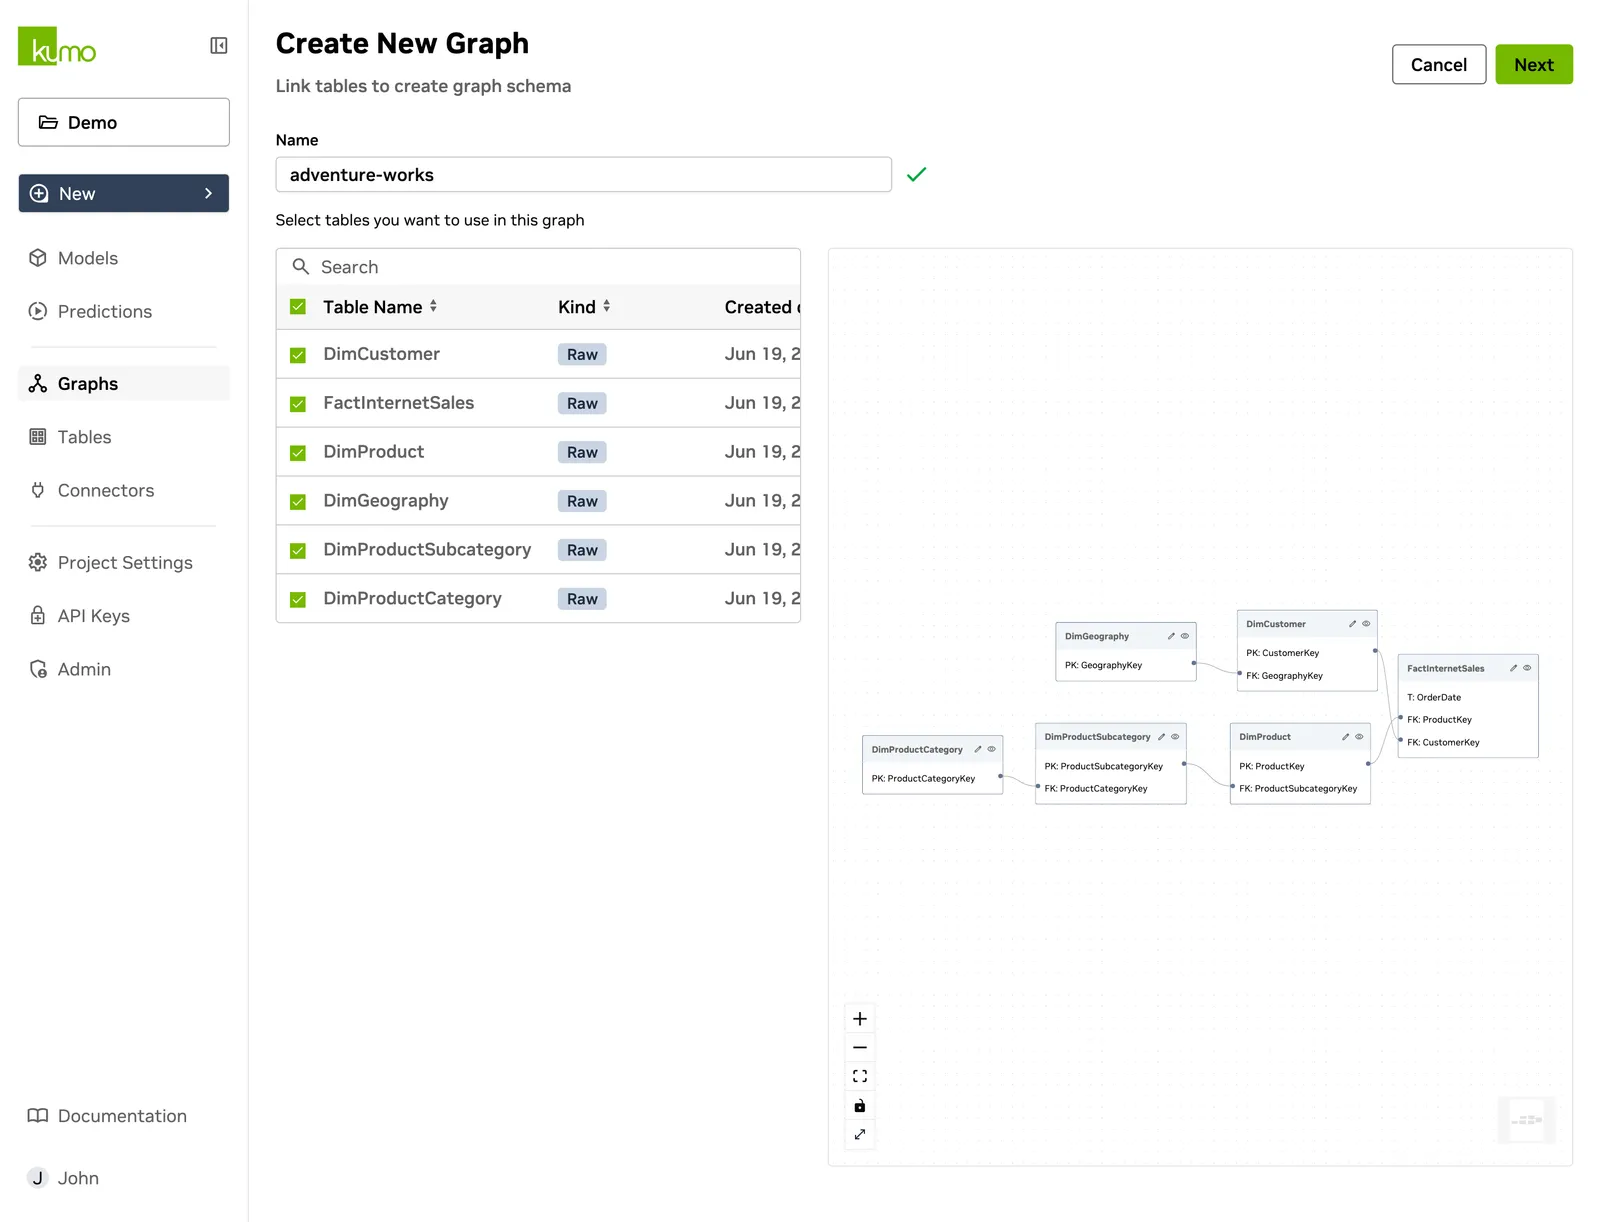
Table Linkages
After tables are selected, link them by specifying key (ID) columns that define relationships between tables. These links help Kumo understand the structure of your data for making predictions.
Links– Connect a primary key column to another table’s foreign key column.Backlinks– Appear when other tables reference this table, indicating outward relationships.
For a retail dataset, you might link:
- CustomerKey between
DimCustomerandFactInternetSales. - ProductKey between
DimProductandFactInternetSales.
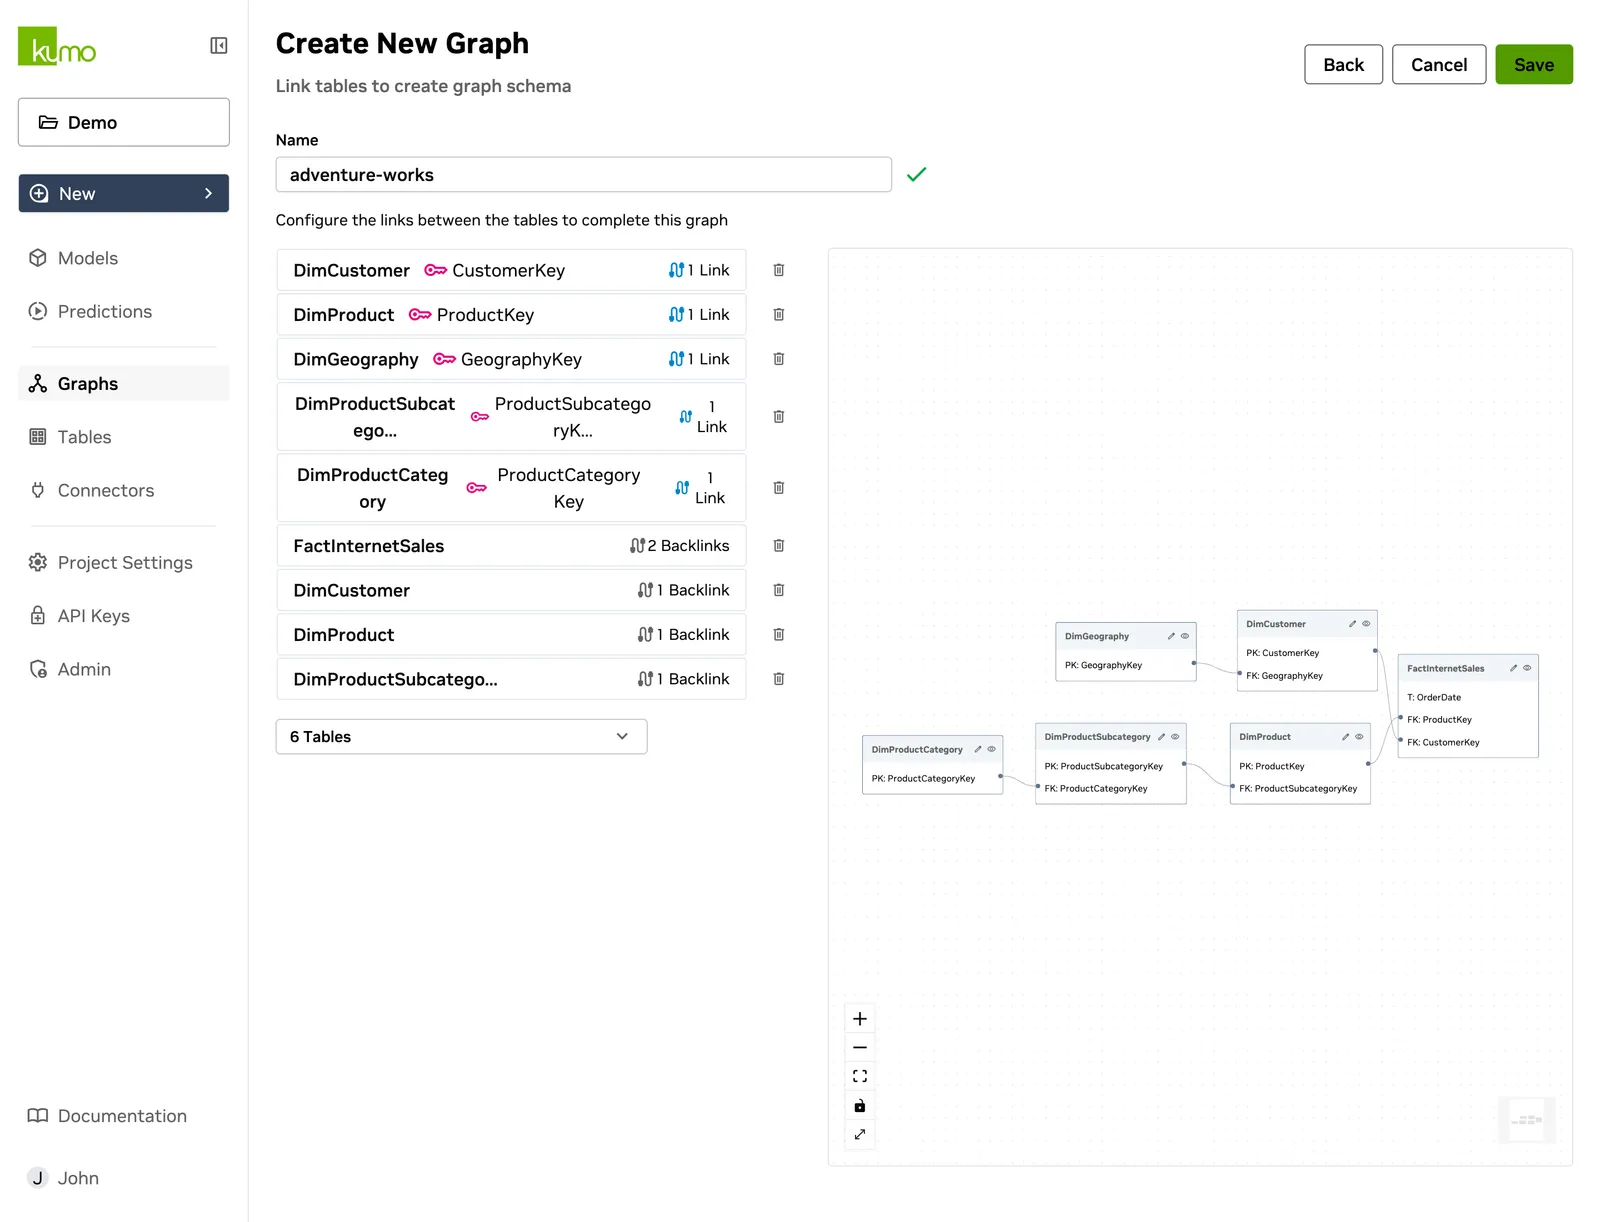
Table Linkage Considerations
Kumo automatically suggests links by matching column names across tables. Each suggested link is drawn in the graph as a line between the two columns it joins.
When creating table links, keep in mind:
- Timestamps do not need manual linking. Kumo automatically detects them.
- If two linked columns have different types, both are cast to strings. Ensure values still match after casting.
- Rows with missing key values are ignored when creating linkages.
- Rows with unmatched key values across tables are also ignored.
To adjust linkages:
- Select a table row to expand it and review its forward links.
- Choose tables and column names to add links, or select the Delete icon to remove one.
- Select Save to finalize your schema.
Verifying Your Graph Linkages
After you save, Kumo opens the graph’s detail page. It shows when the graph was created, a summary of its configuration such as 6 tables x 5 links, and the schema. Use this page to confirm the structure is what you expect: that the right tables are present, and that each link joins the columns you intended.
This page confirms the structure, not the data. How well the linked columns actually match is measured the first time you run a job against the graph — see Training.
When the graph matches your expectations, select New > Model and choose this graph to write your first predictive query.
Modifying Tables When Creating or Updating Graphs
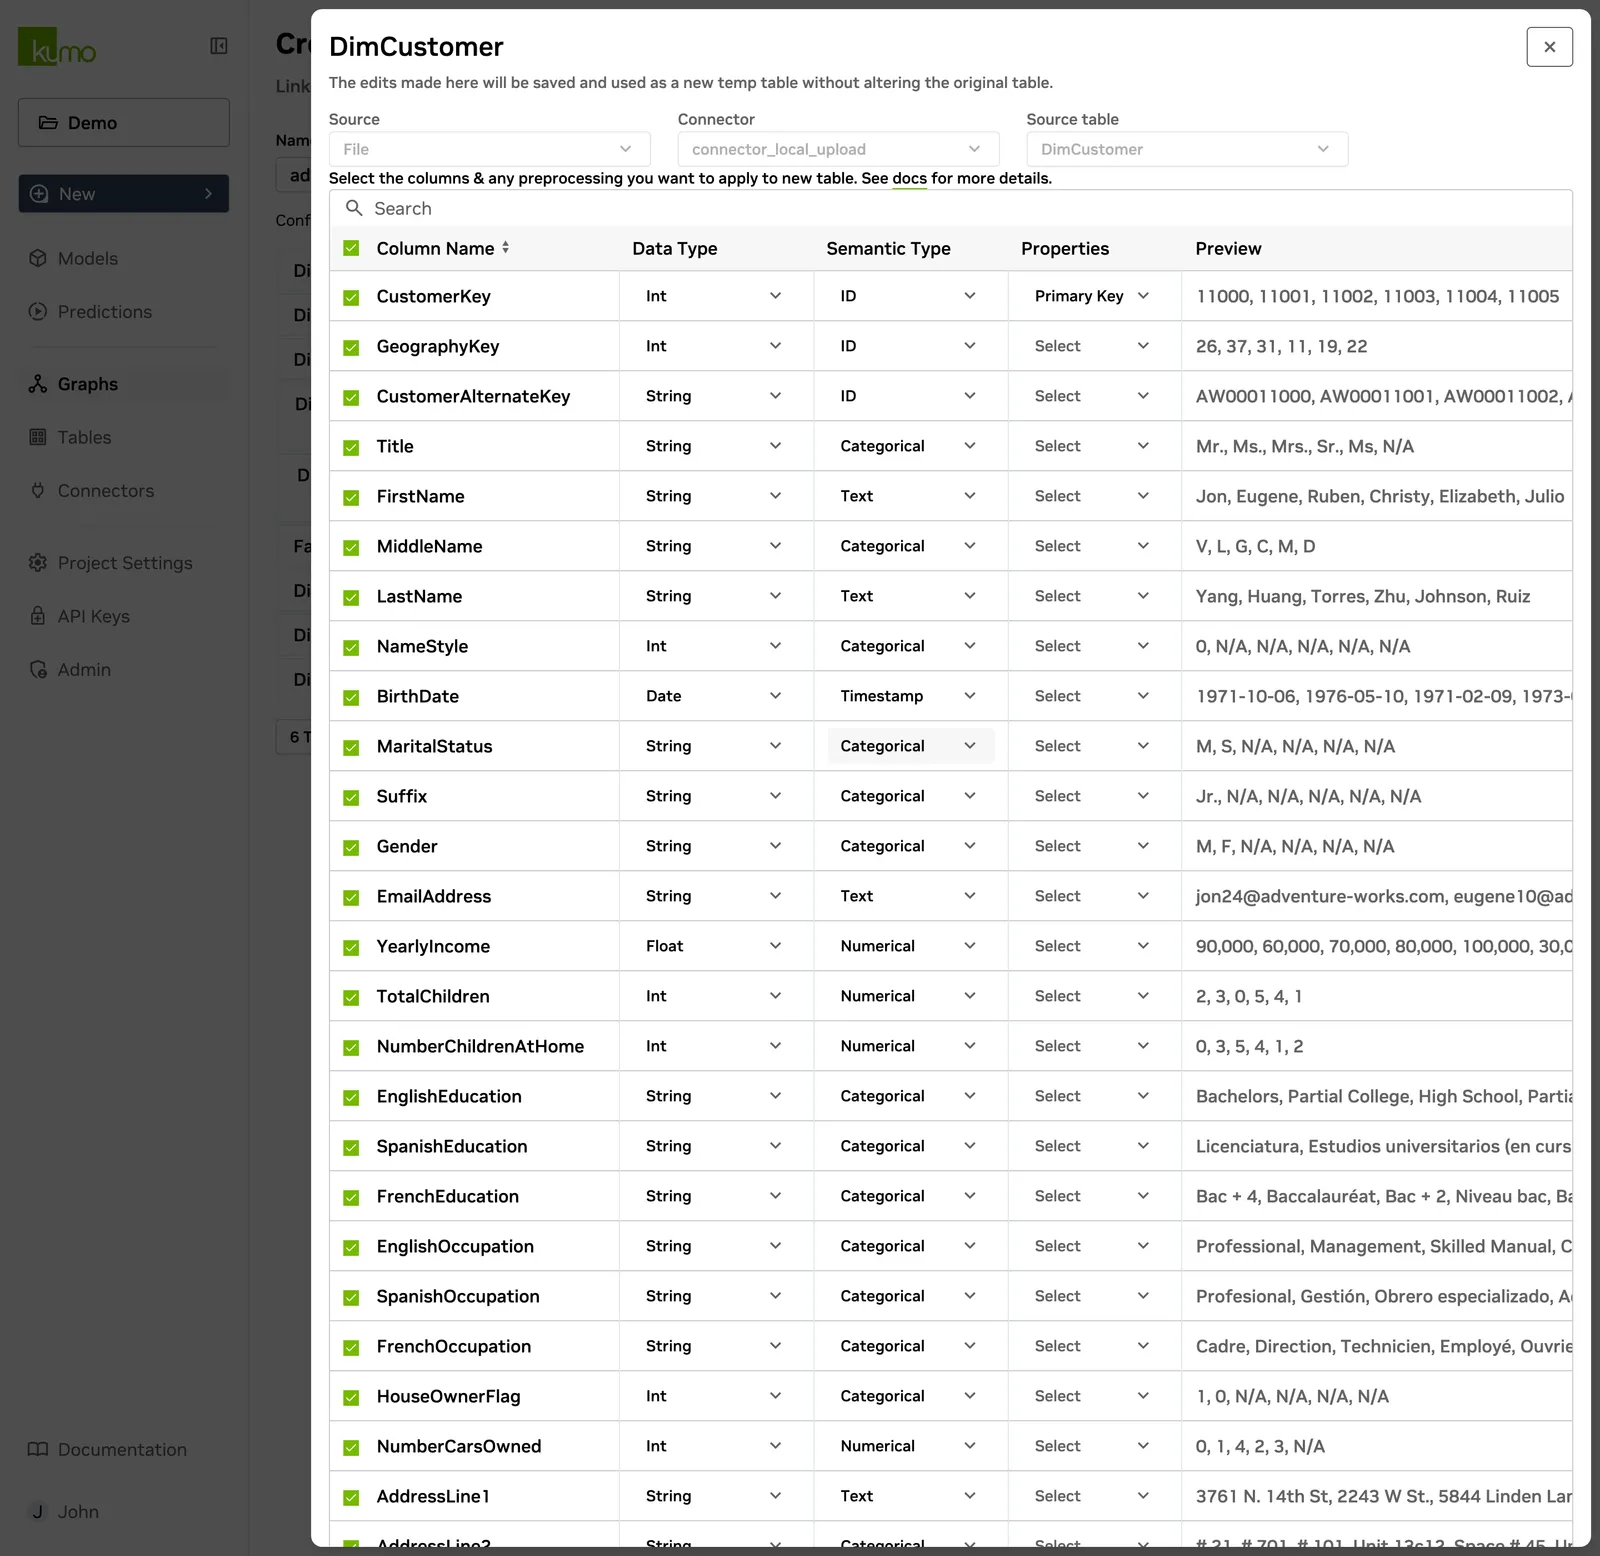
If you need to modify a table while building or editing a graph, you can do so directly from the graph builder without leaving the workflow. For example, set a missing primary key or create date, or adjust column selections.
On the graph schema shown above, select the Edit (pencil) icon on the header of the table you want to modify.
This opens the table’s edit modal, where you can make the necessary changes in place.
Fixing Data Issues After Graph Creation
If you discover data quality issues after creating your graph:
- Fix issues in your source data.
- Kumo will automatically re-ingest and reconnect tables the next time you train a model.