

Evaluation
Overview
Evaluating your trained model helps ensure that its performance meets expectations and delivers meaningful results. Kumo provides built-in evaluation tools for assessing model accuracy on unseen data.
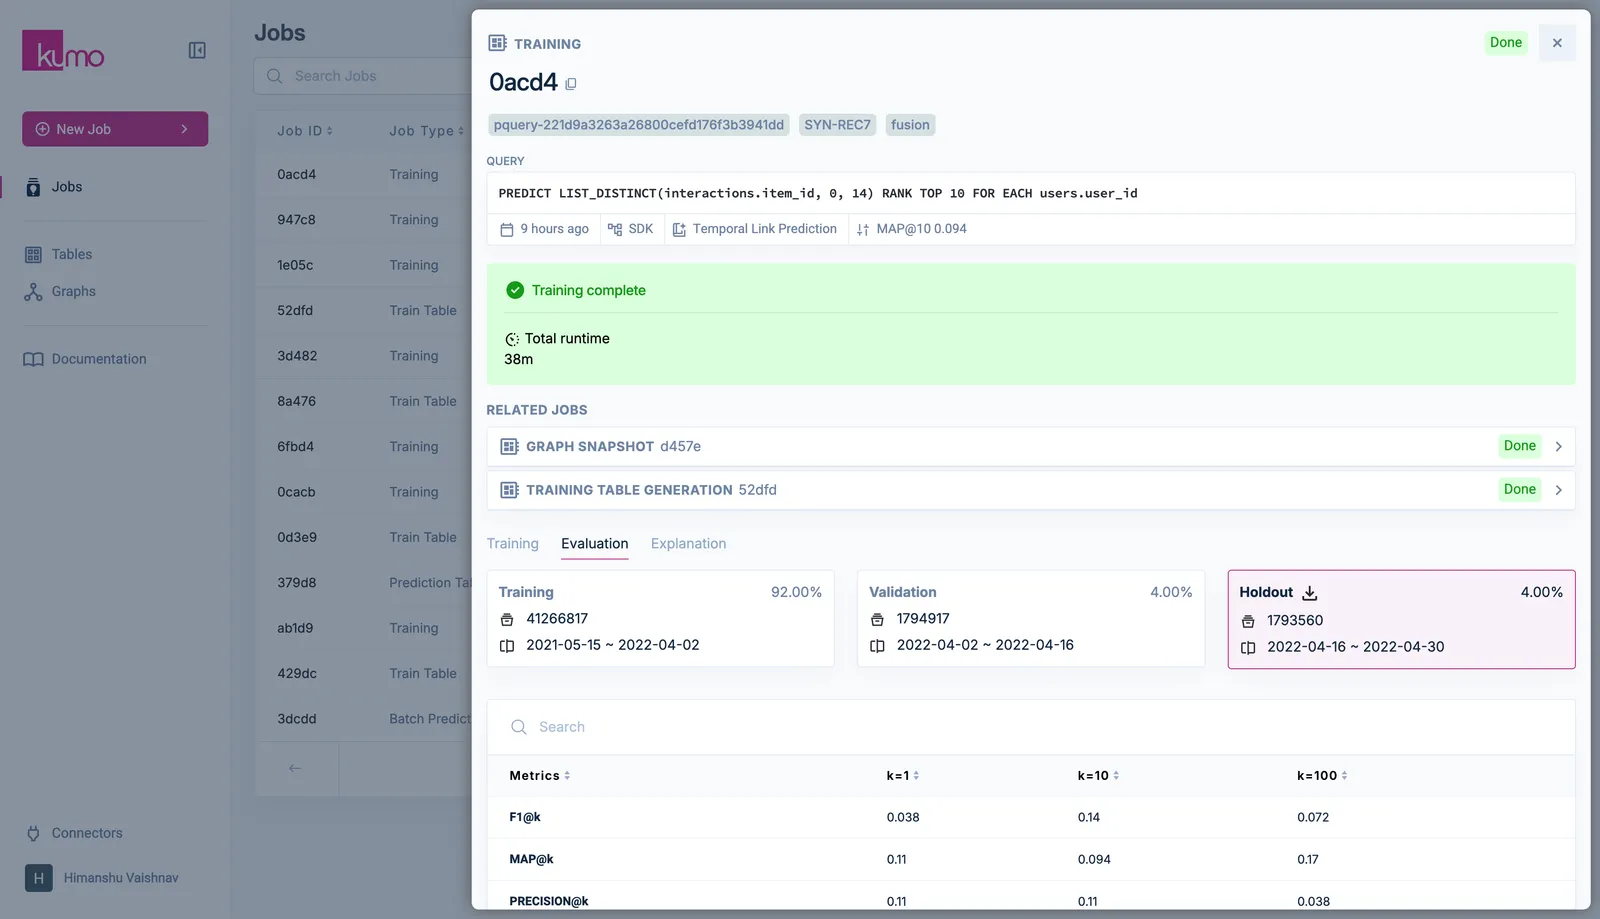
Kumo evaluates each model on the most recent period of historical data, called the holdout set. Kumo excludes this data from the training process. The Evaluation tab on the predictive query detail page provides a comprehensive analysis of model performance.
By default, Kumo uses the most recent time window for evaluation. The evaluation window aligns with the predictive query’s prediction window. For example, a 30-day prediction window uses the last 30 days of historical data for evaluation, while Kumo uses the remaining data for model development. You can adjust these settings in the model plan when you create or edit a predictive query.
Validation Data Split and Evaluation Process
Kumo partitions historical training data into three key splits:
- Holdout data split: The most recent time period. Kumo uses this split exclusively for final model evaluation to assess generalization to unseen data.
- Validation data split: The second-most-recent time period. Kumo uses this split during experimentation to identify the best-performing model.
- Training data split: All earlier time periods. Kumo uses this split to train multiple candidate models during the search process.
During training, Kumo searches for the optimal architecture and hyperparameters by running multiple experiments. Kumo randomly samples experiments from the hyperparameter search space without replacement (best effort). Kumo trains each experiment on the Training Data Split and evaluates it on the Validation Data Split.
Kumo then evaluates the best-performing configuration on the holdout data split to generate the final performance metrics.
Evaluation Metrics
Kumo selects evaluation metrics based on the predictive query’s target type.
Binary Classification
For queries that predict one of two values, such as true or false, Kumo provides the following metrics:
-
Accuracy
-
Area under the receiver operating characteristic curve (AUROC)
-
Area under the precision-recall curve (AUPRC)
-
Confusion matrix
-
Gain chart
For more details seeclassification metrics.
Multiclass Classification
For queries that predict one of three or more categorical values, Kumo provides the following metric:
-
Accuracy
For more details seeclassification metrics.
Multilabel Classification
For queries that predict one or more categorical values, Kumo provides the following metrics:
- AUPRC, including macro, micro, and per-label values
- AUROC, including macro, micro, and per-label values
- Average precision (AP)
LIST_DISTINCT is used on a categorical column that is not a foreign key, Kumo treats the task as multilabel classification.For more details seeclassification metrics.
Link Prediction
For queries that return a list of associated values, such as queries that use LIST_DISTINCT on a foreign-key column, Kumo provides retrieval metrics at cutoff values of 1, 10, and 100:
-
F1@K
-
MAP@K
-
Precision@K
-
Recall@K
For more details, refer to Link Prediction Metrics.
Regression
For queries that predict numeric values by using aggregations such as SUM or MAX, Kumo provides the following metrics and visualizations:
-
Mean Absolute Error (MAE)
-
Mean Squared Error (MSE)
-
Root Mean Squared Error (RMSE)
-
Mean Absolute Percentage Error (MAPE)
-
Symmetric Mean Absolute Percentage Error (SMAPE)
-
Distribution of Predictions Histogram
For more details see Regression Metrics.