

Select Tables
After your connector is set up, select the source tables to ingest into Kumo.
Connecting a Table
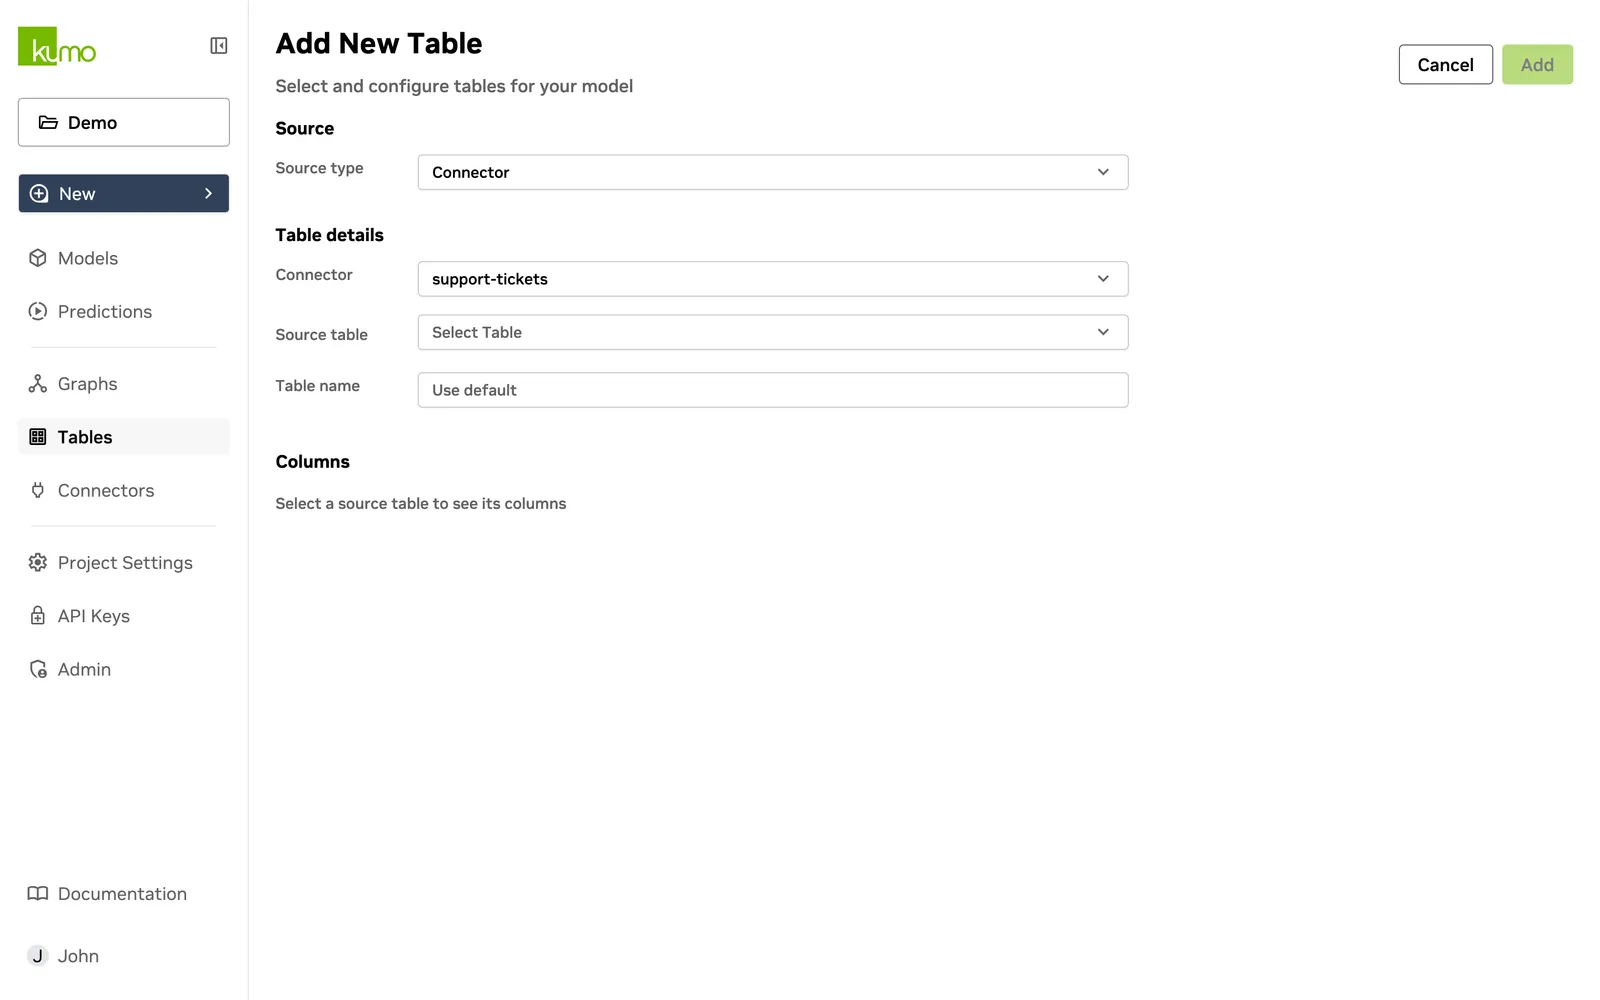
- Navigate to Tables in the side menu and click Add Table.
- Next, select a Source:
- Connector – Choose an existing data connector.
- Local Upload – Upload a local CSV or Parquet file.
Selecting a Connector Source
If you choose Connector as the source type:
- Select a connector from the drop-down.
- Kumo loads available tables in the Source Table drop-down.
- (For Native Databricks users) – Enter the Schema Name to populate the table list.
Column Selection
Select columns that meet the following criteria for best results:
- Clean: Remove fake or synthetic data, predictions from other ML models, and any data known to be unreliable or inaccurate. Also remove columns whose definitions have changed over time - for example, where an attribute ID maps to different things in different periods.
- Relevant and Mutually Exclusive: Remove columns with duplicated, similar, or irrelevant information. The larger the graph size (the total column count across all tables in a graph), the higher the compute cost.
- Complete: Cover the full history for the timeframe in question (for example, a complete record of purchases rather than only a user’s first or last purchase). If this results in an oversized dataset, provide a compressed version that tracks changes in aggregate metrics over time (for example, per day, week, or month).
🚧 Using wrong or unnecessary columns can degrade model performance (due to noisy pQuery inputs or data leakage) and increase pQuery training costs.
Column Preprocessing
After selecting a table, you can define column types and preprocessing steps to ensure proper data handling. For details, refer to Column Preprocessing.
Debugging & Data Validation
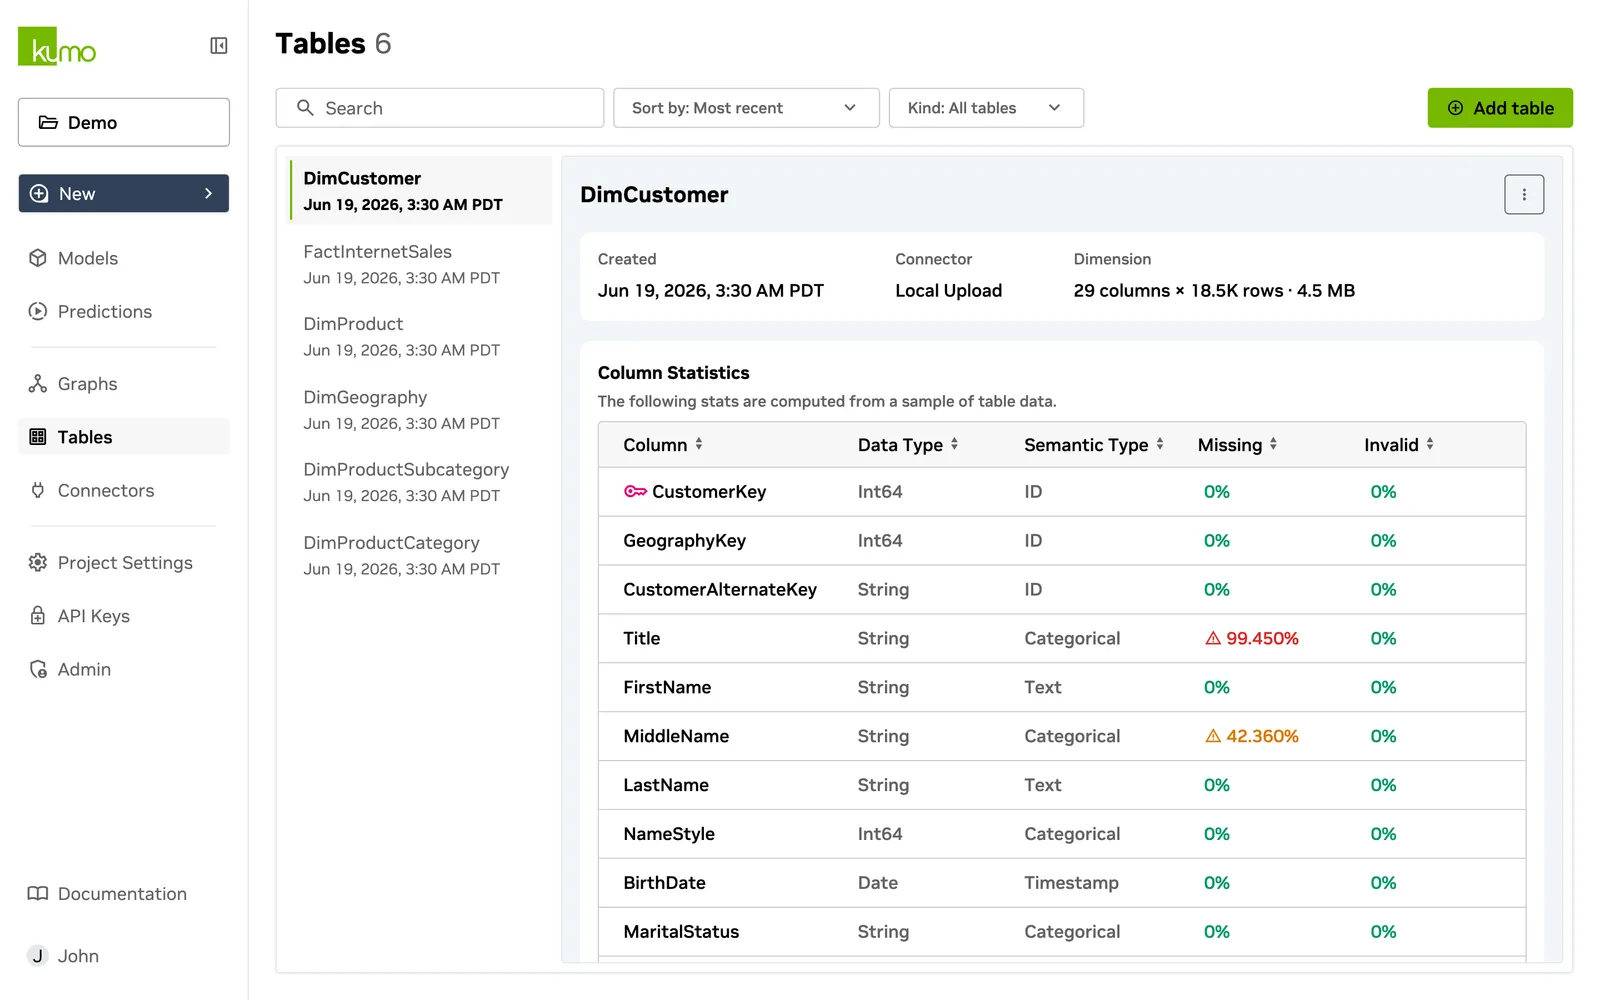
To verify a table’s schema and metadata:
- Navigate to the Tables page.
- Click on the table name to view details.
- Click on a column to view the detailed Stats.
This provides:
- Column statistics (for example, missing values, cardinality, distributions).
- Sample rows for verification.
Kumo computes this information from a smaller sample of the dataset. Complete statistics are available after full data ingestion during model training.
Handling Missing Data
- Kumo treats blank entries as missing values.
- It does not automatically recognize special strings (
"NaN","none","N/A") as missing. - For numeric columns, missing values are often filled with placeholder values (e.g.,
-1). These should be cleared or left blank if you want them treated as missing.