

Explainability
Overview
The Explanations tab on the Training job detail page provides model-level explainability and insights into individual entity-level predictions for a selected subset of entities.
How Predictive Query Explainability Works
Kumo uses graph neural networks (GNNs) to make predictions. To help you understand and trust those predictions, Kumo provides several Explainable AI (XAI) tools that reveal how your data drives each result.
These tools help you:
- Understand which tables, columns, and values contribute to a prediction
- Detect data quality issues such as leakage and bias
- Explain predictions to stakeholders at any level of detail
- Troubleshoot unexpected model behavior
Explainability in Kumo operates at two levels: local (per-entity) and global (across the full population).
Entity-Level Explainability
Entity-level explainability lets you explore model predictions for individual entities and compare them against ground-truth data.
This includes:
- Entity-level Explainability: explore model predictions and compare them against ground-truth data. For a link prediction task, this displays a list of selectable entity categories for viewing and comparing predictions against historical and ground truth data in a three-way pane.
- Subgraph Visualization: shows the full subgraph used by the model to derive a prediction, which is useful for debugging (for example, to verify whether the model sees the expected inputs).
- Column Importance Scores: shows column importance scores for individual nodes in the surrounding of an entity (for example, importance scores of transaction dates, article categories). Kumo generates column importance scores through gradient backpropagation with respect to input columns. The higher the score, the more important that row/column pair is for the prediction.
- Pre-selected Entities: based on criteria such as true positives, true negatives, false positives, false negatives, and cold-start entities. This lets you efficiently explore a diverse set of entities across a range of model prediction outcomes.
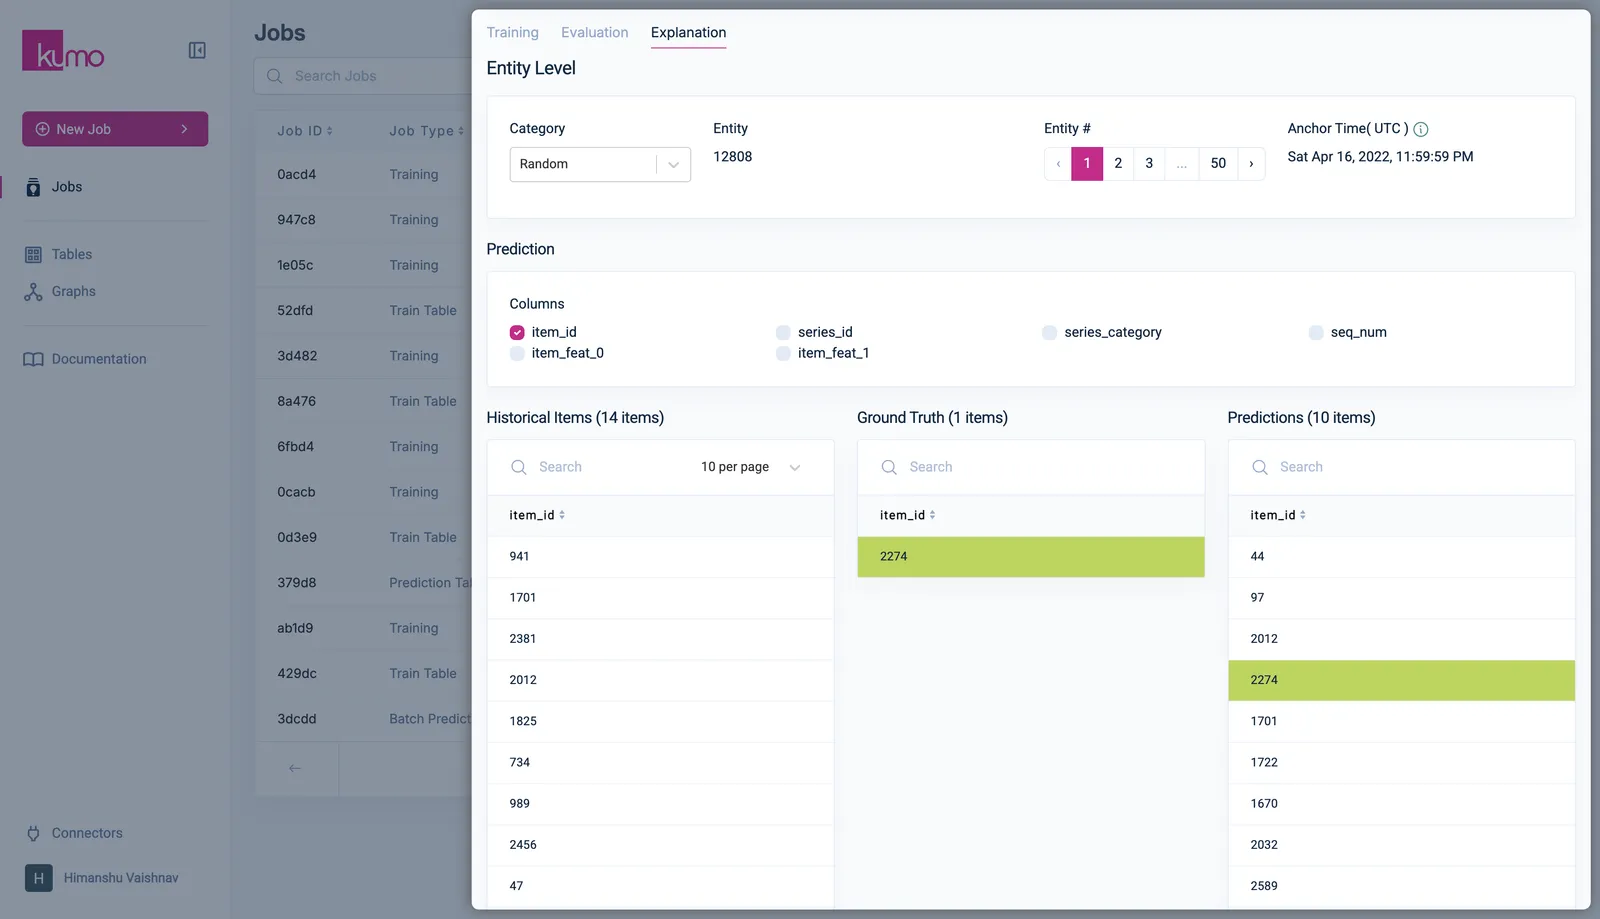
Entity Selection
Entities are grouped into categories based on model confidence and correctness (for example, true positives, false negatives, uncertain predictions, cold-start entities). Each category lets you explore up to 50 entities, along with their anchor time.
Model Prediction Analysis
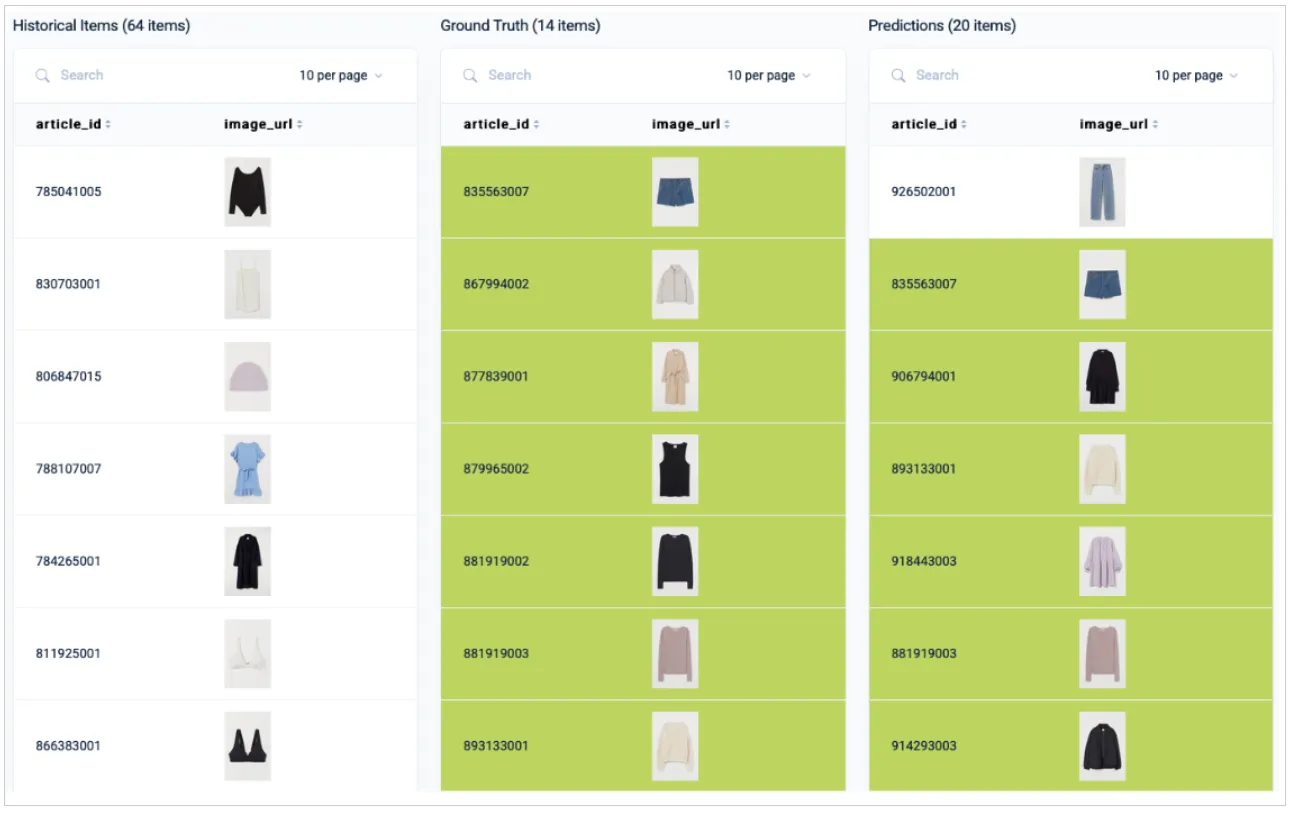
For a selected entity, Kumo displays its model prediction and ground-truth value. In link prediction tasks, predictions are shown in three searchable panes:
- Historical Items
- Ground Truth
- Predictions
The interface supports image comparisons for correctly predicted items.
Subgraph
The subgraph explorer lets you inspect the subgraph used as input to the model for a given prediction.
Starting from the entity’s input row, Kumo displays the subgraph in a nested table layout that lets you explore information from different tables by following their foreign keys. The traversal depth depends on the number of layers set in the model planner. Connected fact items are ordered by recency. If a table you expect to see is missing, it is likely unreachable within the upper bound defined in the model planner.
The importance score helps you detect potential target leakage in your data and understand why a particular model prediction may be correct or incorrect.
Local Subgraph Explainability
Local subgraph explainability is prediction-specific. For a given entity, Kumo examines the sampled neighborhood used to make that prediction, including related rows, neighboring entities, timestamps, and feature values.
The local attribution scores are gradient-based. At a high level, the calculation works like this:
- Kumo runs the model on the sampled local subgraph for the entity.
- It selects the model output being explained, such as the positive-class score or logit for a binary classifier.
- It computes gradients of that output with respect to the encoded input features in the local subgraph.
- Kumo maps those gradients back to the corresponding feature values and facts in the sampled subgraph.
- Kumo normalizes the resulting scores so you can compare them within that local explanation.
These local scores are useful for debugging or explaining an individual prediction.
For example, consider a simple predictive query for churn using the H&M dataset:
Consider one of the rare “false positive” entities (the model predicts the user will churn, but they did not).
By examining the corresponding subgraph, you can see that the user has no active or club_member_status, does not receive fashion news, and has only a single past transaction.
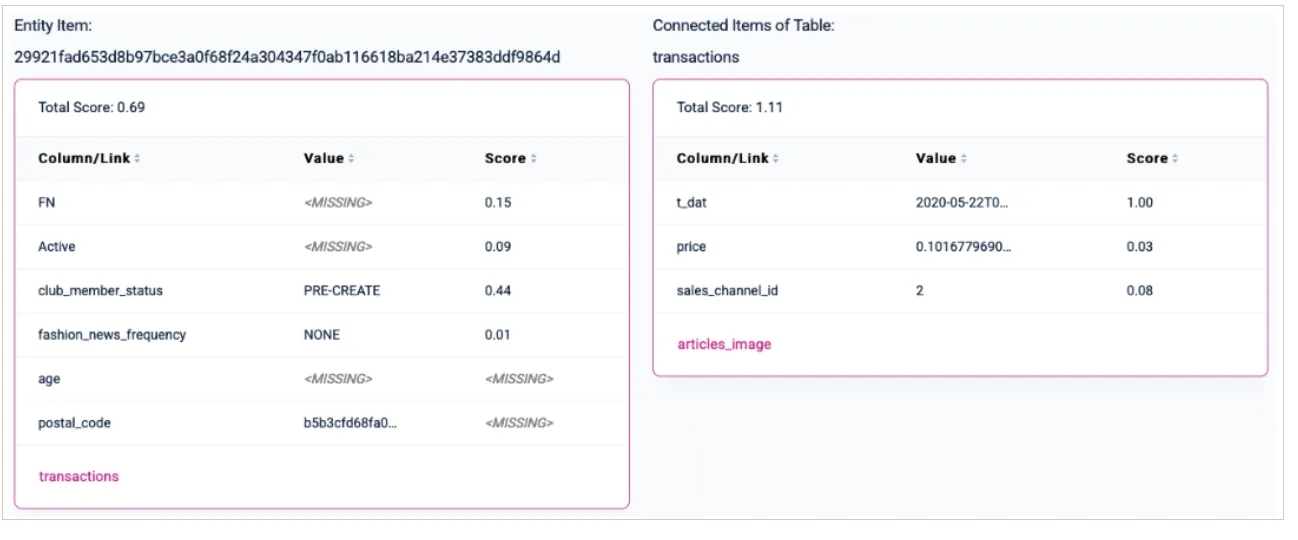
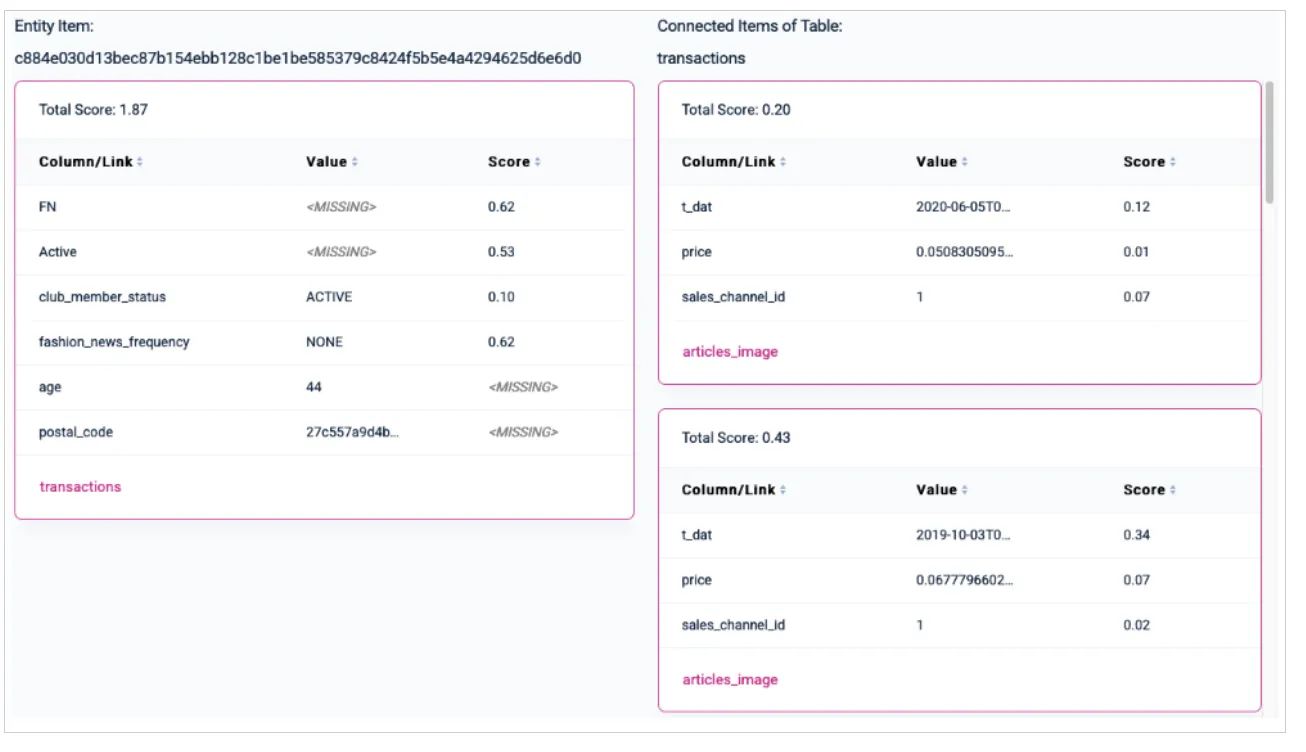
Another useful category is “Unsure”: entities where the model is uncertain about the outcome (probability ~0.5).
For example, a user without active status who does not receive fashion news, but has an active club member status and several past transactions at 6-7 month intervals.
These contradictory signals cause the model to return an uncertain prediction with a slight tendency toward churn:
Global Explainability
Global Feature Importance
Global feature importance explains which features matter most across a population of predictions. For binary classification models, the value analyzed is the model’s predicted probability for the positive class.
At a high level, the calculation works like this:
- For each feature, Kumo groups examples into cohorts based on the feature’s values: bins for numerical features or categories for categorical features.
- For each cohort, Kumo computes the average predicted positive-class probability.
- Kumo measures how much those cohort-level average predictions vary across the feature’s cohorts.
- Those raw feature-level variation scores are normalized across features so the displayed Global XAI percentages add up to 100%.
These global scores reflect overall model behavior rather than any single prediction.
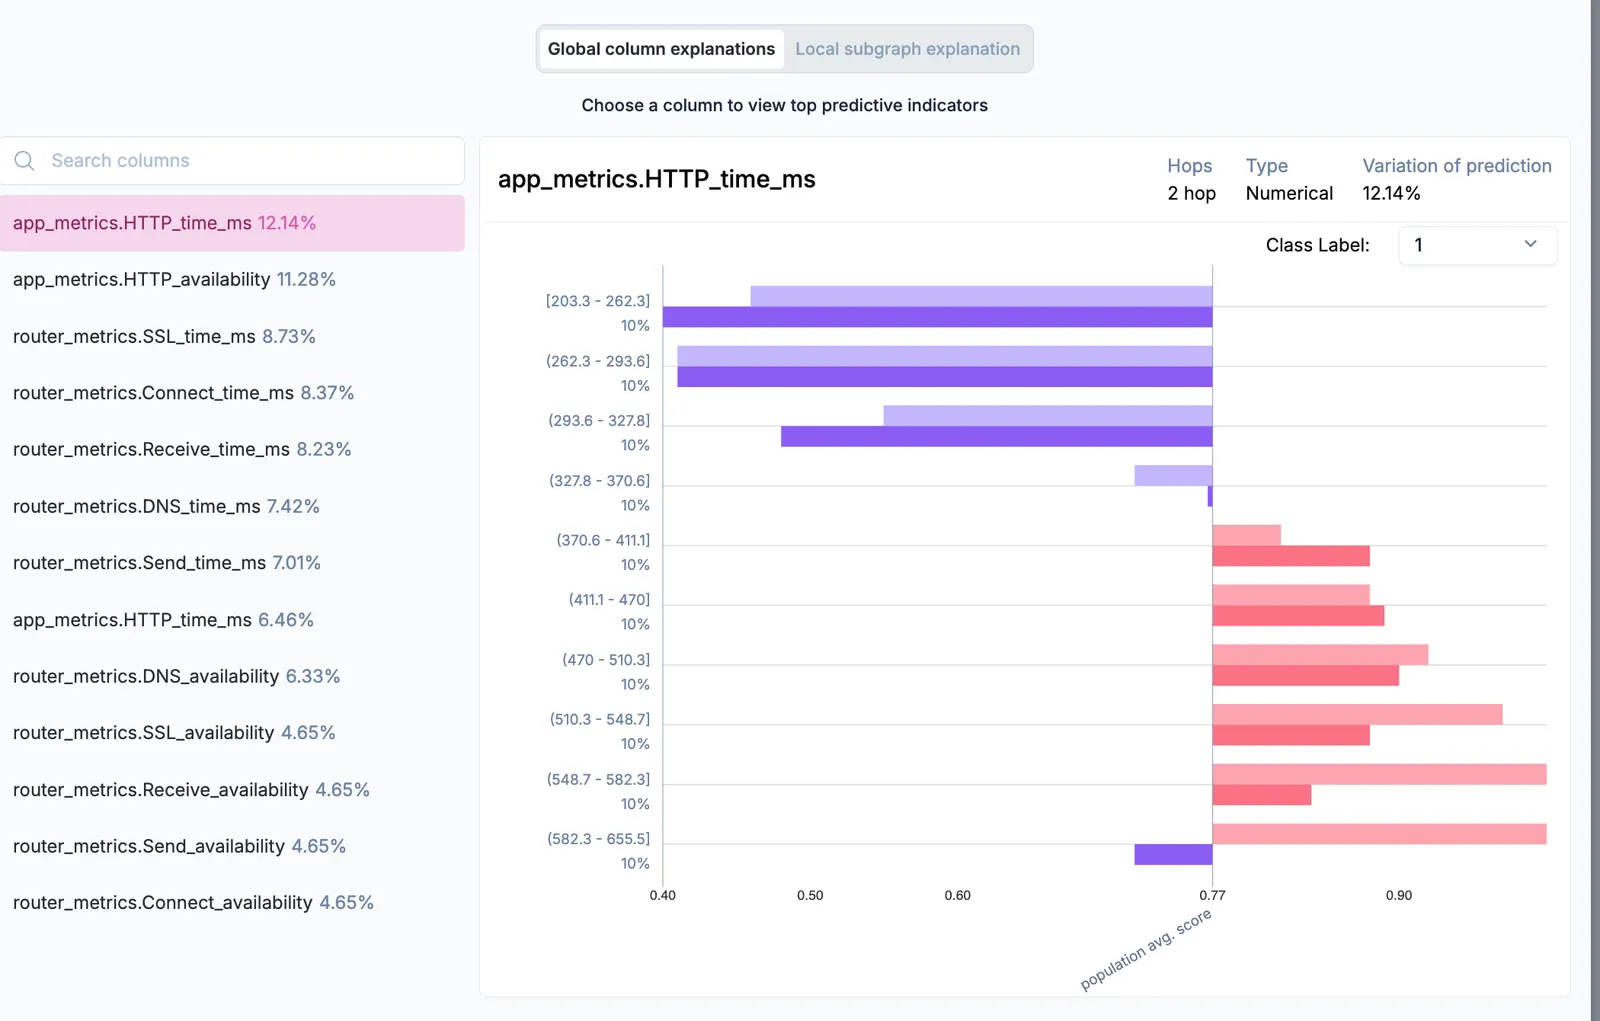
The percentages in the Variation of Predictions column indicate how each column contributes to your predictions. Kumo calculates this based on the variance of those predictions relative to the underlying columns, using both ground truth labels and predictions.
Detecting Data Leakage
Columns with variation of prediction values dramatically higher than any others may indicate data leakage: a common cause of poor accuracy at prediction time. Data leakage occurs during training when the model has access to information directly correlated with the target value, but not actually known at prediction time.
For example, suppose you are predicting whether a customer will churn in the next 30 days. A column indicating whether the customer will cancel their subscription in the next 30 days constitutes both target leakage and future information leakage. In this case, look for an excessively high contribution score for that column.
Column Analysis
Clicking a column provides a distribution plot comparing model predictions and actual labels in the holdout data split. This helps identify:
- Bias in model predictions across different entity populations.
- Feature Importance and its effect on prediction outcomes.
- Potential Data Gaps requiring additional feature engineering or dataset improvements.
Understanding column-level contributions helps data scientists refine predictive queries to improve accuracy and interpretability. Local subgraph scores are most useful for analyzing individual predictions, while global feature importance is more useful for understanding overall model behavior. The two levels are most powerful when used together - a single cell’s attribution score is only meaningful when interpreted against its global context.