Alert Verification Workflow#
Two approaches for leveraging VLMs to generate alerts are showcased as part of the agent worklows:
Alert Verification: The VLM analyzes video snippets corresponding to alerts generated upstream for verification; original alerts are generated through combination of object detection/tracking and behavior analytics microservices that process video streams in realtime. This approach invokes the VLM more sporadically and hence has lower GPU requirements , but depends on an upstream entity to generate “candidate” alerts for verification.
Real-Time alerts: The VLM continuously processes segments from a video source (eg: camera) at periodic intervals based on a user defined chunk duration . This approach leverages the generalizability of VLMs to trigger alerts for a broad set of cases (VLM fine tuning/prompt tuning may be needed). . However, it has higher GPU requirements due to more frequent VLM usage.
This section addresses the Alert Verification workflow; see the next section for Real-Time Alerts.
Use Cases for Alert Verification
PPE compliance verification (hard hats, safety vests)
Restricted area monitoring
Asset presence/absence detection
Custom object detection scenarios
Estimated Deployment Time: 15-20 minutes
The following diagram illustrates the alert verification workflow architecture:
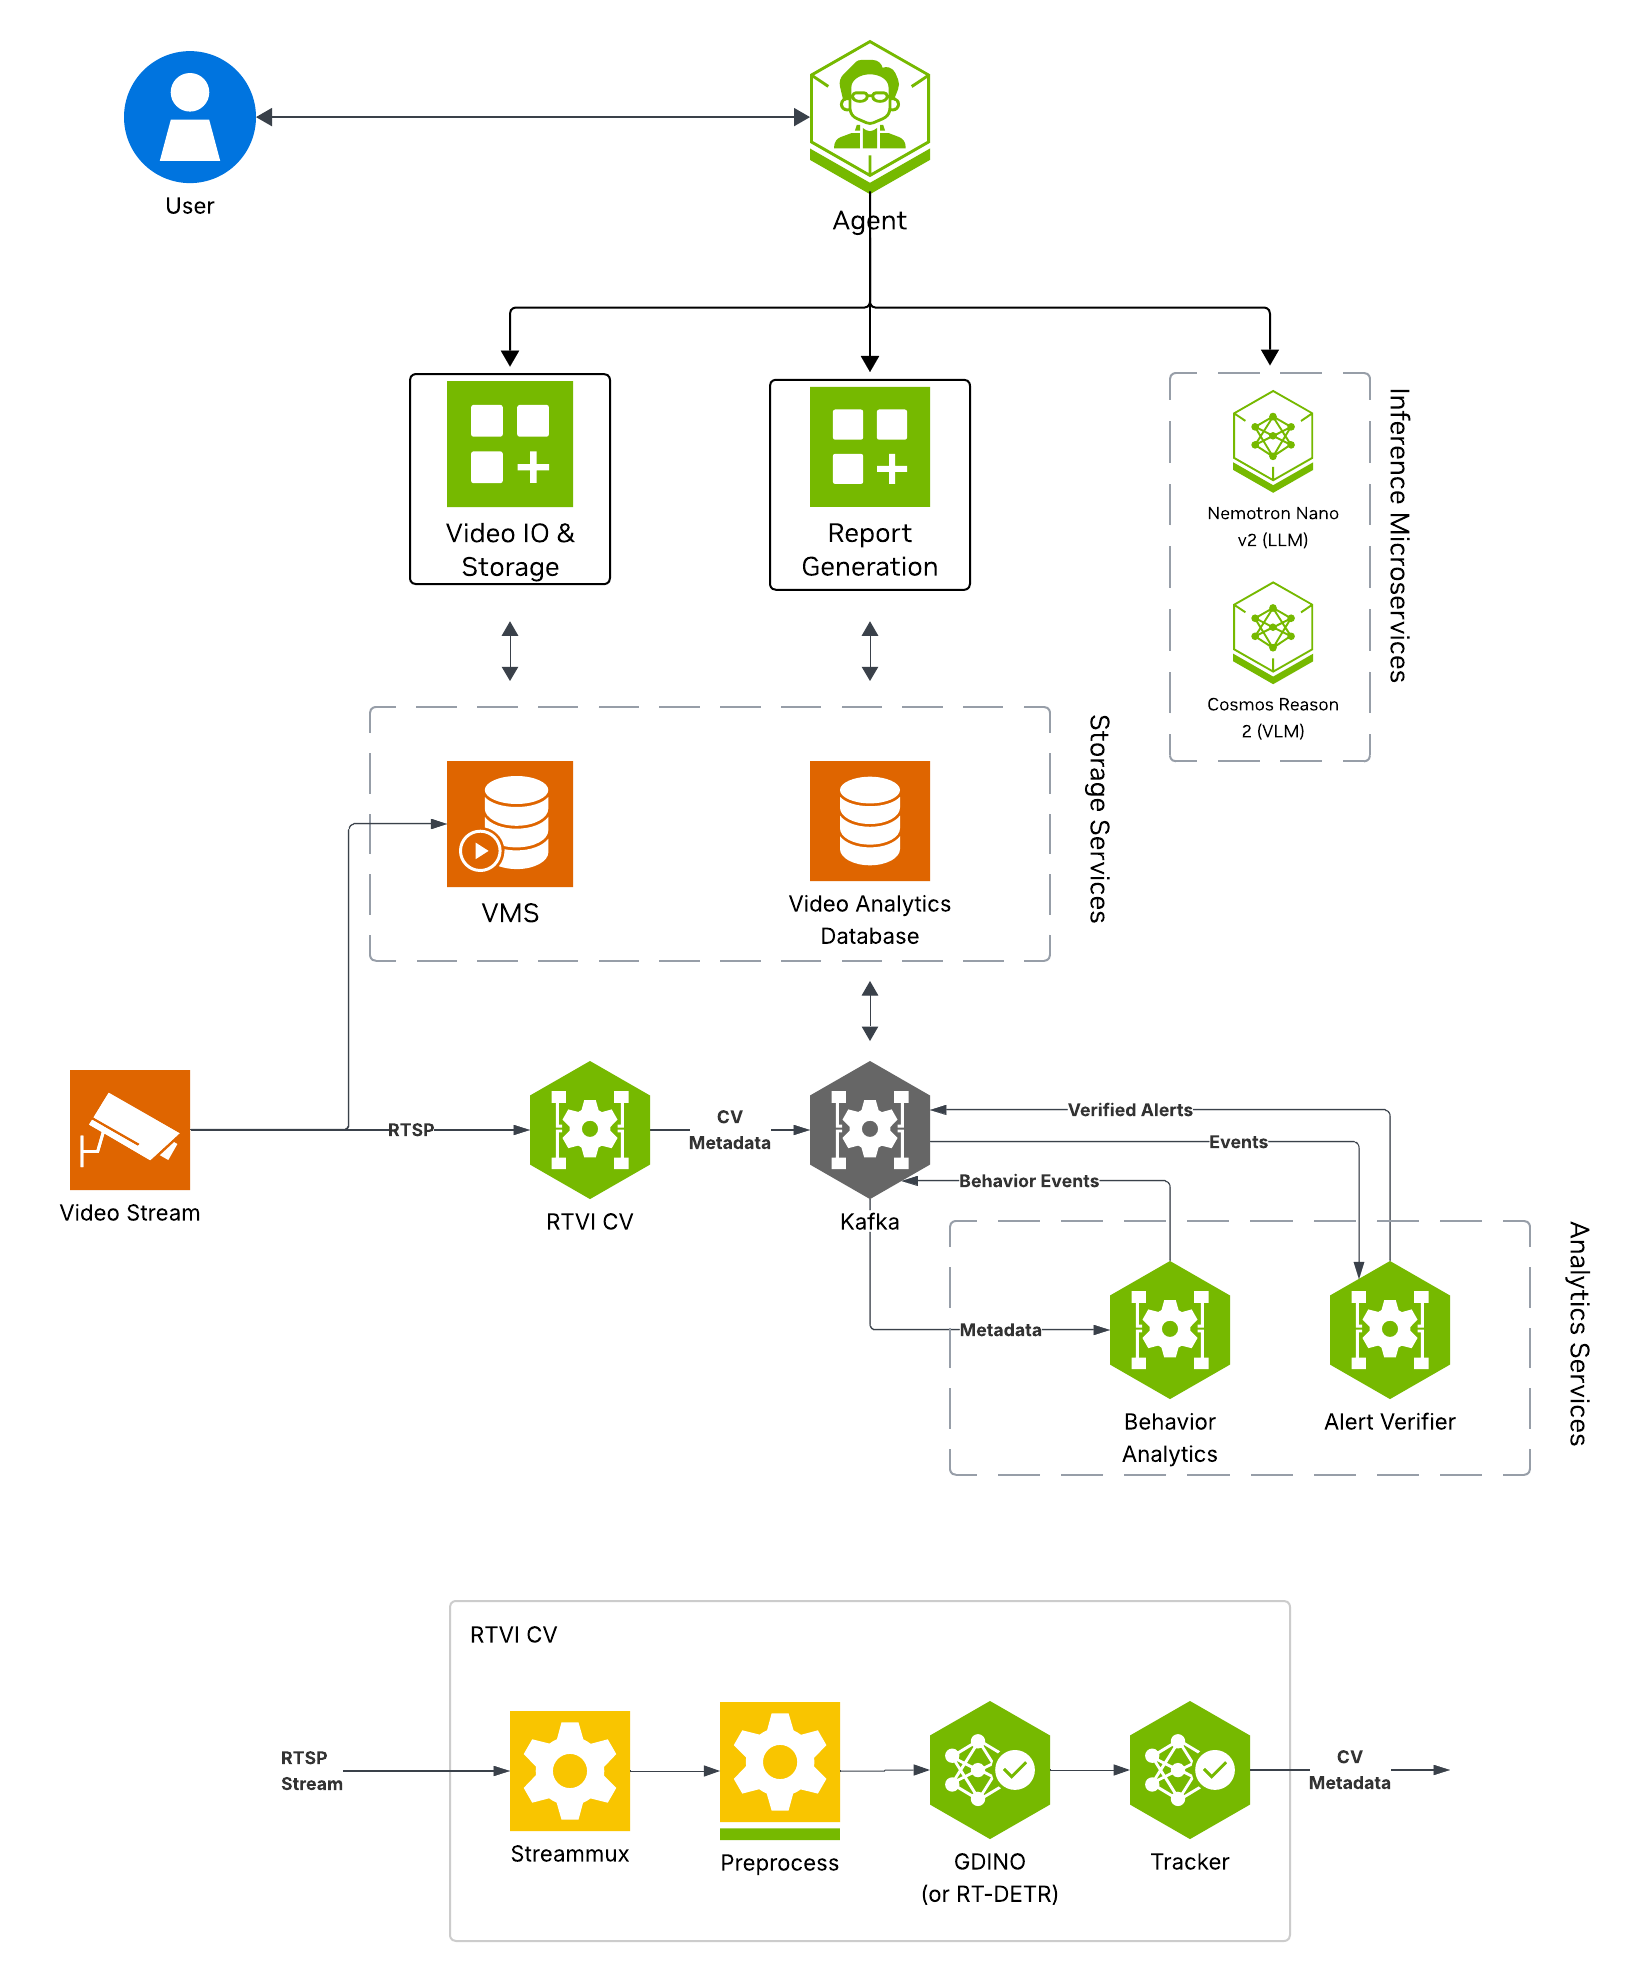
Key Features of the Alert Verification Agent:
RTVI CV for real-time object detection using Grounding DINO (open-vocabulary detection)
Behavior Analaytics for rule-based and configurable alert generation from detection results
Alert Verification for VLM-based alert clip review to reduce false positives
Alert storage for querying and reporting
Report Generation
What’s being deployed#
NVStreamer: Video streaming service for dataset video playback, thereby replicating live cameras in a real world deployment
Video IO & Storage (VIOS): Video ingestion (of NVStreamer video streams) supporting live streaming, recording, and playback features used by the agent
RTVI CV: Real-Time Video Intelligence CV Microservice for object detection that processes VIOS live streams to output metadata to Kafka
Behavior Analaytics: Processes metadata from RTVI CV to generate alerts
Alert Verification: Verification of alert video using VLM
Cosmos Reason (NIM): Vision-language model with physical reasoning capabilities used by Alert Verification
ELK: Elasticsearch, Logstash, and Kibana stack for log storage and analysis
VSS Agent: Agent service that orchestrates tool calls and model inference to answer questions and generate outputs
Nemotron LLM (NIM): LLM inference service used for reasoning, tool selection, and response generation
Phoenix: Observability and telemetry service for agent workflow monitoring
Prerequisites#
Before you begin, ensure all of the prerequisites are met. See Prerequisites for more details.
Deploy#
Note
For instructions on downloading sample data and the deployment package, see Download Sample Data and Deployment Package in the Quickstart guide.
Skip to Step 1: Deploy the Agent if you have already downloaded and deployed another agent workflow.
Step 1: Deploy the Agent#
Note
Set the NGC CLI API key, then run the deploy commands for your GPU type.
Refer to VSS-Agent-Customization-configure-llm and VSS-Agent-Customization-configure-vlm for all LLM and VLM (local and remote) configuration options.
For advanced settings and Agent Customization, see the deploy command help.
# Set NGC CLI API key
export NGC_CLI_API_KEY='your_ngc_api_key'

# View all available options
scripts/dev-profile.sh --help
scripts/dev-profile.sh up -p alerts -m verification -H H100
scripts/dev-profile.sh up -p alerts -m verification -H H100 \
    --llm-device-id 1 --vlm-device-id 2
export LLM_ENDPOINT_URL=https://your-llm-endpoint.com
scripts/dev-profile.sh up -p alerts -m verification -H H100 \
    --use-remote-llm
export VLM_ENDPOINT_URL=https://your-vlm-endpoint.com
scripts/dev-profile.sh up -p alerts -m verification -H H100 \
    --use-remote-vlm
export LLM_ENDPOINT_URL=https://your-llm-endpoint.com
export VLM_ENDPOINT_URL=https://your-vlm-endpoint.com
scripts/dev-profile.sh up -p alerts -m verification -H H100 \
    --use-remote-llm --use-remote-vlm
scripts/dev-profile.sh up -p alerts -m verification -H RTXPRO6000BW
scripts/dev-profile.sh up -p alerts -m verification -H RTXPRO6000BW \
    --llm-device-id 1 --vlm-device-id 2
export LLM_ENDPOINT_URL=https://your-llm-endpoint.com
scripts/dev-profile.sh up -p alerts -m verification -H RTXPRO6000BW \
    --use-remote-llm
export VLM_ENDPOINT_URL=https://your-vlm-endpoint.com
scripts/dev-profile.sh up -p alerts -m verification -H RTXPRO6000BW \
    --use-remote-vlm
export LLM_ENDPOINT_URL=https://your-llm-endpoint.com
export VLM_ENDPOINT_URL=https://your-vlm-endpoint.com
scripts/dev-profile.sh up -p alerts -m verification -H RTXPRO6000BW \
    --use-remote-llm --use-remote-vlm
scripts/dev-profile.sh up -p alerts -m verification -H L40S \
    --llm-device-id 1 --vlm-device-id 2
export LLM_ENDPOINT_URL=https://your-llm-endpoint.com
scripts/dev-profile.sh up -p alerts -m verification -H L40S \
    --use-remote-llm
export VLM_ENDPOINT_URL=https://your-vlm-endpoint.com
scripts/dev-profile.sh up -p alerts -m verification -H L40S \
    --use-remote-vlm
export LLM_ENDPOINT_URL=https://your-llm-endpoint.com
export VLM_ENDPOINT_URL=https://your-vlm-endpoint.com
scripts/dev-profile.sh up -p alerts -m verification -H L40S \
    --use-remote-llm --use-remote-vlm
See VSS-Agent-Customization-configure-llm for remote LLM endpoint options.
export LLM_ENDPOINT_URL=https://your-llm-endpoint.com
scripts/dev-profile.sh up -p alerts -m verification -H DGX-SPARK \
    --use-remote-llm
See VSS-Agent-Customization-configure-llm for remote LLM endpoint options.
export LLM_ENDPOINT_URL=https://your-llm-endpoint.com
scripts/dev-profile.sh up -p alerts -m verification -H IGX-THOR \
    --use-remote-llm
See VSS-Agent-Customization-configure-llm for remote LLM endpoint options.
export LLM_ENDPOINT_URL=https://your-llm-endpoint.com
scripts/dev-profile.sh up -p alerts -m verification -H AGX-THOR \
    --use-remote-llm
See Local LLM and VLM deployments on OTHER hardware for known limitations and constraints.
scripts/dev-profile.sh up -p alerts -m verification -H OTHER \
    --llm-env-file /path/to/llm.env --vlm-env-file /path/to/vlm.env
scripts/dev-profile.sh up -p alerts -m verification -H OTHER \
    --llm-device-id 1 --vlm-device-id 2 \
    --llm-env-file /path/to/llm.env --vlm-env-file /path/to/vlm.env
export LLM_ENDPOINT_URL=https://your-llm-endpoint.com
scripts/dev-profile.sh up -p alerts -m verification -H OTHER \
    --use-remote-llm --vlm-env-file /path/to/vlm.env
export VLM_ENDPOINT_URL=https://your-vlm-endpoint.com
scripts/dev-profile.sh up -p alerts -m verification -H OTHER \
    --use-remote-vlm --llm-env-file /path/to/llm.env
export LLM_ENDPOINT_URL=https://your-llm-endpoint.com
export VLM_ENDPOINT_URL=https://your-vlm-endpoint.com
scripts/dev-profile.sh up -p alerts -m verification -H OTHER \
    --use-remote-llm --use-remote-vlm
This command will download the necessary containers from the NGC Docker registry and start the agent. Depending on your network speed, this may take a few minutes.
This deployment uses the following defaults:
Host IP: src IP from
ip route get 1.1.1.1LLM model: nvidia/nvidia-nemotron-nano-9b-v2
VLM model: nvidia/cosmos-reason2-8b
To use a different IP than the one derived:
-i: Manually specify the host IP address.-e: Optionally specify an externally accessible IP address for services that need to be reached from outside the host.
Note
When using a remote VLM of model-type nim (not openai), see How does a remote nim VLM access videos? for access requirements.
Once the deployment is complete, check that all the containers are running and healthy:
docker ps
Once all the containers are running, you can access the agent UI at http://<HOST_IP>:3000/.
If you would like to modify the workflow to work with other videos or usecases, you can update the following files:
deployments/developer-workflow/dev-profile-alerts/vlm-as-verifier/configs/alert_type_config.jsonModify the “output_category” and “user” fields here. “output_category” modifies the category type that shows up in the agent UI. “user” is the user prompt that is sent to the VLM for verification of each alert clip.
deployments/developer-workflow/dev-profile-alerts/deepstream/configs/config_triton_nvinferserver_gdino.txtUpdate the “type_name” field under “postprocess” to change the objects that are detected by Grounding DINO. By default this is “person” with a threshold of 0.5. This can be modified to support multiple classes by using “ . “ as a delimiter.
deployments/developer-workflow/dev-profile-alerts/vss-behavior-analytics/configs/vss-behavior-analytics-kafka-config.jsonUpdate the “value” field under
"name": "fovCountViolationIncidentObjectType"to change the objects that Behavior Analytics creates alerts for.
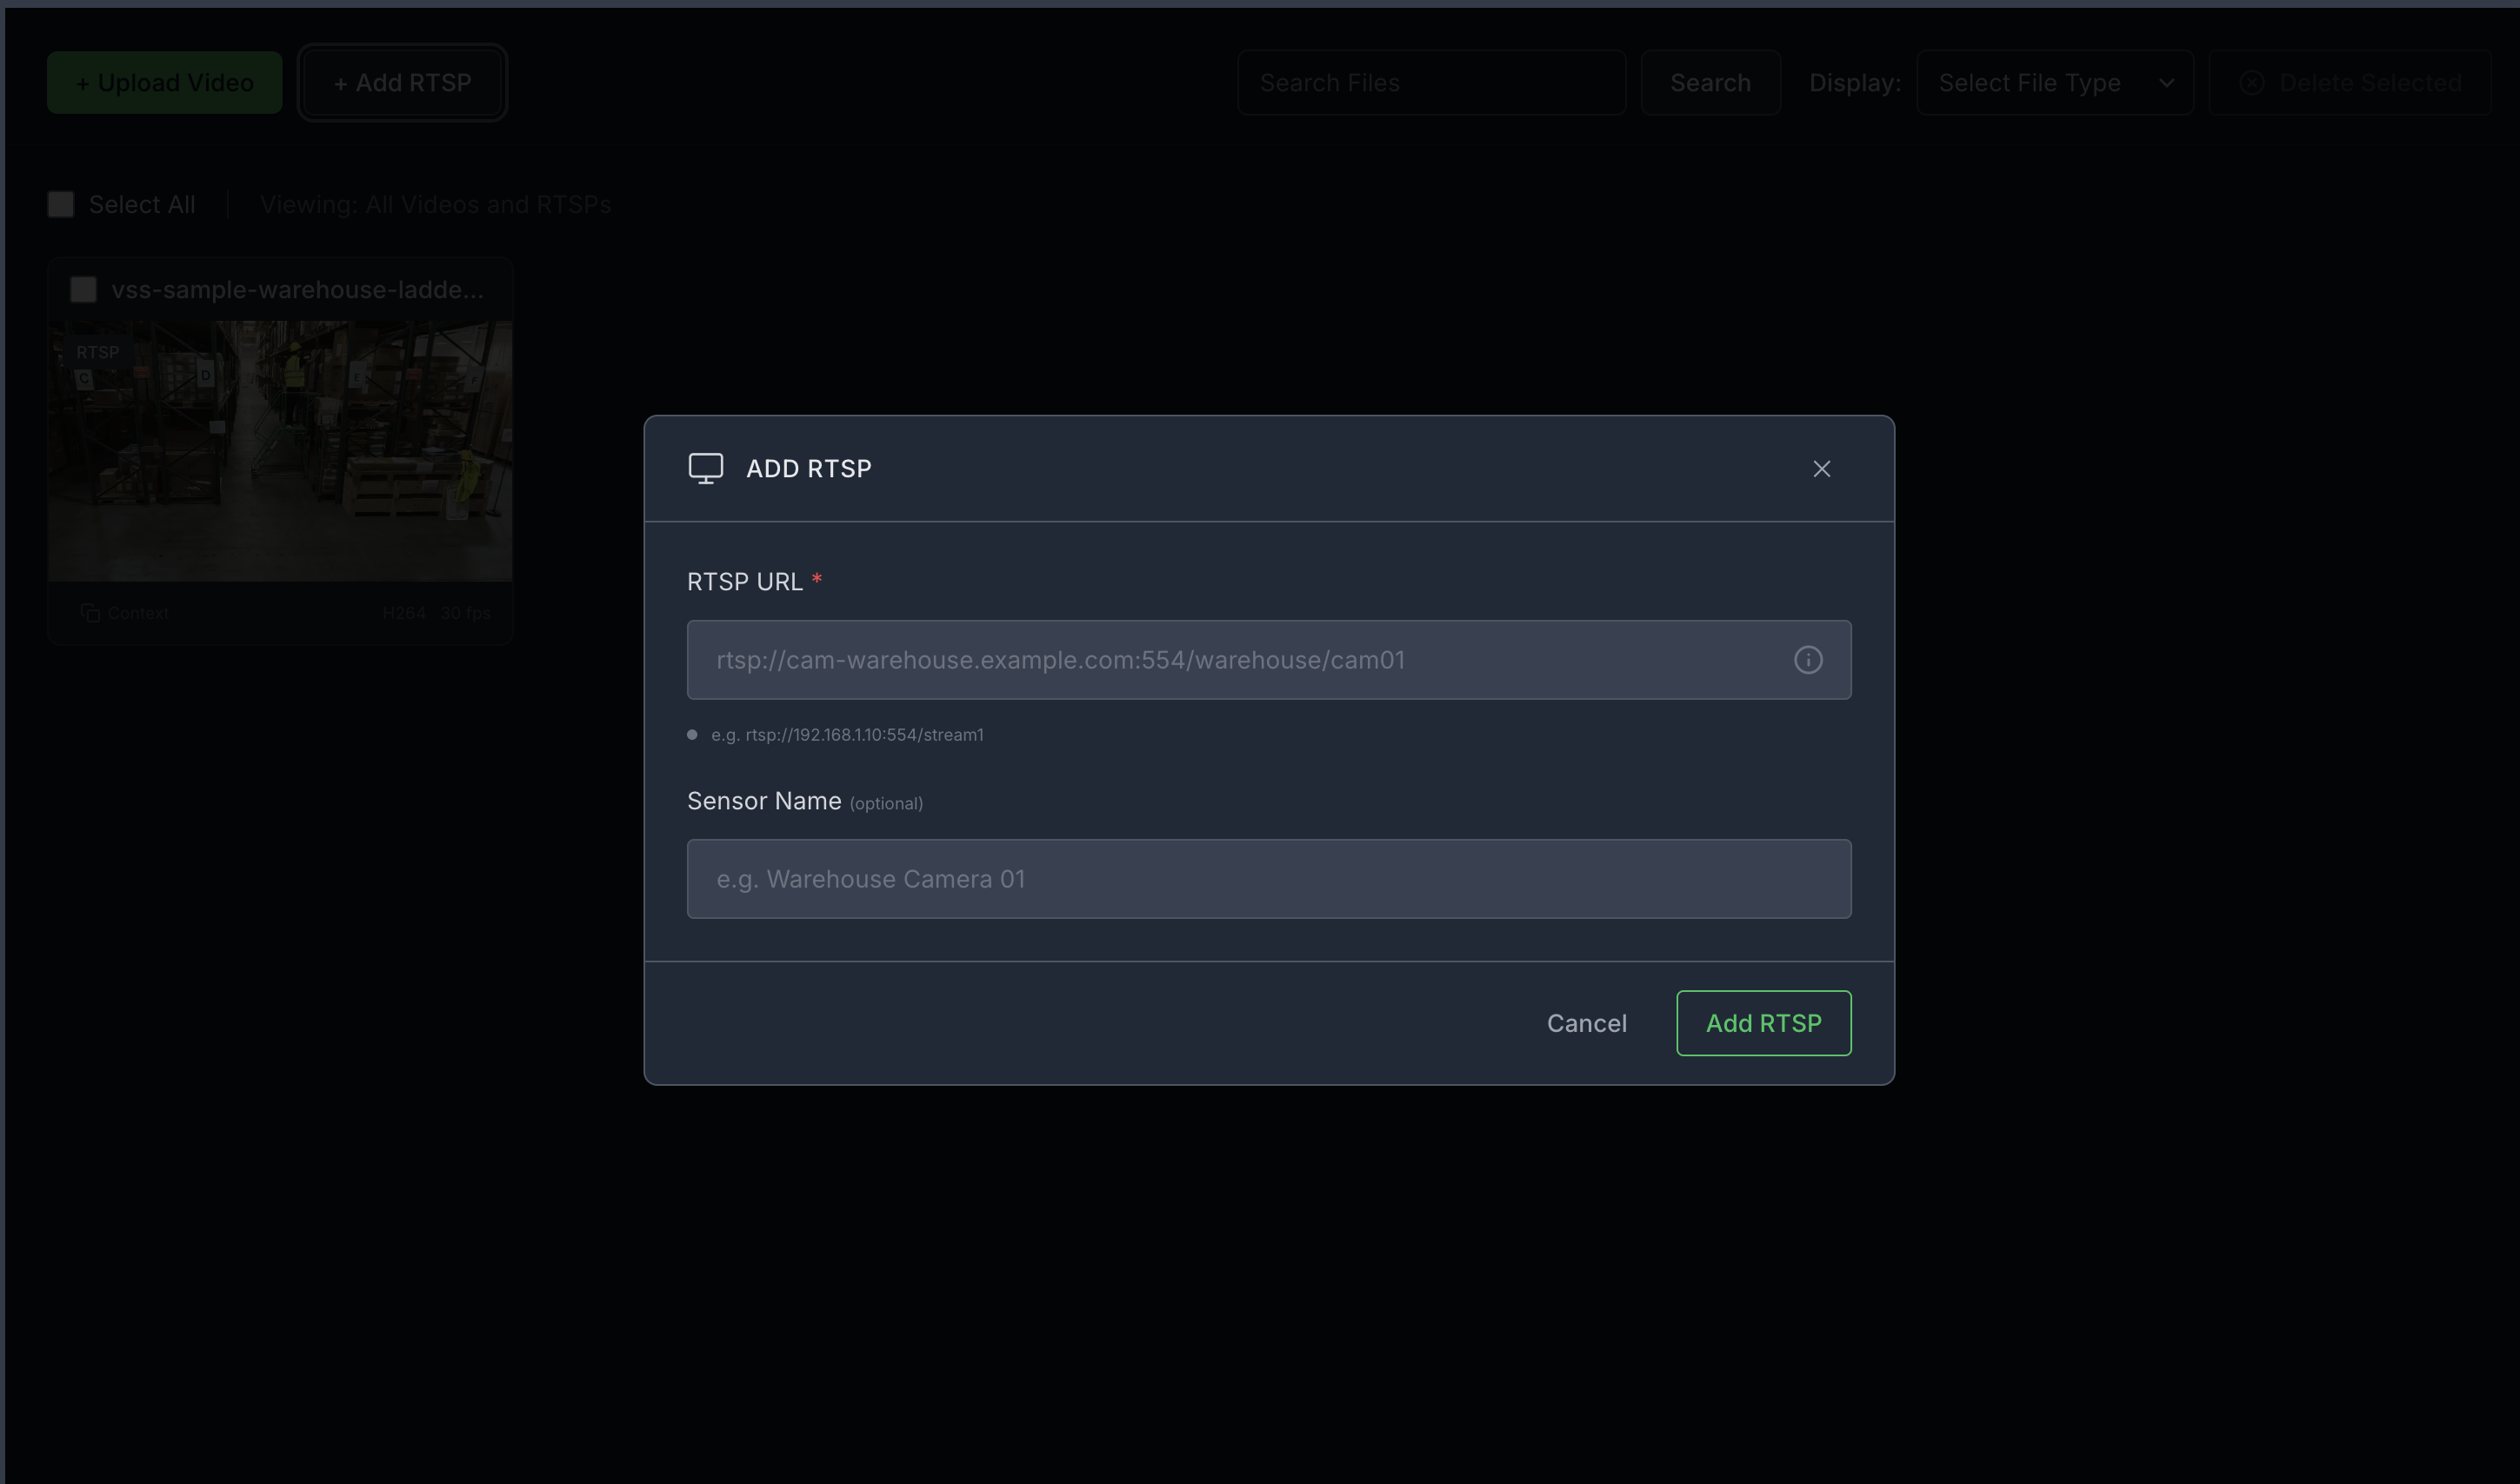
Step 2: Add a video stream#
Add an RTSP stream by clicking the “+ Add RTSP” button under the “Video Management tab” on the agent UI. If you do not have an RTSP stream, you can use NVStreamer at http://<HOST_IP>:31000 to upload a video file and create an RTSP stream.
For this profile, use the sample-warehouse-ladder.mp4 stream.
Note
By default, this profile only supports up to one stream being processed at a time.
This can be increased by modifying the NUM_STREAMS environment variable in the deployments/developer-workflow/dev-profile-alerts/.env file before deployment. On RTX PRO 6000, up to 4 streams at 10fps have been tested to work.
On edge platforms like DGX Spark, IGX Thor, and AGX Thor, up to 1 stream at 10fps has been tested to work due to GPU requirements.
Step 3: Verify pipeline components#
Open the Kibana UI at http://<HOST_IP>:5601/app/home#/ and navigate to the Discover tab.
Verify the following data indices are populated, it may take a few minutes for data to start appearing after adding the stream:
mdx-raw-*- Raw detection datamdx-incidents-*- Generated incidentsmdx-vlm-incidents-*- VLM-verified alerts
Step 4: View alerts in the Agent UI#
Launch the Agent UI at http://<HOST_IP>:3000/.
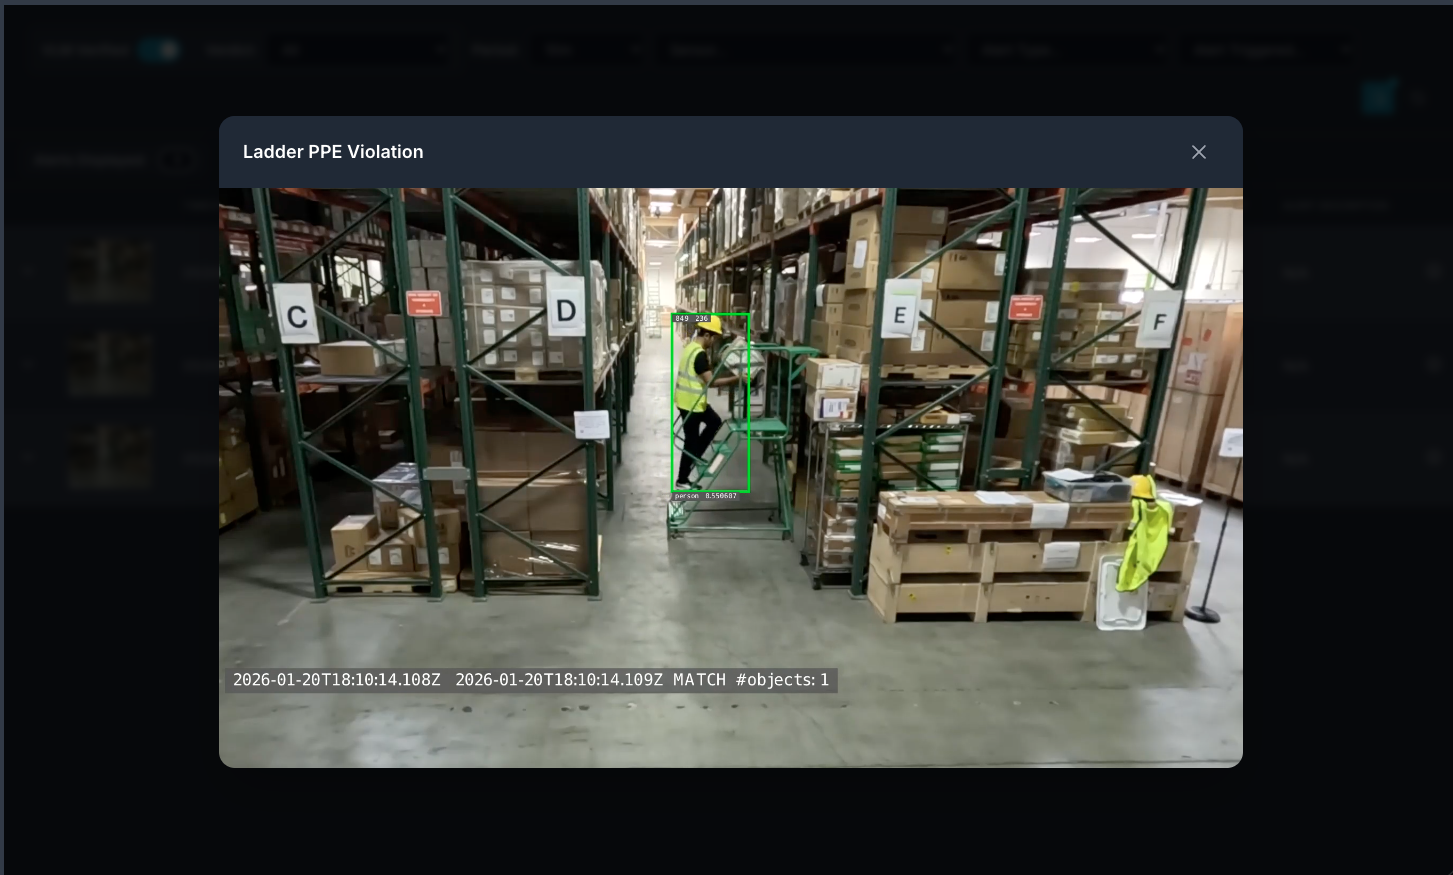
List streams to verify connectivity, then use the Alert Tab to list alerts. Select the verified alerts option to view VLM-verified alerts.
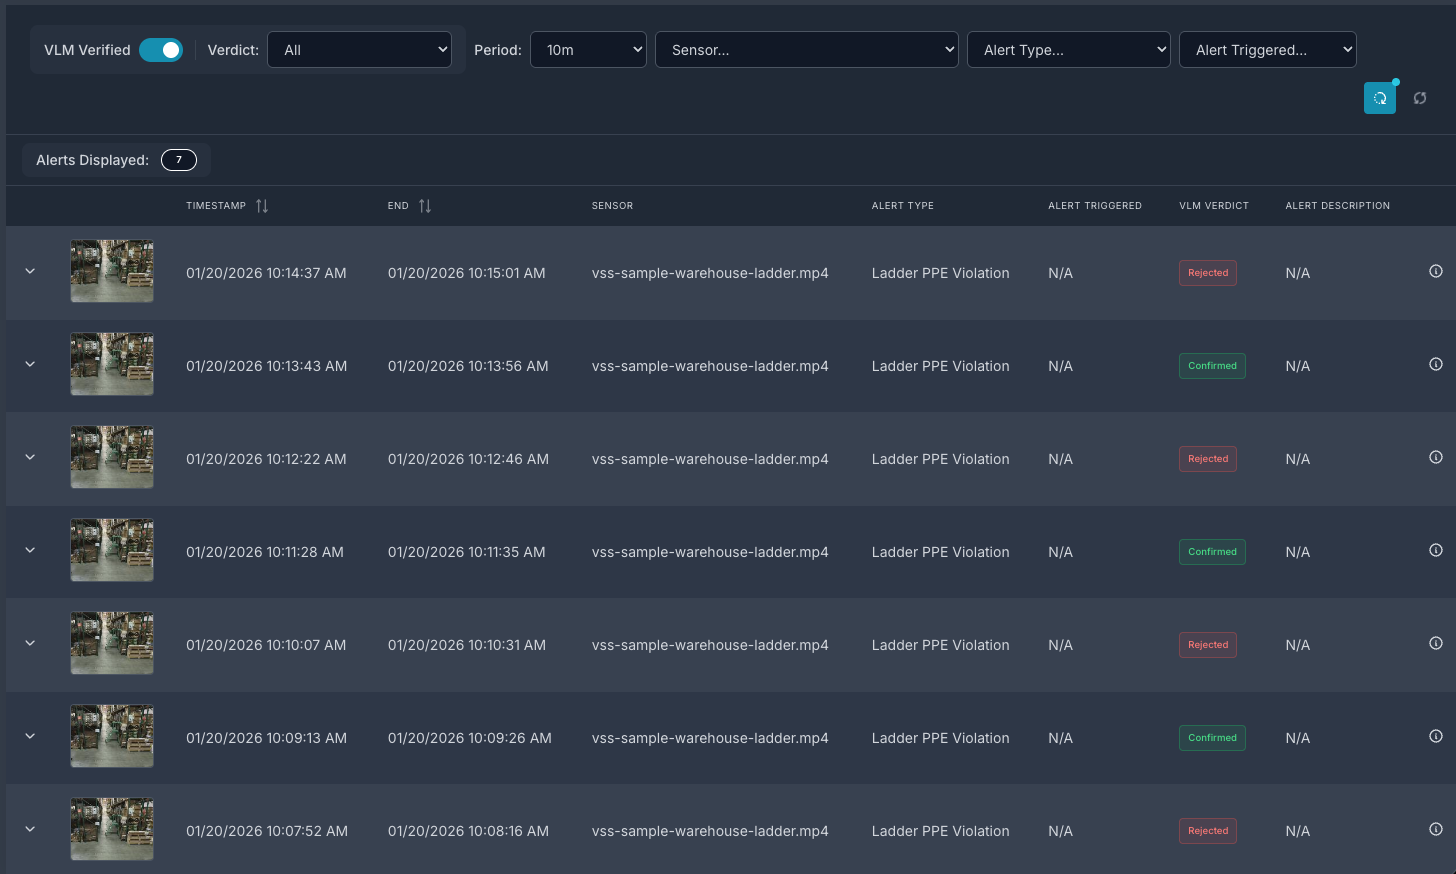
You can then click on a video thumbnail to play the video and view the alert. This will include overlay with bounding boxes over objects of interest.
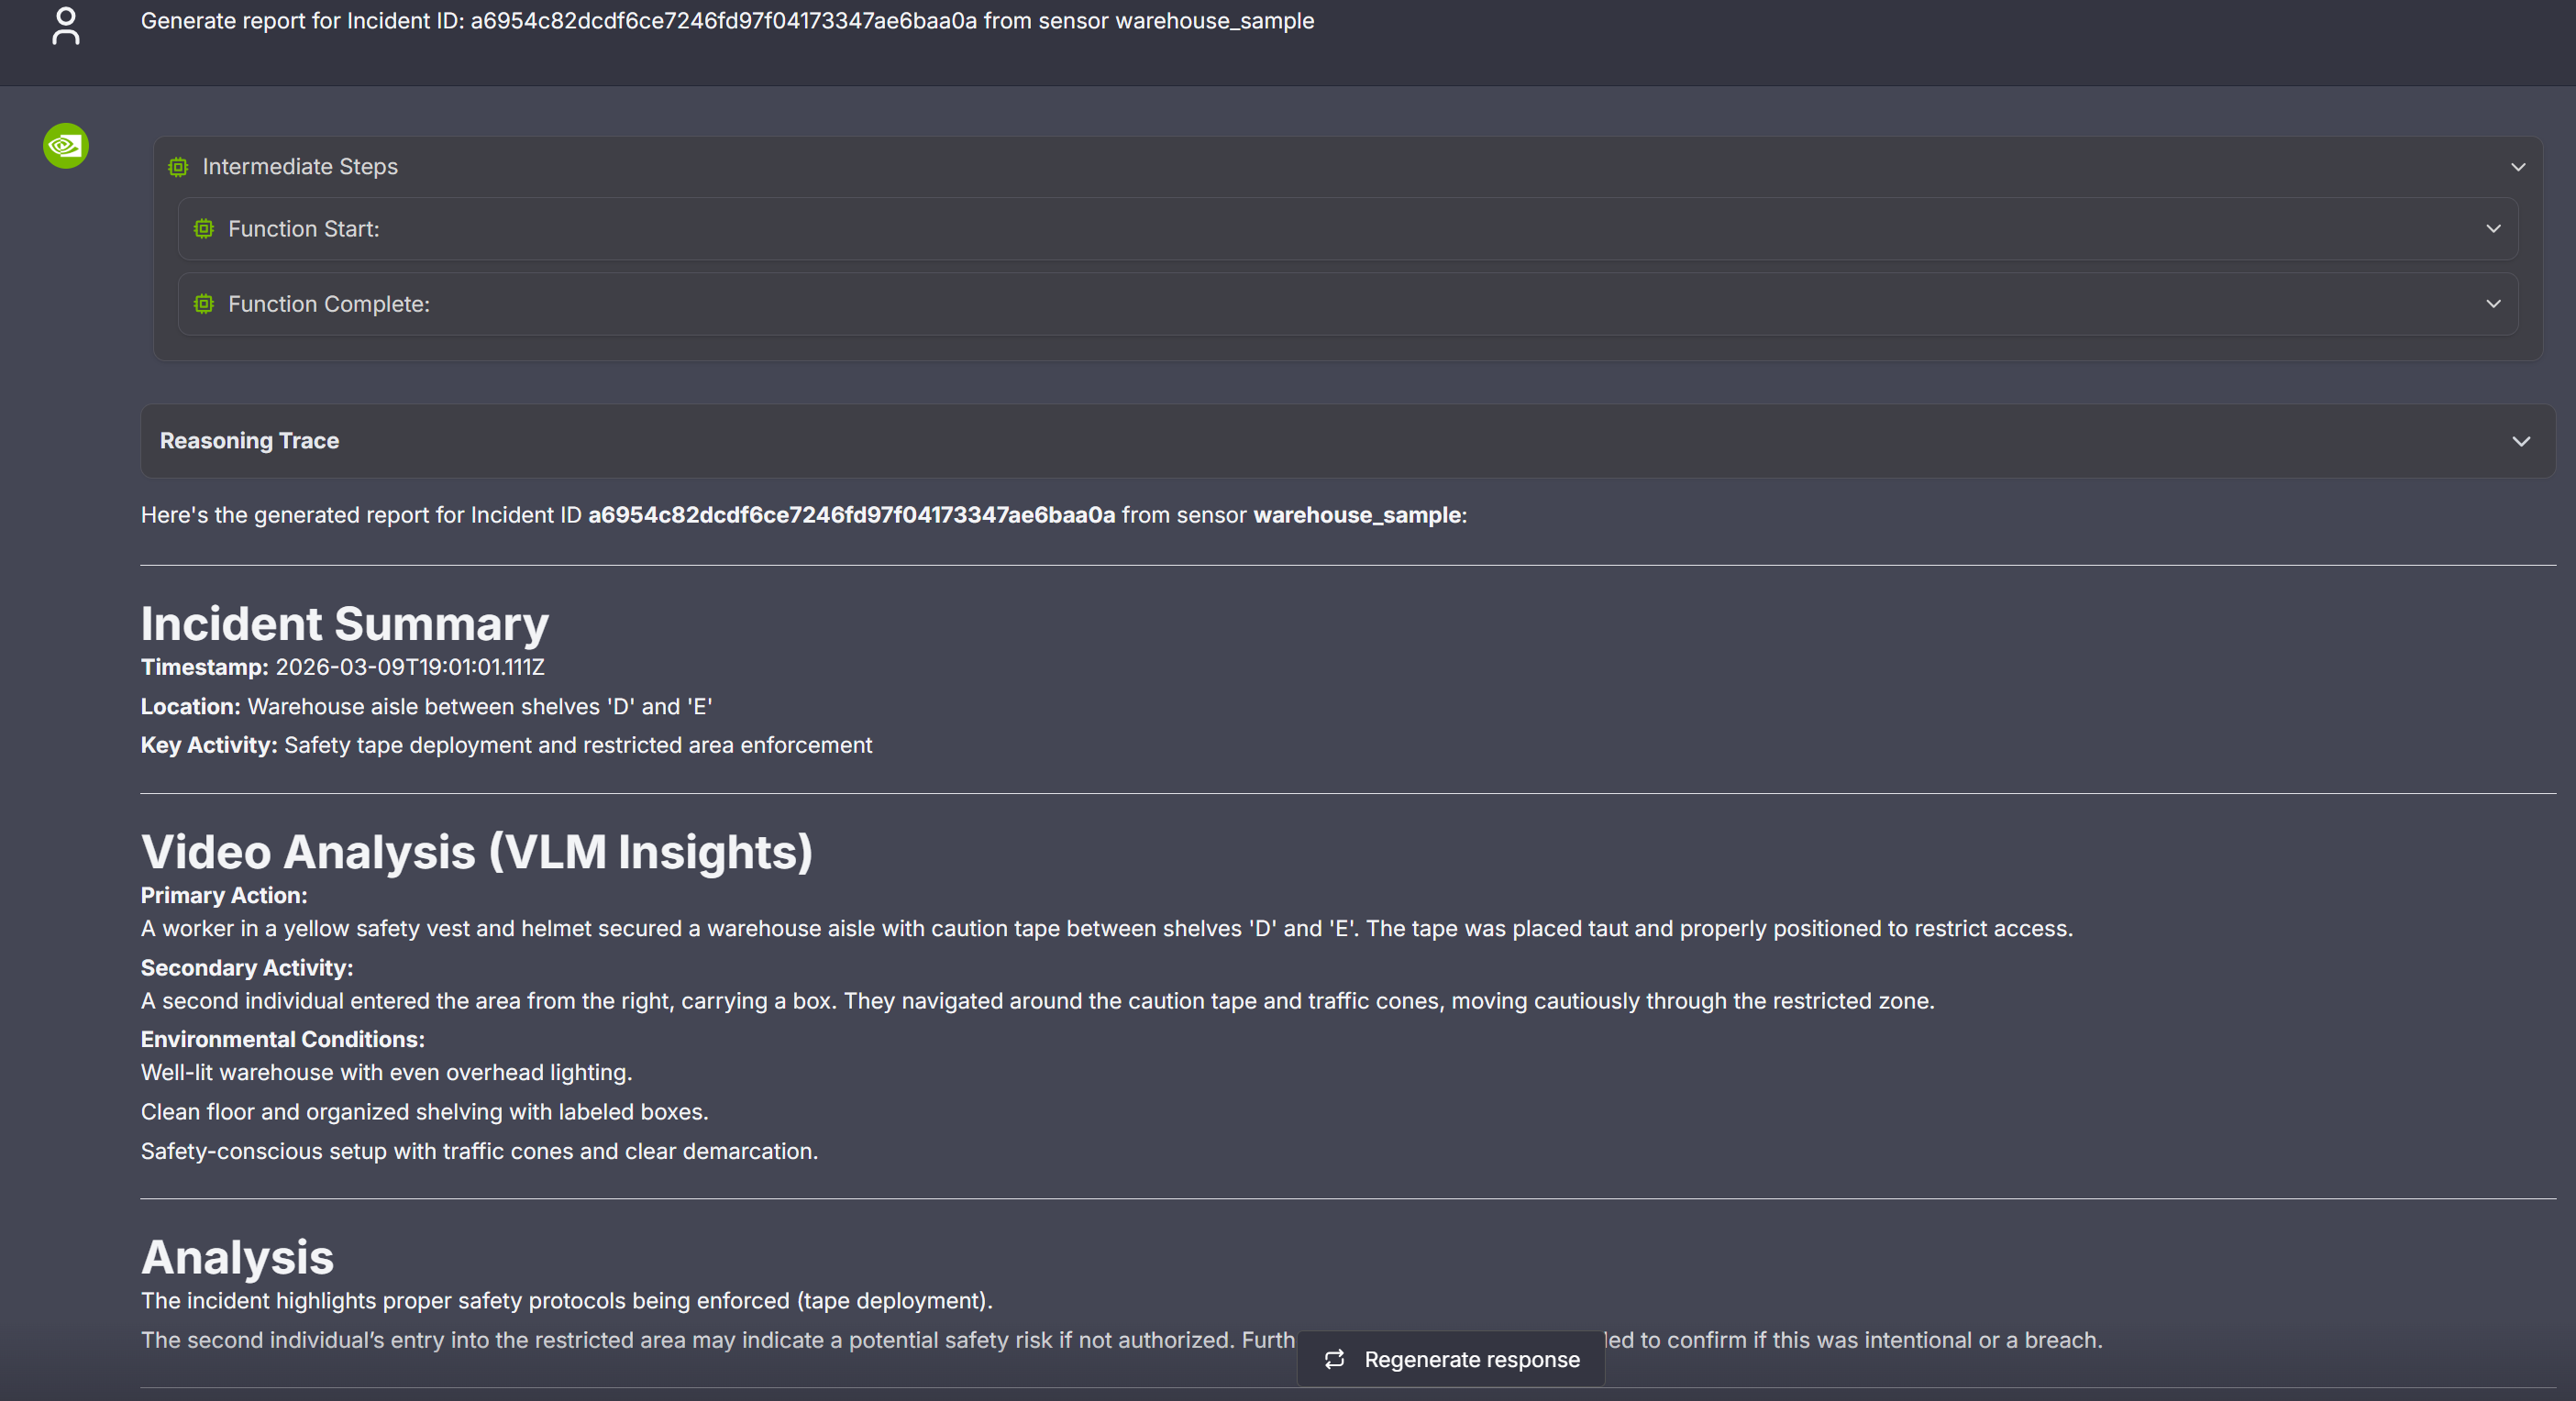
Step 5: Generate a Report for the Alert#
User can use the chat interface to request creation of a report for the generated alerts. The report is currently generated in markdown format and displayed in the VSS UI.
As part of the first step, identify the alert id for which the report needs to be generated. The chat interface could be used to retrieve the id by listing the recent alerts by a count; alternatively expand any of the alerts in the Alerts tab to display the “Id” along with various pieces of metadata associated with the alert.
Now, use the id to request generation of the report while also specifying the associated sensor as shown in the sample image below.
Step 6: Teardown the agent#
To teardown the agent, run the following command:
scripts/dev-profile.sh down
This command will stop and remove the agent containers.
Service Endpoints#
Once deployed, the following services are available:
Service |
URL |
|---|---|
VSS UI |
|
Kibana UI |
|
NVStreamer UI |
|
VST UI |
|
Phoenix UI |
|
Next Steps#
Once you’ve familiarized yourself with the alert verification workflow, you can explore:
Modifying the alert prompt in the Alert Verification Microservice configuration.
Adjusting rate limit settings to control alert verification frequency.
Configuring G-DINO prompting and class thresholds for custom detection scenarios.
Known Issues#
Some CR2 VLM inaccuracies might be observed with the public model.
Video snippets generated for alerts may be short (eg: only couple of seconds) depending on behavior analytics processing of the specific video, which could impacting VLM accuracy. To address this issue, modify the fovCountViolationIncidentThreshold setting to desired minimal alert clip duration within this file deployments/developer-workflow/dev-profile-alerts/vss-behavior-analytics/configs/vss-behavior-analytics-kafka-config.json
Video playback duration for verified alerts may not exactly match the alert timestamps.
Report generation may not work correctly with this profile.
In the event perception crashes and restarts, streams are not automatically readded and alerts will not be generated.
For remote VLM and LLM deployments, the alert verification timeout may need to be increased from the default value of 5 seconds. See Alert Verification VLM Configuration Options for specific details.