Quickstart Guide - Docker Compose#
This Quickstart Guide provides a comprehensive step-by-step walkthrough to help you quickly set up and start using the Smart City Blueprint with Docker Compose, based on the VSS 3.0 framework.
Components Overview#
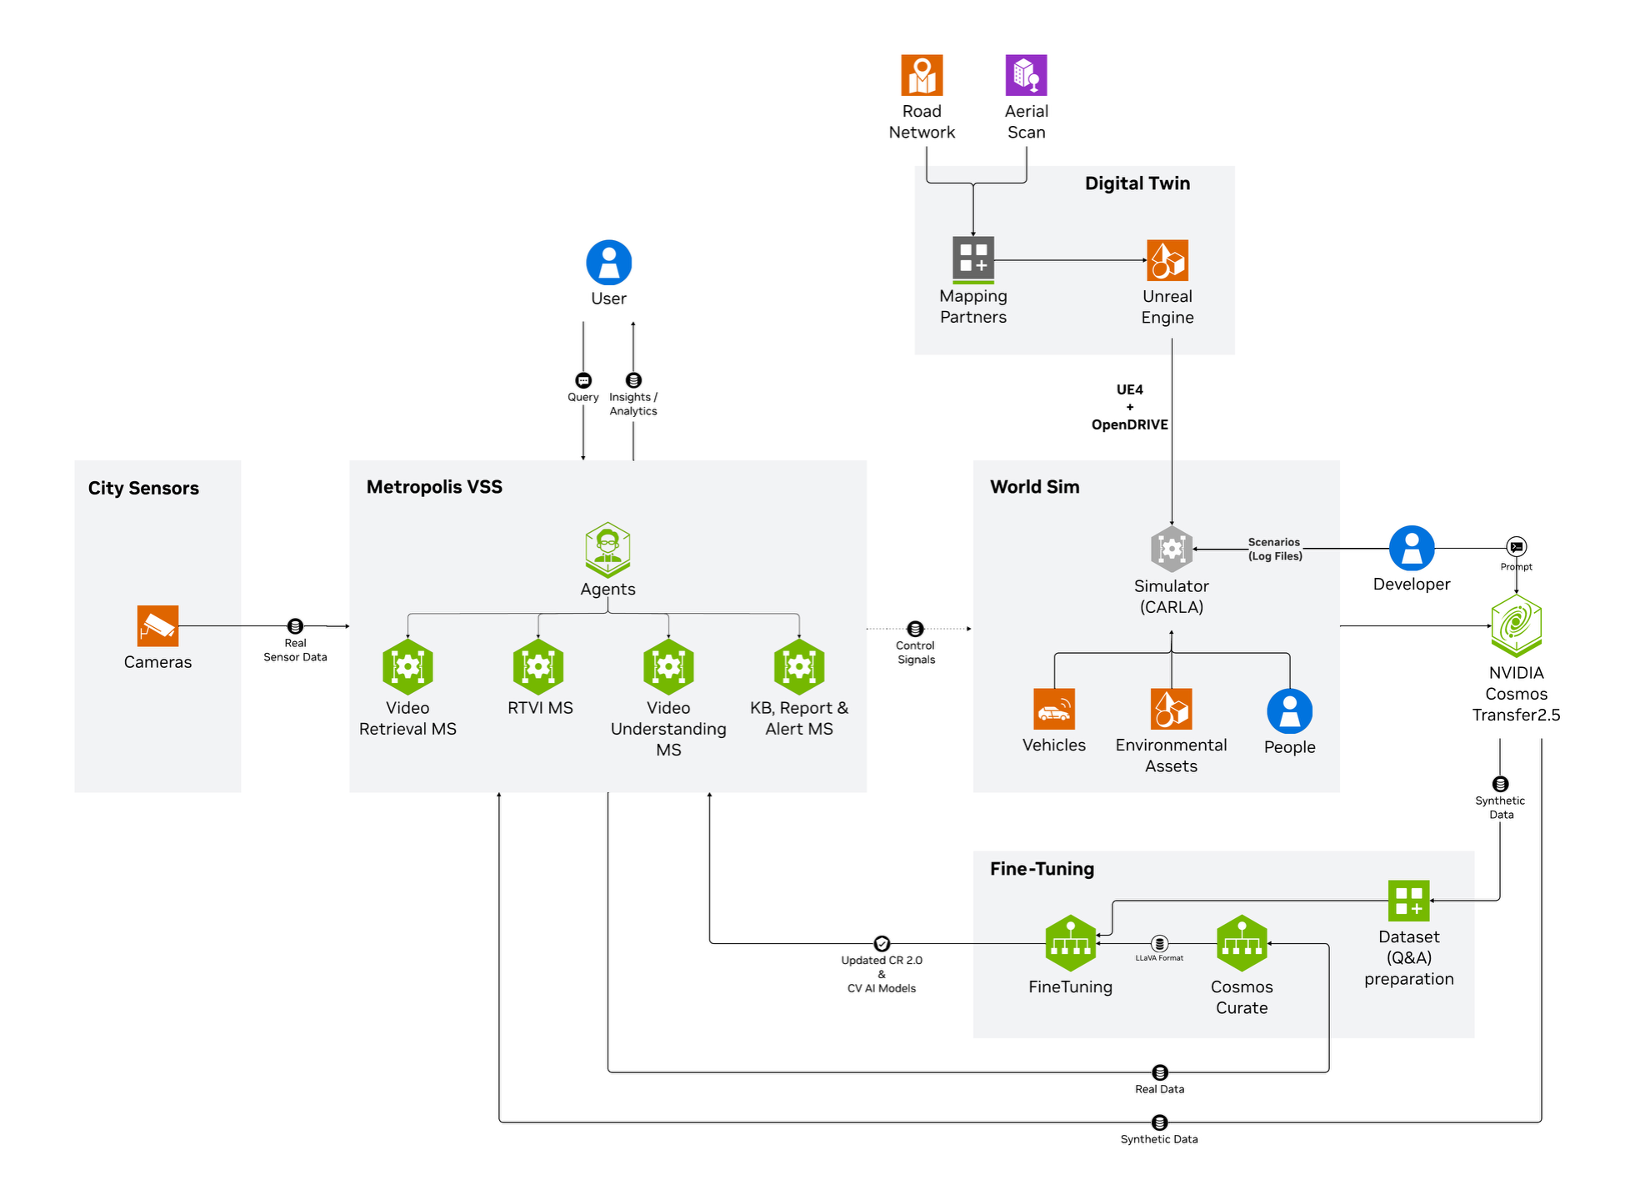
The high-level diagram illustrates the components of the Smart City Blueprint. The system features a layered architecture based on VSS 3.0 that comprises:
Foundational Microservices - Based on vision language models (VLMs) and computer vision (CV) models
Real-time Video Processing Pipelines - For processing live camera feeds
AI Agents - For intelligent analysis and interaction
Prerequisites#
Before you begin, ensure all of the prerequisites are met. See the Prerequisites page for more details.
Deployment Options#
The Smart City Blueprint provides a unified deployment profile that includes all available features:
bp_smc - Smart City Blueprint
CV-based perception using GDINO or RTDETR models via the RTVI Microservice
VLM-based verification for enhanced alert accuracy via the Alert Verification Microservice
Agents and Agent UI for natural language interaction with the system via the VSS Agents Microservice
Integration options:
API
Kibana dashboard
Kafka event streams
Web UI with map view
Supported Workload#
This section provides details of supported stream count for each model deployment configuration per supported GPU. The goal is to enable the user to scope the supported workload ensuring optimal operation of the blueprint, while taking into account resource availability based on GPUs available at their disposal.
GPU Type |
Number of Streams (RTDETR) |
Number of Streams (GDINO) |
Number of GPUs |
Number of GPUs |
Number of GPUs |
|---|---|---|---|---|---|
Local VLM+LLM (dedicated GPU each) (default) |
Local VLM+LLM (shared GPU) |
Remote VLM+LLM |
|||
H100 |
30 |
12 |
3 |
2 |
1 |
L40S |
30 |
6 |
3 |
NA |
1 |
RTX PRO 6000 Blackwell |
30 |
12 |
3 |
2 |
1 |
Note
Above numbers are based on the default configurations using streams at 1080p 10fps
To use GDINO instead of RTDETR (default), update
MODEL_NAME_2DtoGDINOand modifyNUM_SENSORSbased on your GPU capabilities in the.envfile
Install Smart City Blueprint#
The following section will guide you through the steps to install the Smart City Blueprint.
Setup NGC Access#
# Setup NGC access
export NGC_CLI_API_KEY={your NGC_CLI_API_KEY}
export NGC_CLI_ORG='nvidia'
Obtain Google Maps API Key#
See Prerequisites for more details.
Create Data Directory#
# Create directory for mdx-data
export MDX_DATA_DIR={some path to a directory where data, videos etc will be placed}
mkdir -p ${MDX_DATA_DIR}
Download Sample Data#
# Download sample data
ngc \
    registry \
    resource \
    download-version \
    nvidia/vss-smartcities/vss-smartcities-app-data:3.1.0

tar \
    -xzf \
    vss-smartcities-app-data_v3.1.0/smartcities-app-data.tar.gz \
    -C ${MDX_DATA_DIR} \
    --strip-components=1 \
    --exclude='*/Agnew_left_turn.mp4' \
    --exclude='*/Agnew_rear_end.mp4' \
    --exclude='*/Agnew_sideswipe_1.mp4' \
    --exclude='*/Agnew_sideswipe_2.mp4'

chmod -R 777 ${MDX_DATA_DIR}/data_log

rm -rf vss-smartcities-app-data_v3.1.0
Download Models#
For more information about the models, see the RTVI Microservice page.
# Download models
mkdir -p ${MDX_DATA_DIR}/models/rtdetr-its
mkdir -p ${MDX_DATA_DIR}/models/gdino

ngc \
    registry \
    model \
    download-version \
    nvidia/tao/trafficcamnet_transformer_lite:deployable_resnet50_v2.0

mv \
    trafficcamnet_transformer_lite_vdeployable_resnet50_v2.0/resnet50_trafficcamnet_rtdetr.fp16.onnx \
    ${MDX_DATA_DIR}/models/rtdetr-its/model_epoch_035.fp16.onnx

rm -rf trafficcamnet_transformer_lite_vdeployable_resnet50_v2.0

ngc \
    registry \
    model \
    download-version \
    nvidia/tao/mask_grounding_dino:mask_grounding_dino_swin_tiny_commercial_deployable_v2.1_wo_mask_arm

mv \
    mask_grounding_dino_vmask_grounding_dino_swin_tiny_commercial_deployable_v2.1_wo_mask_arm/mgdino_mask_head_pruned_dynamic_batch.onnx \
    ${MDX_DATA_DIR}/models/gdino/mgdino_mask_head_pruned_dynamic_batch.onnx

rm -rf mask_grounding_dino_vmask_grounding_dino_swin_tiny_commercial_deployable_v2.1_wo_mask_arm

chmod -R 777 ${MDX_DATA_DIR}/models
Setup Compose Files#
# Setup compose
mkdir -p ~/vss-blueprints
cd ~/vss-blueprints

ngc \
    registry \
    resource \
    download-version \
    nvidia/vss-smartcities/vss-smartcities-compose:3.1.0

tar \
    -zxvf \
    vss-smartcities-compose_v3.1.0/deploy-smartcities-compose.tar.gz

rm -rf vss-smartcities-compose_v3.1.0
Configure Environment Variables#
# Update smartcities/.env file
cd deployments
export HARDWARE_PROFILE={your hardware profile. One of H100, L40S, RTXPRO6000BW}
export MDX_SAMPLE_APPS_DIR="$(realpath .)"
export HOST_IP="$(ip route get 1.1.1.1 | awk '/src/ {for (i=1;i<=NF;i++) if ($i=="src") print $(i+1)}')"
export GOOGLE_MAPS_API_KEY={your GOOGLE_MAPS_API_KEY}

sed -i \
    -e "s|^MDX_SAMPLE_APPS_DIR=.*|MDX_SAMPLE_APPS_DIR=\"${MDX_SAMPLE_APPS_DIR}\"|" \
    -e "s|^MDX_DATA_DIR=.*|MDX_DATA_DIR=\"${MDX_DATA_DIR}\"|" \
    -e "s|^HOST_IP=.*|HOST_IP=\"${HOST_IP}\"|" \
    -e "s|^NGC_CLI_API_KEY=.*|NGC_CLI_API_KEY=\"${NGC_CLI_API_KEY}\"|" \
    -e "s|^GOOGLE_MAPS_API_KEY=.*|GOOGLE_MAPS_API_KEY=\"${GOOGLE_MAPS_API_KEY}\"|" \
    smartcities/.env
Note
To use GDINO instead of RTDETR (default), update
MODEL_NAME_2Dto GDINO andNUM_SENSORSappropriate for the hardware and model in thesmartcities/.envfile
Custom VLM Weights (Optional)#
The Smart City Blueprint supports using custom Vision Language Model (VLM) weights for specialized use cases. This section is optional.
Note
Skip this section if you are using the default VLM without custom weights.
If you need to use custom VLM weights, first download them from NGC or Hugging Face. See the Appendix: Downloading Custom VLM Weights for detailed download instructions.
After downloading custom weights, update the .env file to use them:
# Set the path to custom weights
export VLM_CUSTOM_WEIGHTS="</path/to/custom/weights>"

# Update the .env file
sed -i \
    -e "s|^# VLM_CUSTOM_WEIGHTS.*|VLM_CUSTOM_WEIGHTS=\"${VLM_CUSTOM_WEIGHTS}\"|" \
    smartcities/.env
Deploy the Blueprint#
Collision Clips Selection#
Multiple collision clips are available for the same intersection; however, to maintain correctness, only one can be processed at a time.
During the extraction process (as shown in the Download Sample Data section), we use the --exclude flag to bypass secondary clips.
Available Collision Clips:
Agnew_head_on.mp4Agnew_left_turn.mp4Agnew_rear_end.mp4Agnew_sideswipe_1.mp4Agnew_sideswipe_2.mp4
In our example, we excluded the last four collision clips and used only Agnew_head_on.mp4.
To test a different scenario, such as Agnew_sideswipe_2, follow these steps:
Extract
vss-smartcities-app-data.tar.gzas described in theDownload Sample Data sectionUpdate the exclusion list so that it omits the four other collision clips (i.e., keep only the clip you want to test).Edit the calibration file located at
smartcities/smc-app/calibration/sample-data/calibration.jsonand replace all references to Agnew_head_on with Agnew_sideswipe_2.Redeploy your stack.
Select Deployment Profile#
The default deployment profile bp_smc includes all Smart City Blueprint features (CV perception, VLM verification, and Agents).
The deployment supports different modes for LLM and VLM through LLM_MODE and VLM_MODE environment variables:
local- Deploy NIMs locally on dedicated GPUs (requires NGC_CLI_API_KEY)local_shared- Deploy LLM and VLM on a single shared GPU (requires NGC_CLI_API_KEY)remote- Use remote NIM endpoints (requires LLM_BASE_URL and VLM_BASE_URL)
To use remote NIM endpoints, modify the smartcities/.env file:
# Update to use remote NIM endpoints
# Set LLM_MODE=remote
# Set VLM_MODE=remote
# Set LLM_BASE_URL=http://<remote-host>:<llm-port>
# Set VLM_BASE_URL=http://<remote-host>:<vlm-port>
#
# Set LLM_NAME based on the provided remote LLM endpoint to any of
# - LLM_NAME=nvidia/nvidia-nemotron-nano-9b-v2
# - LLM_NAME=nvidia/nemotron-3-nano
# - LLM_NAME=nvidia/llama-3.3-nemotron-super-49b-v1.5
# - LLM_NAME=openai/gpt-oss-20b
#
# Set VLM_NAME based on the provided remote VLM endpoint to any of
# - VLM_NAME=nvidia/cosmos-reason2-8b
# - VLM_NAME=nvidia/cosmos-reason1-7b
# - VLM_NAME=Qwen/Qwen3-VL-8B-Instruct
Start the Blueprint#
# Docker login to the NGC docker registry
docker login \
    --username '$oauthtoken' \
    --password "${NGC_CLI_API_KEY}" \
    nvcr.io

# Start the blueprint
docker compose \
    --env-file smartcities/.env \
    up \
    --detach \
    --force-recreate \
    --build
Note
Initialization of some components might take a while, especially the first time as large containers will be pulled.
Note
The four sample SDG clips, one of which has a collision, are each 1 minute in length. Due to the length of the video, you should see collision alerts consistently appear once per minute since NVStreamer repeats clips upon completion.
Optional: Kibana dashboard for Alert Verification#
# Add a dashboard for alert verification in kibana
cd ${MDX_SAMPLE_APPS_DIR}/smartcities/smc-app/kibana-dashboard/init-scripts
bash vlm-alerts-template-setup.sh
cd ${MDX_SAMPLE_APPS_DIR}
Verify Deployment#
Verify if containers are in running state:
docker ps
docker compose ls
Check to make sure streams were properly added to VST. To do so, navigate to the VST UI (see endpoint below) and check the Dashboard to confirm your streams are in a healthy state. If you do not see them there, check NVStreamer or your source to make sure they are active.
Check Perception FPS to make sure DeepStream is running properly. View the Perception logs by running the below command and looking for FPS lines in the logs. Ensure it is running at the desired FPS (10fps with the sample streams). If this is lower than expected, make sure your GPU is not oversaturated.
docker logs -f perception-smc
Check Kibana for traffic statistics and alerts. Go to the endpoint listed below and navigate to the dashboard.
Check the VSS UI (see endpoint below) and test a few prompts after the system is up for a few minutes and a few alerts are present.
Endpoints#
Once deployed, the following endpoints are available:
Service |
Endpoint |
|---|---|
VSS-UI |
|
Video-Analytics-UI (Map View) |
|
Grafana-UI |
|
Kibana-UI |
|
NvStreamer-UI |
|
VST-UI |
|
Phoenix-UI (Telemetry) |
|
Service |
Endpoint |
|---|---|
Video-Analytics-API |
|
VST-MCP |
|
VA-MCP |
|
LLM-NIM |
|
VLM-NIM |
|
Add Streams (Optional)#
By default, Docker Compose deployments include 4 pre-configured streams. However, you can use the following scripts to add custom videos and sensors:
Run the provided /helper-scripts/nvstreamer_upload.py script to help upload streams to NVStreamer:
python3 /helper-scripts/nvstreamer_upload.py http://localhost:31000/nvstreamer/ 100 /path/to/videos-1/
Modify the command to change 100 to be the number of streams in the given folder, and /path/to/videos-1/ to the current directory you are trying to upload.
Run the provided /helper-scripts/add-nvstreamer-to-vst.py script to help add sensors from NVStreamer to VST:
python3 /helper-scripts/add-nvstreamer-to-vst.py --nvstreamer_endpoint=http://localhost:31000/nvstreamer --vst_endpoint=http://localhost:30888/vst/ --max_streams_to_add=<NUMBER_OF_STREAMS>
To delete sensors from VST, run the following command:
python3 /helper-scripts/add-nvstreamer-to-vst.py --vst_endpoint=http://localhost:30888/vst/ --delete_all=1
Explore the Blueprint#
Now that you have an up and running system, let’s explore the different features the Smart City Blueprint offers.
We will delve into the four salient features of the blueprint, namely: chat interface, alerts with VLM verification, metrics dashboard, and map visualization - using corresponding tabs on the top-left of the UI.
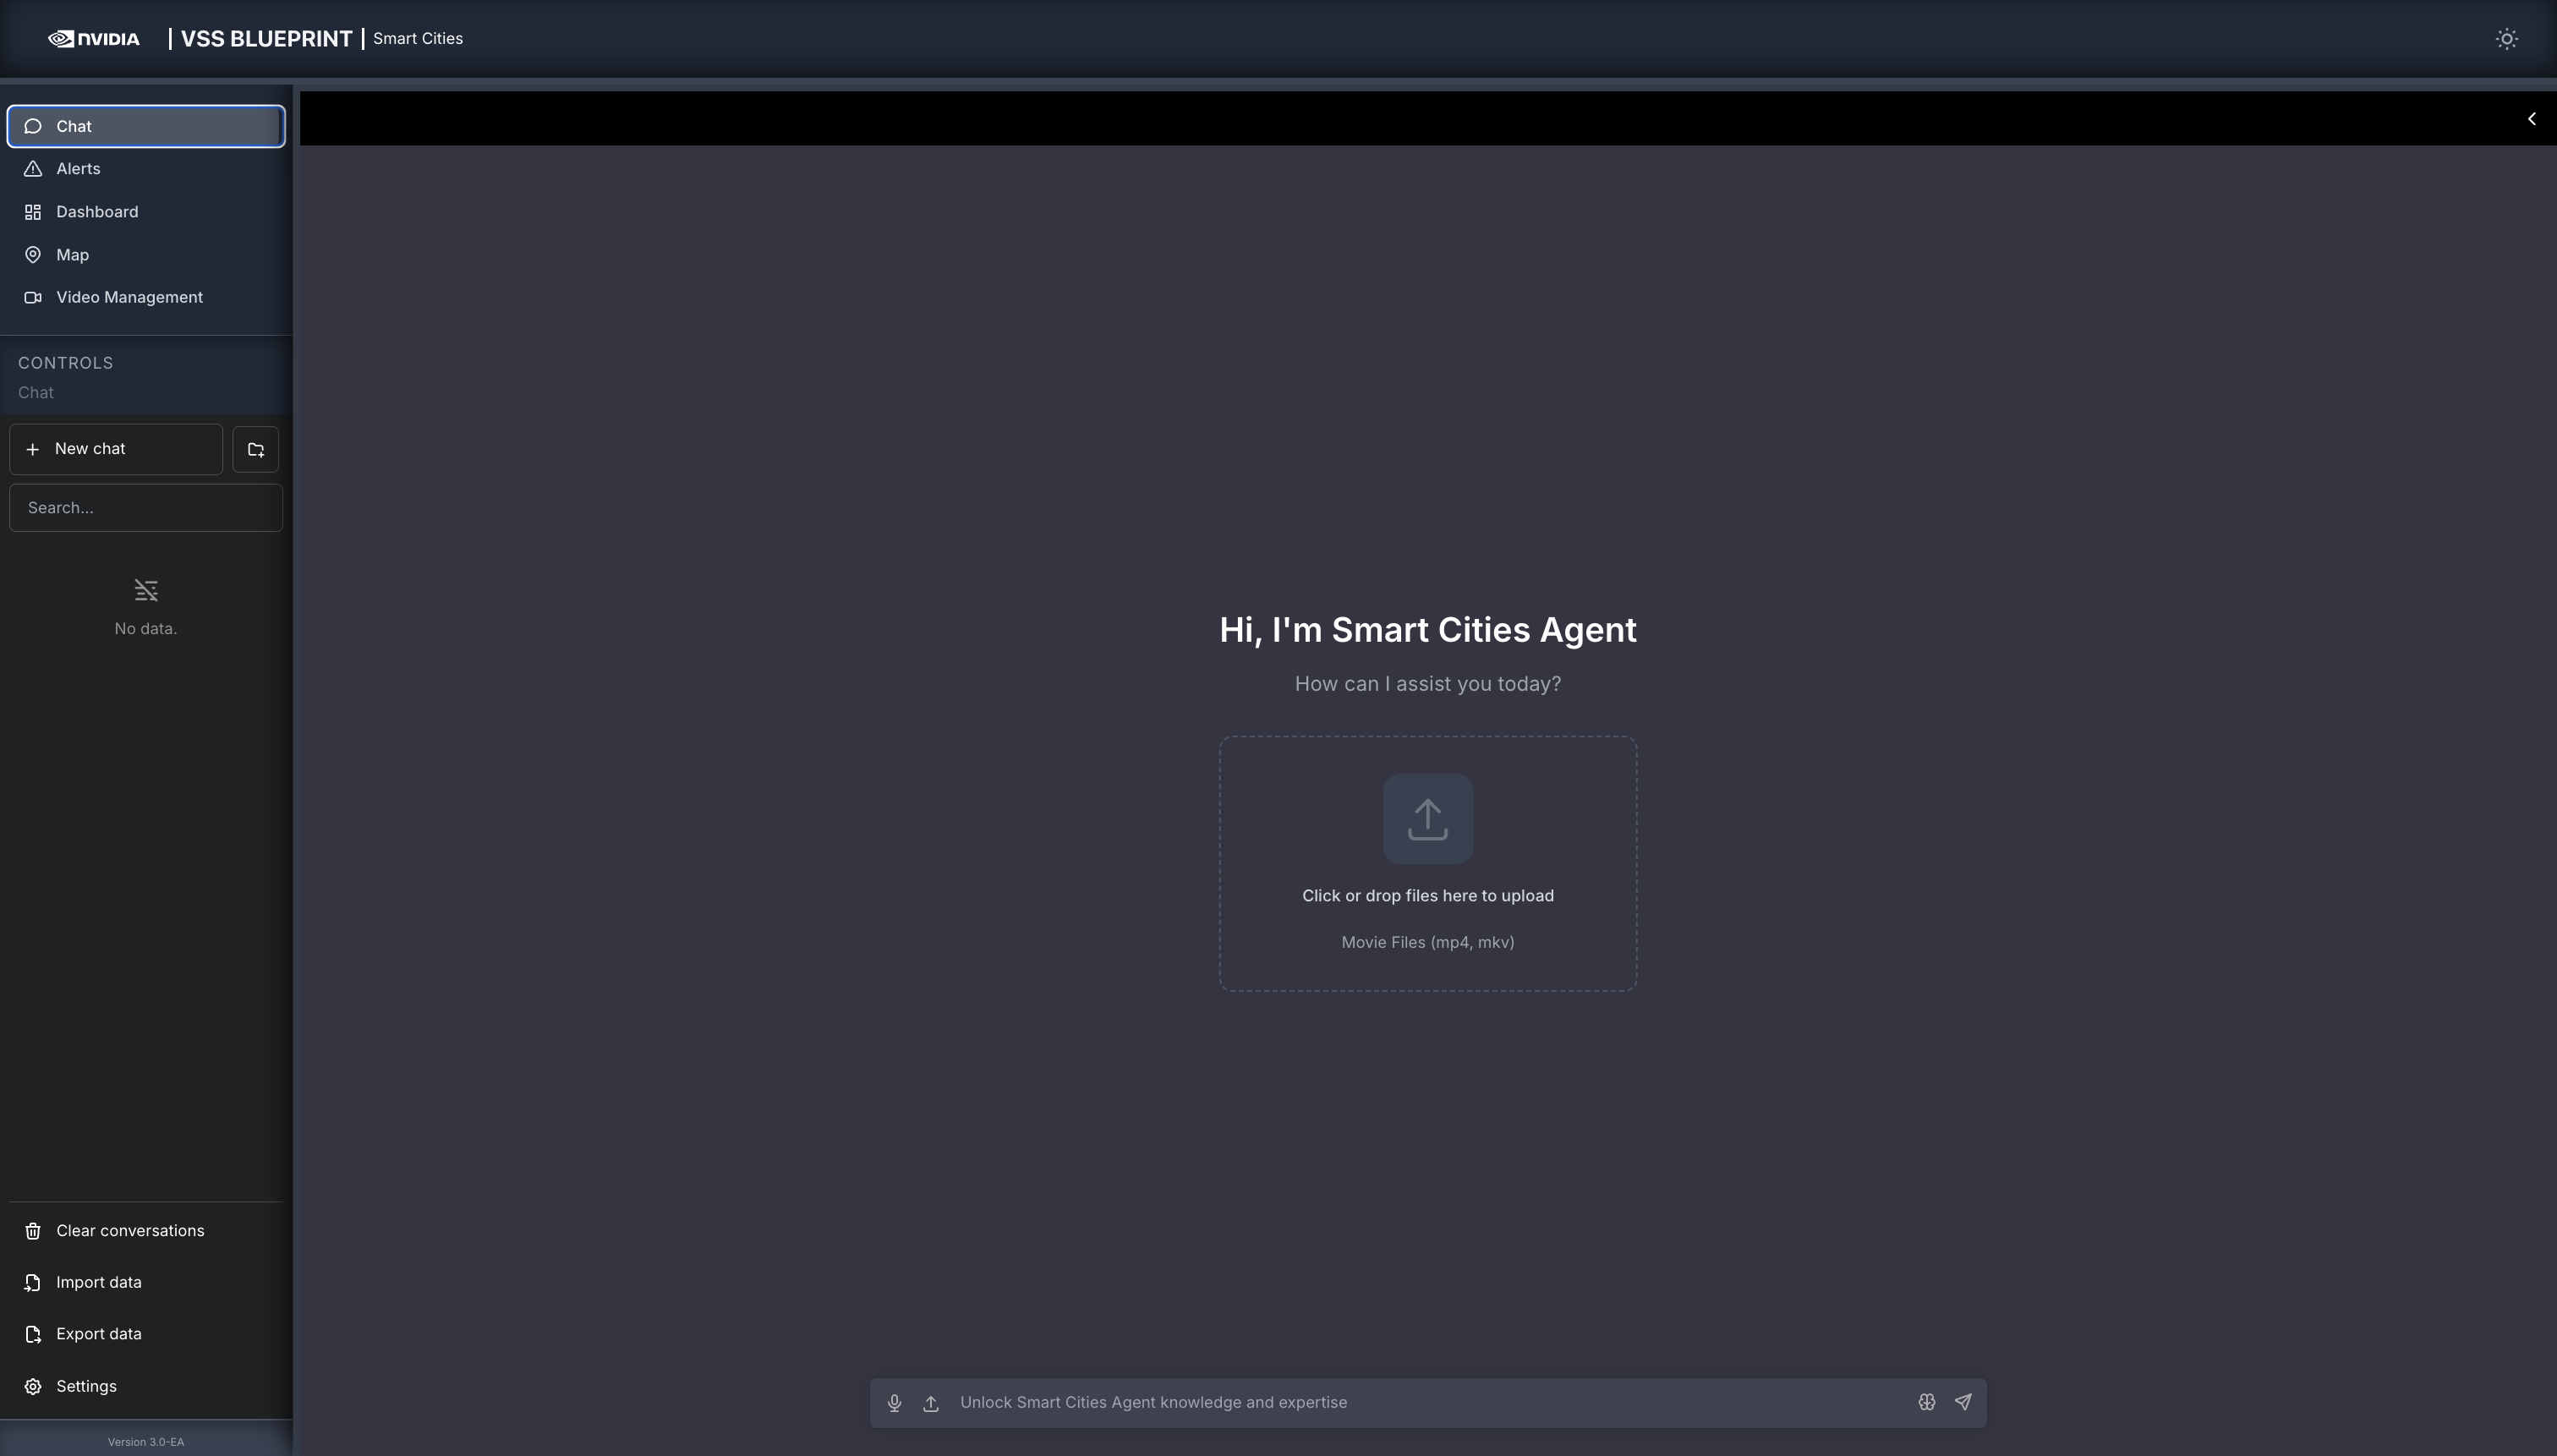
Chat#
The chat allows you to interact with the system in natural language. The system is optimized to understand the different sensors and situations such as alerts.
As a key intuition, it is important to interact with the sensor using the sensor IDs.
In the chat reference section below, we provide some typical prompts users can use to interact with the system. The reference below is organized from basic to advanced.
Quick Start Chat Reference
1. Sensor Discovery & Live Monitoring
Check Availability: “What sensors are available?”
Live View: “Can you take a snapshot of sensor [Sensor ID]?”
2. Searching for Incidents
You can filter incidents by count, specific time ranges, or location.
By Recent Activity: “List the last 5 incidents for [Sensor ID].”
By Time Window: “List all incidents from [Start Time] to [End Time] for sensor [Sensor ID].”
By Duration: “Retrieve all incidents for [Sensor ID] in the last 24 hours.”
By Location: “Retrieve all incidents for [Place Name].”
3. Reporting
Generate detailed summaries for specific events found in your search results.
Specific Incident: “Generate a report for incident [Incident ID].”
Most Recent: “Generate a report for the last incident at [Location/Sensor].”
4. Interactive Commands (Context Aware)
The system remembers your previous questions, allowing you to ask follow-ups without repeating details.
Drill-down:
User: “List the last 5 incidents for [Sensor ID].”
User: “Generate a report for the second one.”
Pagination:
User: “List all incidents in the past 24h.”
User: “Show the next 20 incidents.”
Clarification:
User: “Are there any incidents?”
System: “For which sensor?”
User: “[Sensor ID]”
Alerts#
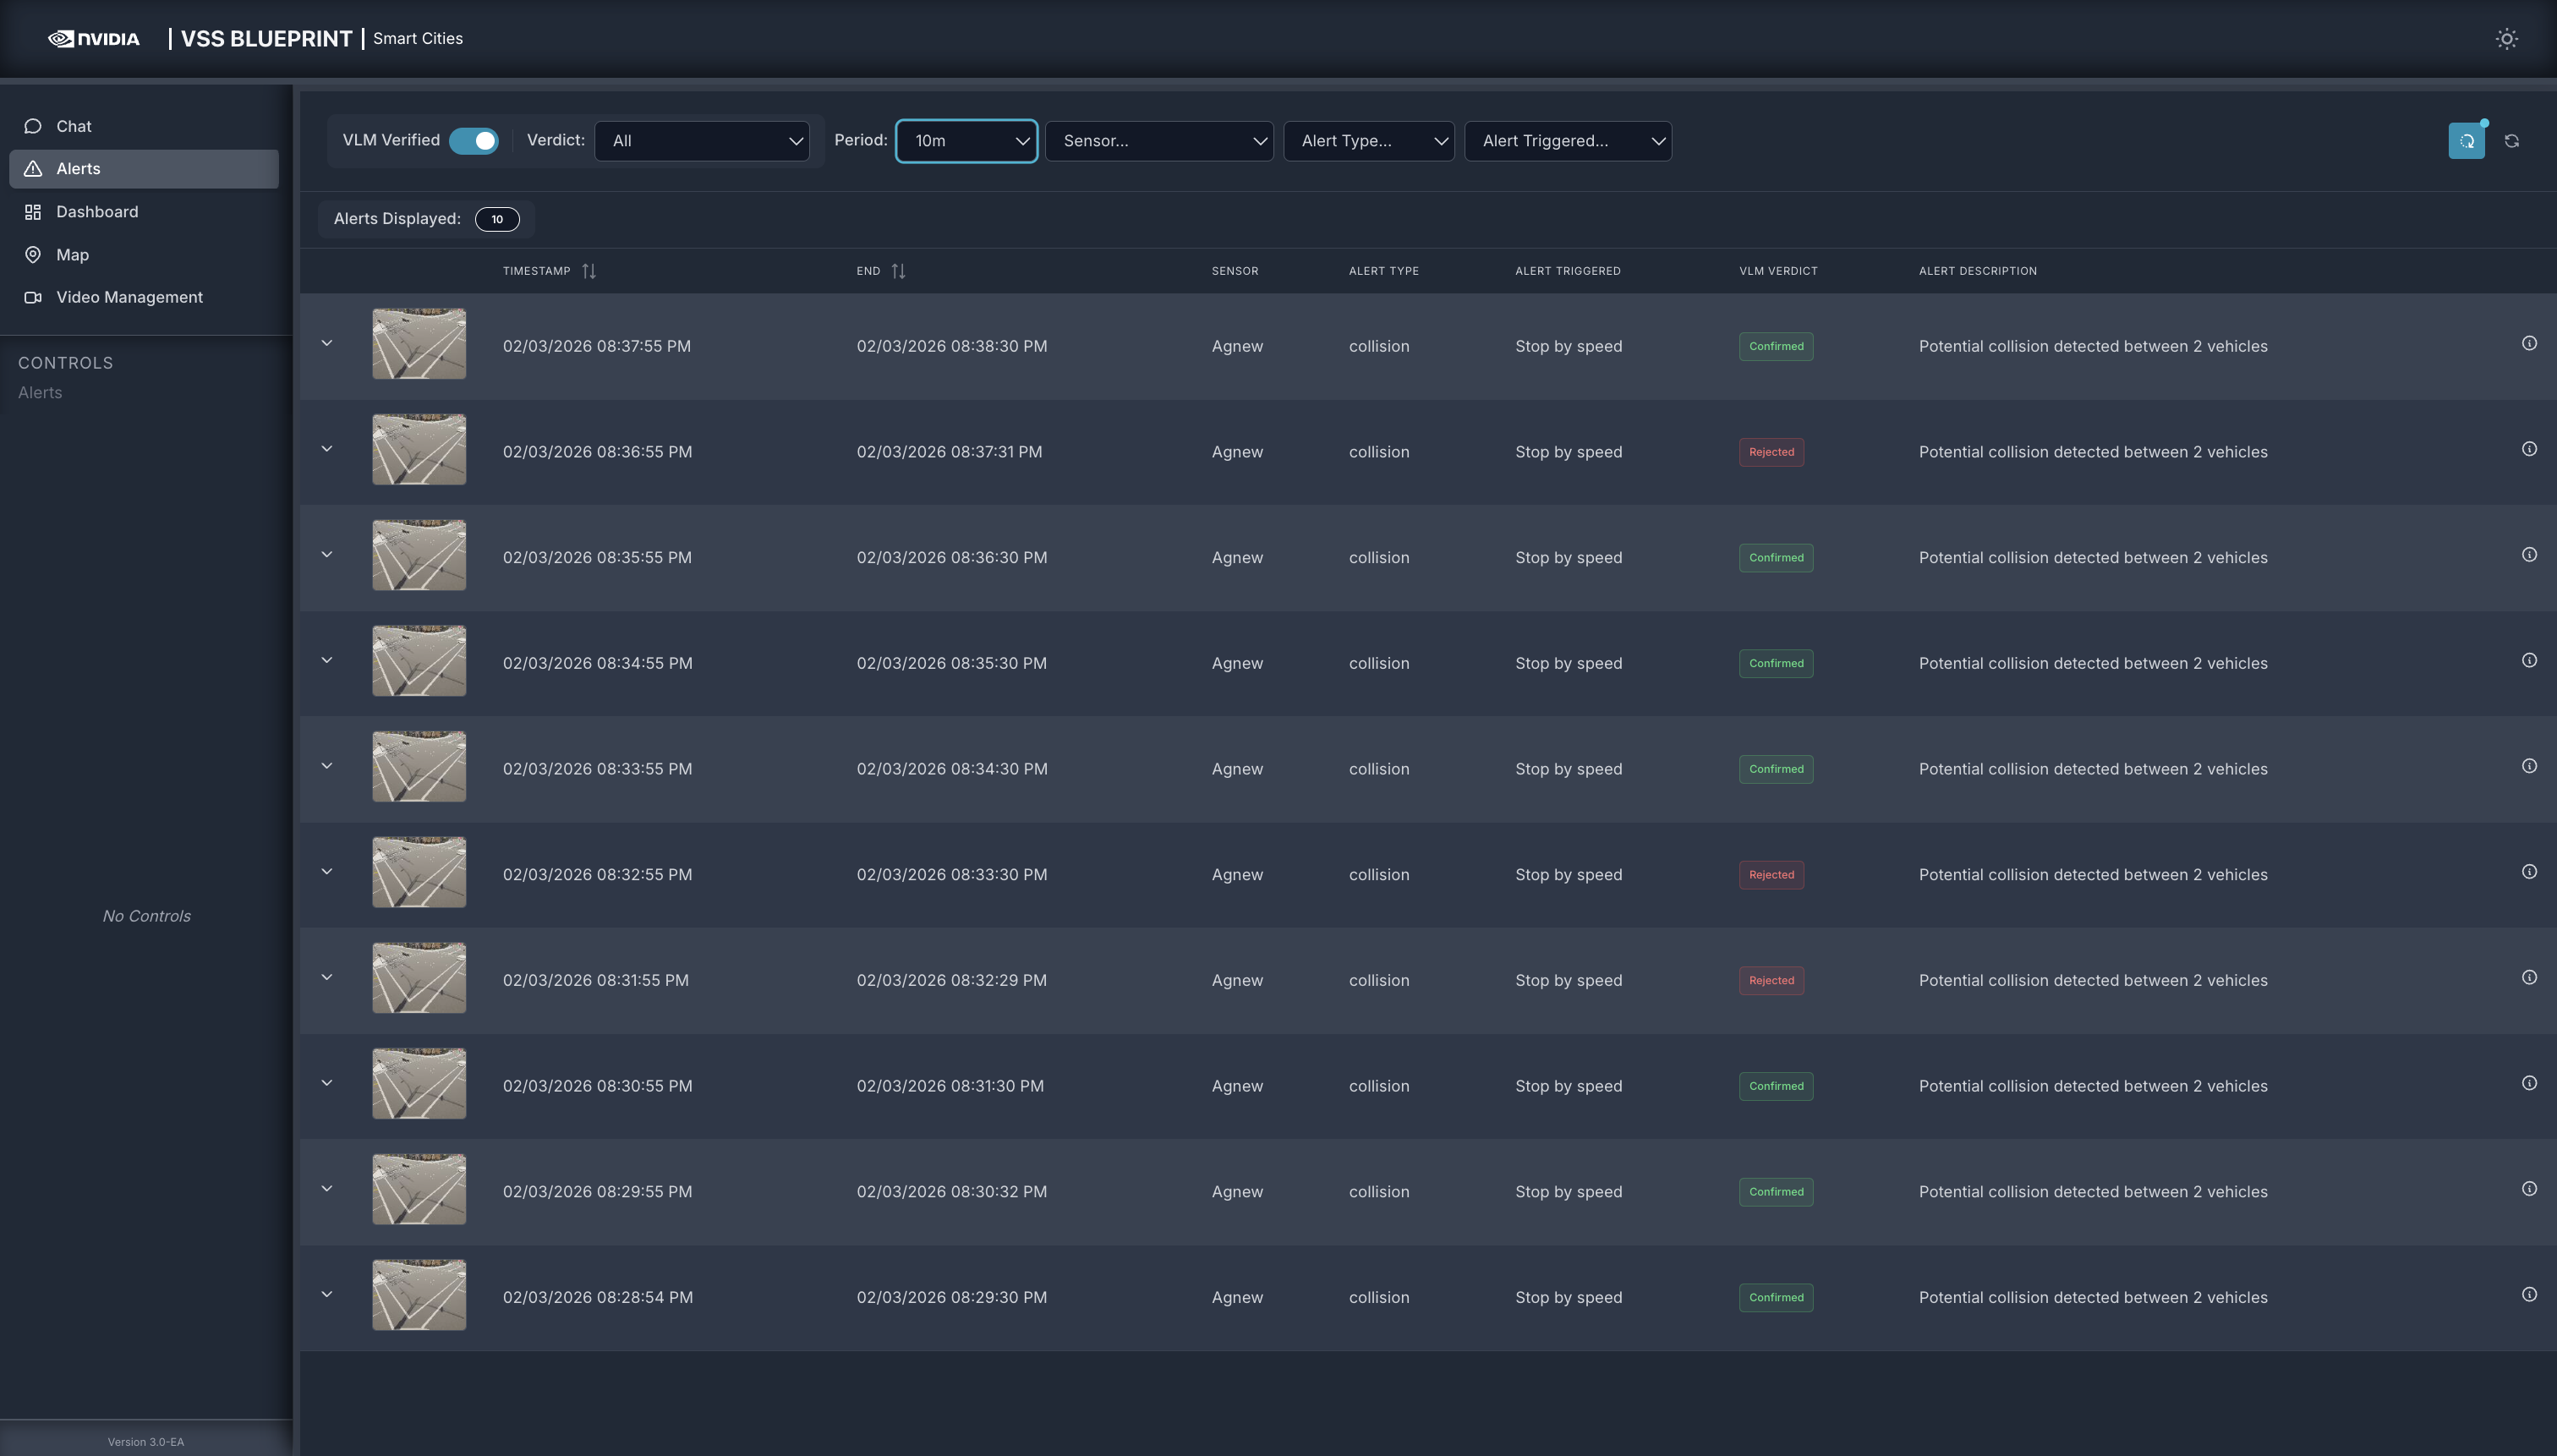
The Alerts tab is a centralized view of all alerts generated by the RTVI microservice. The alerts can be reviewed by using the different filters available in the system. Below is a table summarizing these filters:
Filter |
Description |
|---|---|
VLM Verified |
Toggle VLM verified to identify what the VLM alert verification has removed as a false positive. This provides a powerful insight into the value of VLMs as part of a real-time computer vision application. |
Verdict |
Expand your filter to identify alerts that have been either rejected or confirmed. There is a third status for verification failed, that can be used to identify potential system setup or configuration issues. |
Period |
Pulldown allows users to select the time period that the alert page should show. From the pull-down you can select between 10 minutes to two hours. In addition there is an option to enter a custom value. |
Sensor |
Pulldown with all sensors available in the system. |
Alert Type |
The current release only supports collision. This can be expanded as needed. |
Alert Triggered |
The alert triggered by can filter by:
|
Refresh frequency icon |
Allows to turn on/off auto refresh and configure the refresh interval. |
Dashboard#
Explore the data in Kibana#
You can explore traffic data in Kibana at http://<HOST_IP>:5601/. An init container imports a custom dashboard for the Smart City app and creates all the required indexes. Access the dashboard by going to Menu > Dashboard and clicking on the ITS dashboard. To see the results corresponding to a particular sensor, click on the filter button, select the sensor keyword and enter the sensor name.
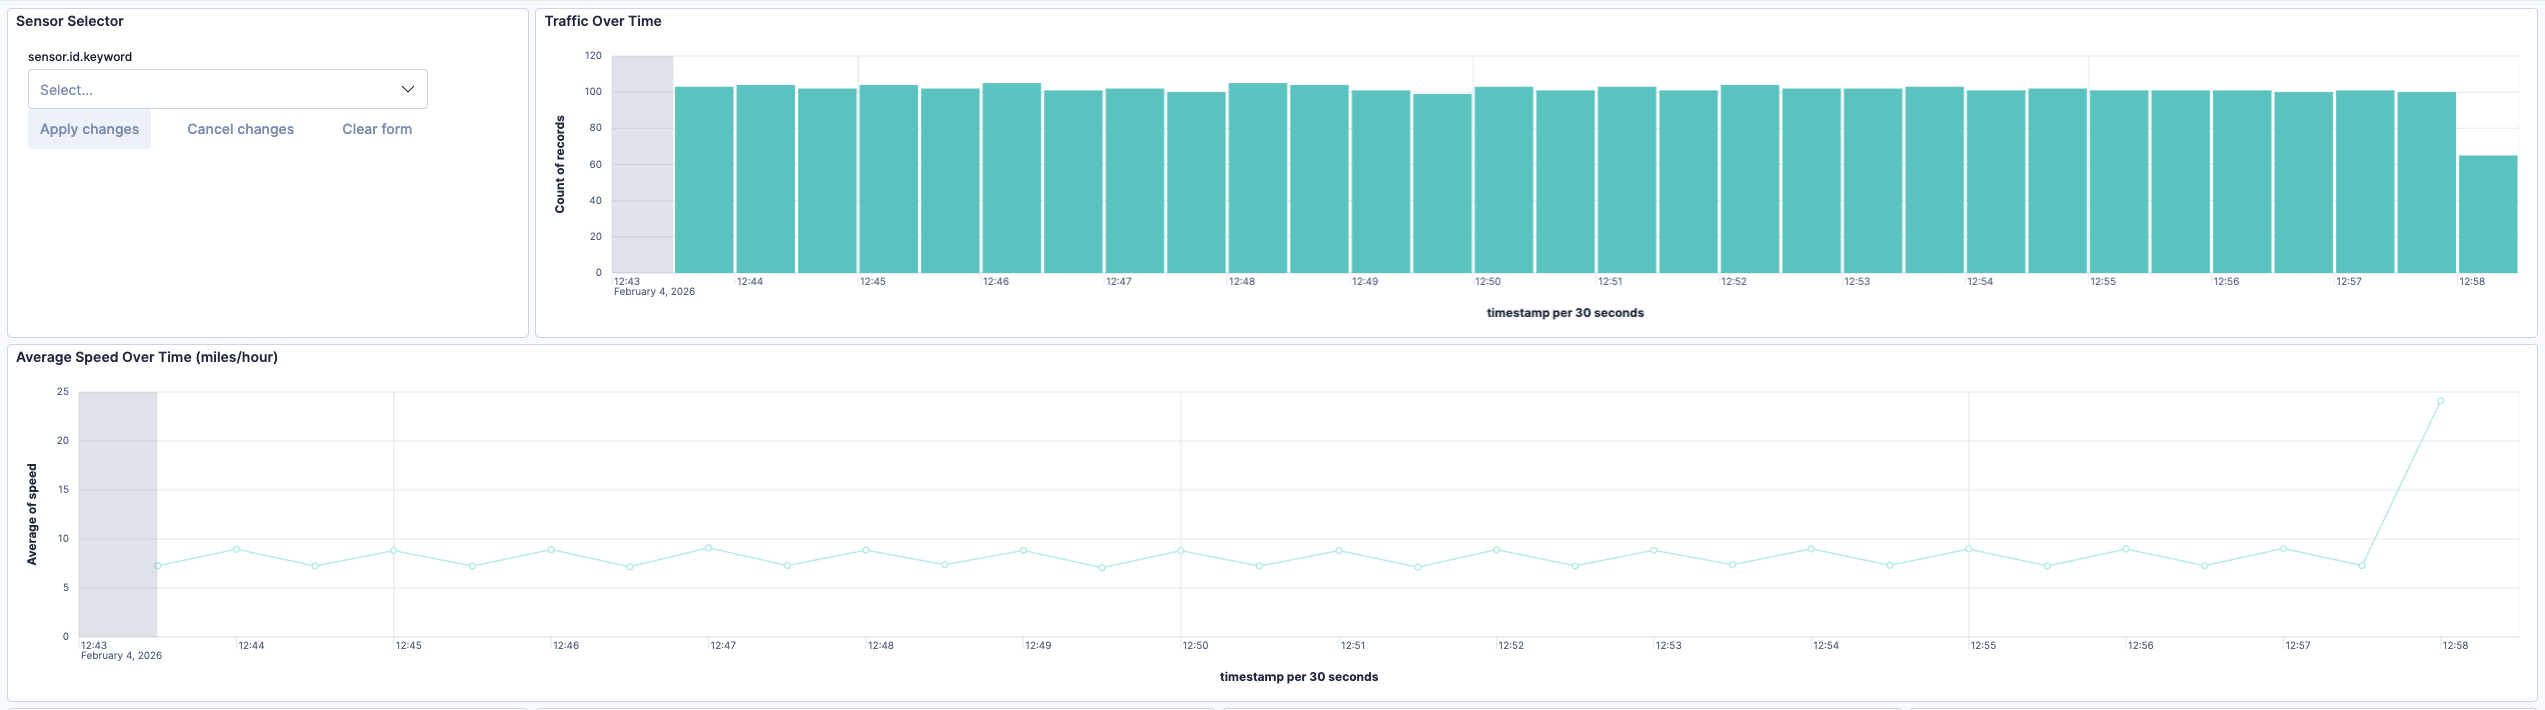
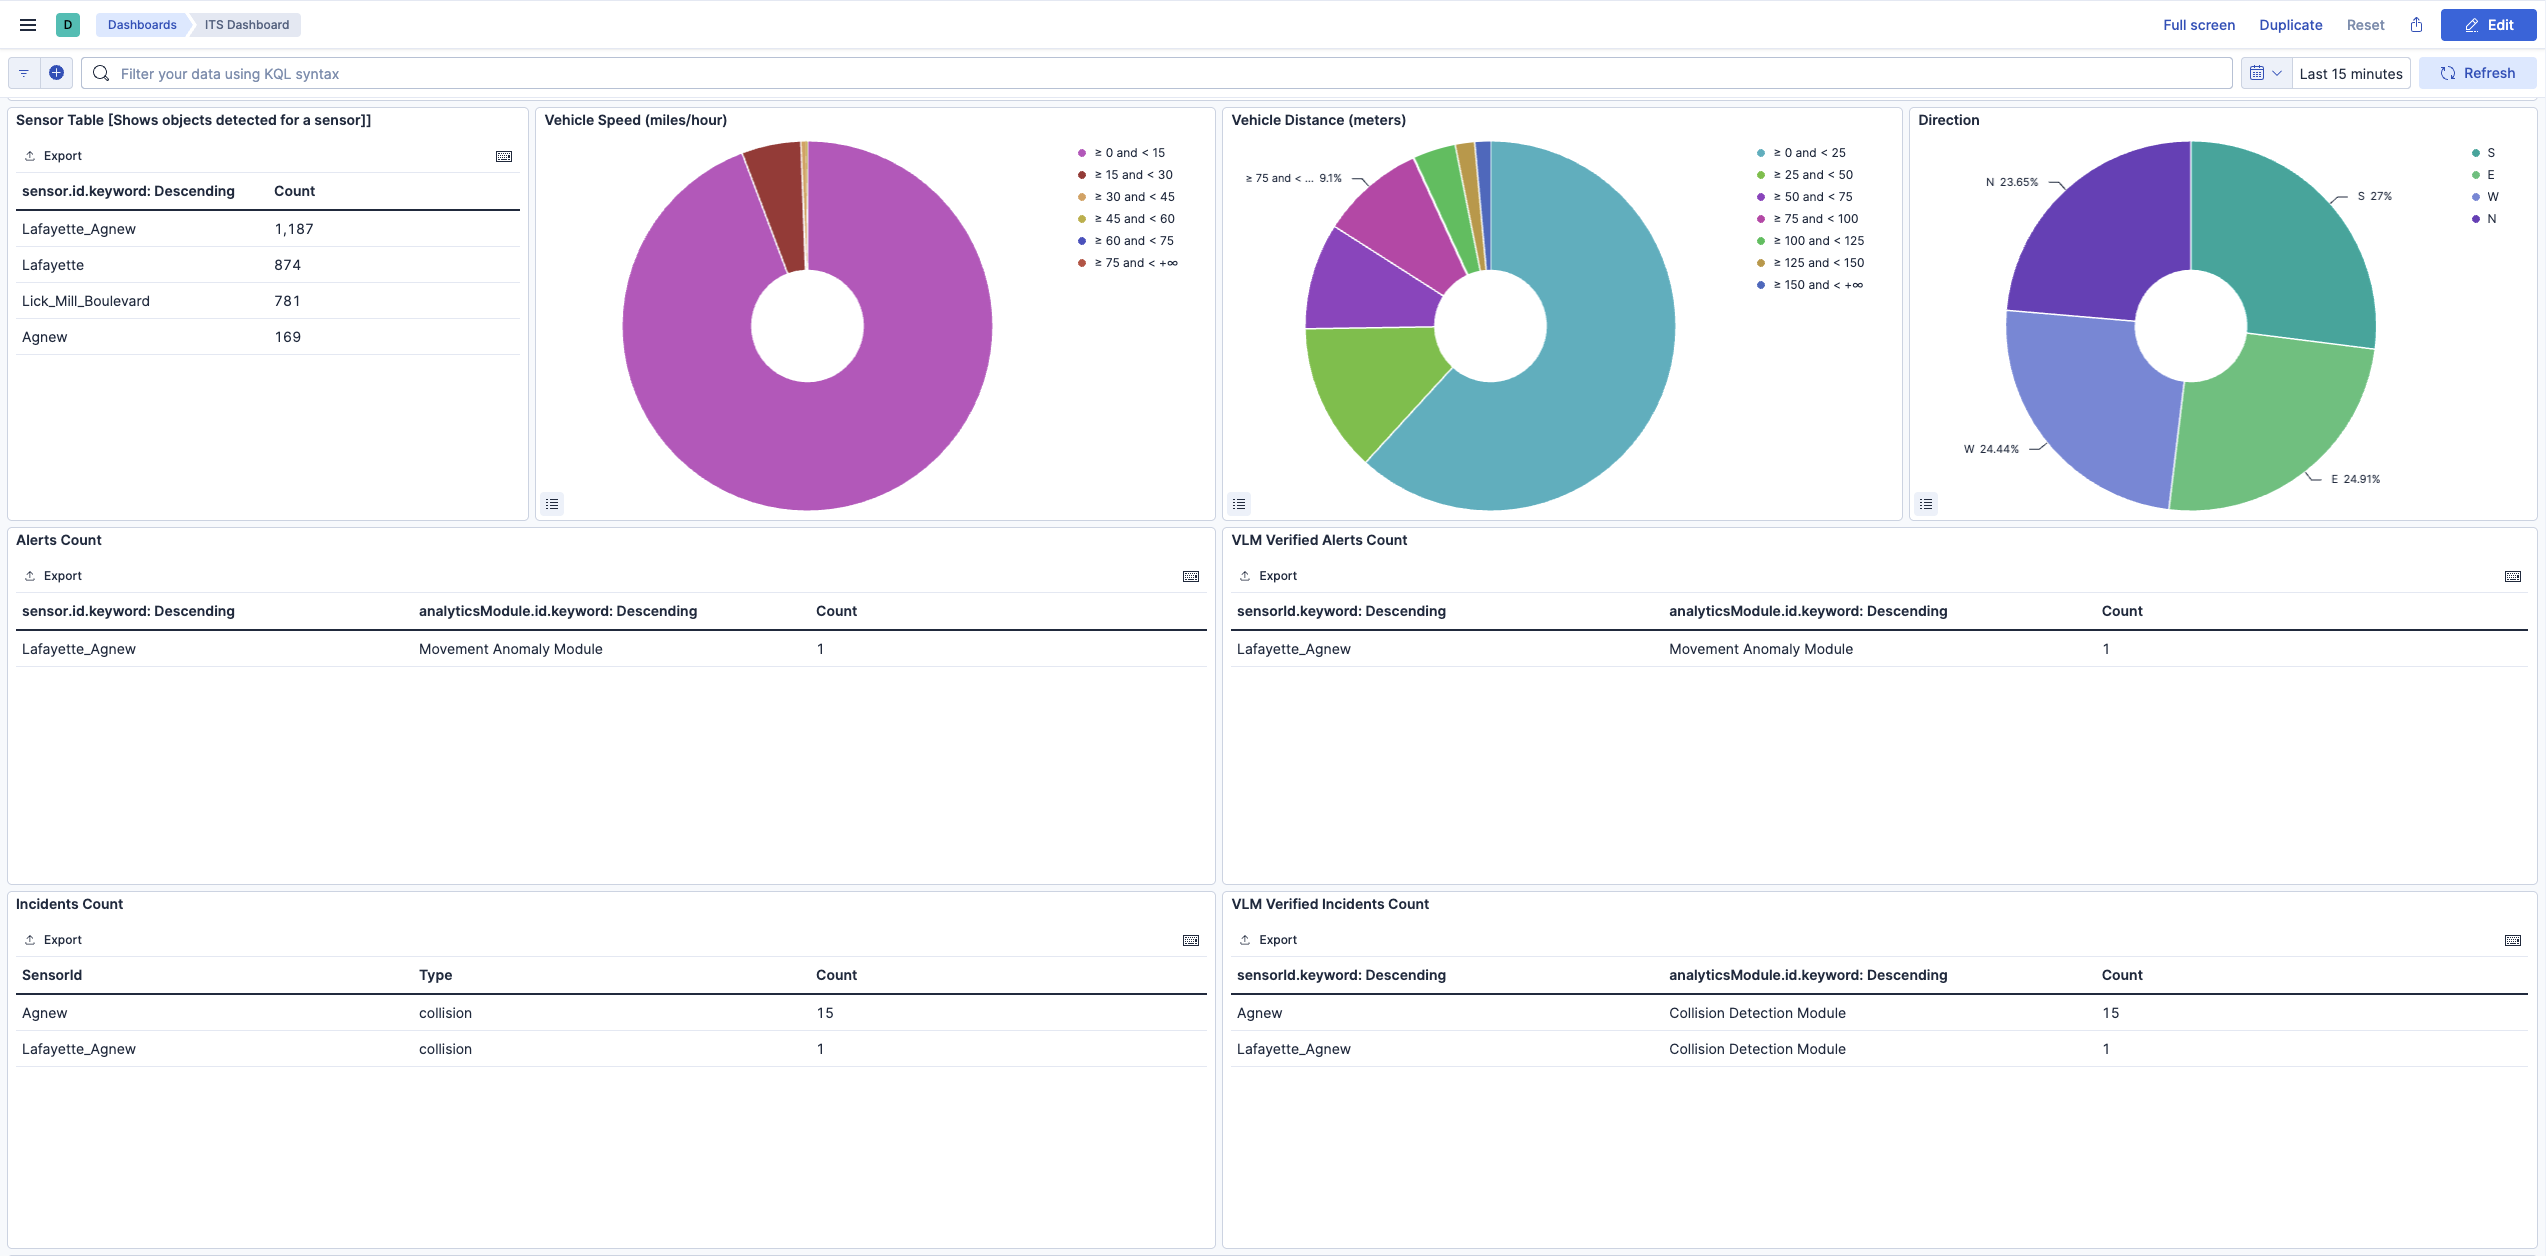
Dashboard Charts
The dashboard provides several visualizations to analyze traffic patterns:
Sensor Table: Displays the count of objects detected per sensor, helping identify high-traffic intersections.
Vehicle Speed: A donut chart showing the distribution of vehicle speeds in miles per hour, grouped into ranges (0-15, 15-30, 30-45, etc.).
Vehicle Distance: Shows the distribution of distances traveled by detected vehicles in meters.
Direction: Visualizes the directional distribution of vehicle movement (North, South, East, West).
Alerts and VLM Verified Alerts
The bottom section of the dashboard displays alert information:
Alerts Count: Shows all alerts generated by the CV pipeline, categorized by sensor and analytics module (Stop Anomaly Module, Movement Anomaly Module).
VLM Verified Alerts Count: Displays alerts that have been verified by the Vision Language Model (VLM). This helps distinguish true positives from false alarms by leveraging VLM reasoning capabilities.
Incidents Count: Shows all incidents generated by the CV pipeline, categorized by sensor and type.
VLM Verified Incidents Count: Shows incidents that have passed VLM verification, providing higher confidence results.
The Kibana dashboard is a powerful tool to visualize data. You can interact with any of the visualization panels to filter the data according to a selection. For example, clicking on the ‘west’ direction on the direction panel will filter the data across the dashboard to only show results for vehicles travelling westward. You can read more about dashboards in the official Kibana dashboard documentation.
Map#
City Level View#

The city level view is default upon loading the web client. This section discusses in detail the specific UI features available at this view level along with intersections.
City context header bar#

The city context header bar contains City Name on the left and the current UTC in GMT time for the city on the right.
Intersection markers#

Intersection Markers can be of three colors - green, blue and red. The green color signifies active intersection, which means at-least one of the cameras at the intersection is giving out data to the MDX System. The blue color signifies that the intersection belongs to the current selected corridor, (corridor selection is discussed in one of the subsections below). The red color signifies there was a recent severe alert at the intersection. To dismiss the red color that acts as an alert, the user can go inside the intersection level view of the intersection. When the user comes back to the city view, the red colored icon now shows as green or blue.
City Level Road Network#
The road network is constructed of smaller road segments. Each road segment can be interacted with individually by the user.

In the image above, two of the upper horizontal road segments can be seen colored orange and green. The significance of the colors is explained in the Speed Legend sub-section. In brief, these colors depict the range of the average vehicle speed around that area on road in the real world.
However, the grey colored segments are discussed here. The grey colored segments are called the inactive segments. These segments are those which have not been marked active since the launch of the current instance of the web client. A segment is marked active when at least once since the launch of the UI instance, the UI has received either a positive vehicle count or an average vehicle speed for the segment. For inactive segments, the tooltip text,upon hovering the mouse over, notifies user of the inactive state of the segment.
The active road segments can be interacted more and Speed display boxes can be spawned for more information. Speed boxes are explained in one of the following sub-sections.
Speed legend#

The speed legend UI component is a static component. The left most color depicts busy traffic at a road segment and the right most color depicts free flowing traffic. The colored boxes can be hovered upon to see the range of integral speed they depict.
Intersection Level Live View#

The user reaches the intersection level view for an intersection upon left-clicking an intersection icon in the city view. This section discusses, in detail, the specific UI features available at this view level.
Going back to city view#

The city context header bar shows the same in the intersection view with one difference. The city name on the left of the bar now can be clicked to go back to the city view from the intersection view.
Alerts Panel#
The alerts panel in the live mode, shows a list of recent alerts captured by any of the cameras at the intersection. These alerts are single clickable items. Clicking on any alert leads to the alert view mode for that alert.
The ‘Last Updated Time’ in GMT/UTC shows that time of the last event updated by the MDX detection module for any of the cameras at the intersection.
Alert View mode#

The alert view mode at the intersection level is to present a contextual graphics for a selected alert. During this mode, some of the live view mode functionalities get replaced - Alerts list, live video feed, real-time dynamic road links, KPIs.
The alerts panel in this mode shows the selected alert only along with the back button to go back to the live mode.

Instead of real-time dynamically changing overlaid road segments on the map, in this mode, anomaly vehicle trajectory is shown in an animated fashion. The circle icon on the trajectory line is animated over the trajectory, giving a sense of direction of movement of the vehicle. This animation helps in cases where the traveled direction by the vehicle is a lot different from the expected. The vehicle ID is the one generated by the Video Analytics layer. Change in color to grey of the animation circle icon, denotes end of the animation.
The video played in this case is the segment of the detected traffic anomaly for the alert which has been retrieved from the VMS using the MMS APIs. The anomaly video playback auto starts by default upon entering the alert view for an anomaly. The trajectory animation along with the video can help recognize the vehicle in the video more conveniently.
The KPI panel in this mode is not shown since live KPIs are incongruent with an alert recorded in past time.
‘Last Updated Time’ is also not shown in this mode.
Intersection kpis#

The KPI panel shows the same as the city level, with the difference that the KPI metrics may be different as these sets are pertaining to an intersection and not a corridor. The other difference is that the KPI panel is prepended with the current intersection name instead of a corridor name.
Cameras#

The cameras installed at an intersection in the real world are drawn as camera icons on the 2D map surface along with their real world orientation and the field of view. The radius in pixels of the field of view arc drawn is approximated to the real world distance.
A selected camera in the view is a color-filled icon, while the others are outlined only. At any moment, there can be only one selected camera.
In the live view, the video feed from the selected camera, is streamed.
Roads Network at Intersection level#
The only difference between the road network shown at the intersection level and the city level is - only roads pertaining to the intersection are drawn on the map rather than a wider city. So if the map is panned away from the center of the intersection, then no other road components would be visible that were at the city level.
The colors showing the traffic density show up in the same way as the city level. The speed display boxes are also spawned and interacted in the same way as before.
Clustering Behavior#

To see the clustering widget right click on a sensor in the intersection live mode. The clustering behavior is shown for a single camera. The widget has following items:
Title bar: Shows the selected camera name
Left top widget menu
Left bottom Bar Chart view of Clusters
Geo Map view of Clusters
Teardown the Deployment#
To stop and remove the Smart City Blueprint deployment:
# Stop the running deployment
docker compose -p mdx down

# Tear down all dangling volumes
docker volume ls -q -f "dangling=true" | xargs docker volume rm

# Cleanup all data (from deployments directory)
bash cleanup_all_datalog.sh -b smartcities
Known Issues and Limitations#
Only the default NIMs (LLM and VLM) have been tested to run on shared GPU. Use Dedicated GPUs or Remote NIMs for other models.
WebRTC based Video Playback in UI: In reference Video Analytics UI, the video playback may not be supported. If the Video streaming service is running behind a private network where the WebRTC turn server is not accessible (or setup appropriately), the video playback may not be supported.
Spiderfied Markers in Map UI: When clicking overlapping markers, they spread out in a spiderfied layout. If a marker status changes (for example, gray to red) while spiderfied, the updated marker may occasionally return to the original overlapping position instead of remaining in the expanded layout.
Appendix: Downloading Custom VLM Weights#
This appendix provides detailed instructions for downloading custom Vision Language Model (VLM) weights from NGC or Hugging Face.
Download Custom Weights from NGC#
If custom VLM weights are available on NGC, you can download them using the NGC CLI:
# Set your NGC API key if not already set
export NGC_CLI_API_KEY='your_ngc_api_key'

# Download custom weights from NGC
ngc registry model download-version <org>/<team>/<model>:<version>

# Move downloaded custom weights to desired path/folder
mv </downloaded/path/in/ngc/output> </path/to/custom/weights>
The weights will be downloaded to a local directory. Note the path to this directory, as you’ll need to specify it in the .env file.
Download Custom Weights from Hugging Face#
To download custom VLM weights from Hugging Face, you can use the huggingface-cli tool or Git LFS:
Using huggingface-cli:
# Install Hugging Face CLI if not already installed
pip install -U "huggingface_hub[cli]"

# Login to Hugging Face (required for gated models)
hf auth login

# Create a base directory where the custom weights can be downloaded
mkdir -p </path/to/custom/weights>

# Download a model
hf download <model-id> --local-dir </path/to/custom/weights>
Using Git LFS:
# Install Git LFS if not already installed
sudo apt install git-lfs
git lfs install

# Clone the model repository
git clone https://huggingface.co/<model-id> </path/to/custom/weights>
Note
Some Hugging Face models may be gated and require access approval. Visit the model page on Hugging Face and request access if needed. You must also authenticate using huggingface-cli login before downloading gated models.
Verify Downloaded Weights#
After downloading custom weights, verify the directory structure and contents:
# List the contents of the weights directory
ls -lrh </path/to/custom/weights>
Typical VLM weight directories contain:
Model configuration files (e.g.,
config.json)Model weights (e.g.,
pytorch_model.bin,model.safetensors, or sharded weights)Tokenizer files (e.g.,
tokenizer.json,tokenizer_config.json)Other metadata files