Observability#
This page covers observability features for VSS Agents, including distributed tracing via Phoenix.
Overview#
VSS Agents support distributed tracing through Phoenix, an open-source observability platform for AI applications. The NeMo Agent Toolkit (NAT) natively integrates with Phoenix as a built-in telemetry exporter, enabling you to monitor and debug agent workflows.
Phoenix provides:
Project-based Organization: Organize traces by workflow or deployment
Distributed Tracing: Track agent execution flow, tool calls, and LLM interactions
Performance Monitoring: Analyze latency, token usage, and throughput metrics
Debugging: Inspect individual traces to understand agent behavior and diagnose issues
Enabling Telemetry#
To enable Phoenix telemetry in the agent service, configure the telemetry settings in your agent’s configuration file. Refer to Agent Configuration for the full configuration reference.
Navigating the Phoenix UI#
Once Phoenix telemetry is enabled and your agent is running, access the Phoenix UI at http://<your-machine-ip>:6006.
Projects View#
The Phoenix UI organizes traces by project. Select a project to view all traces associated with that agent workflow.
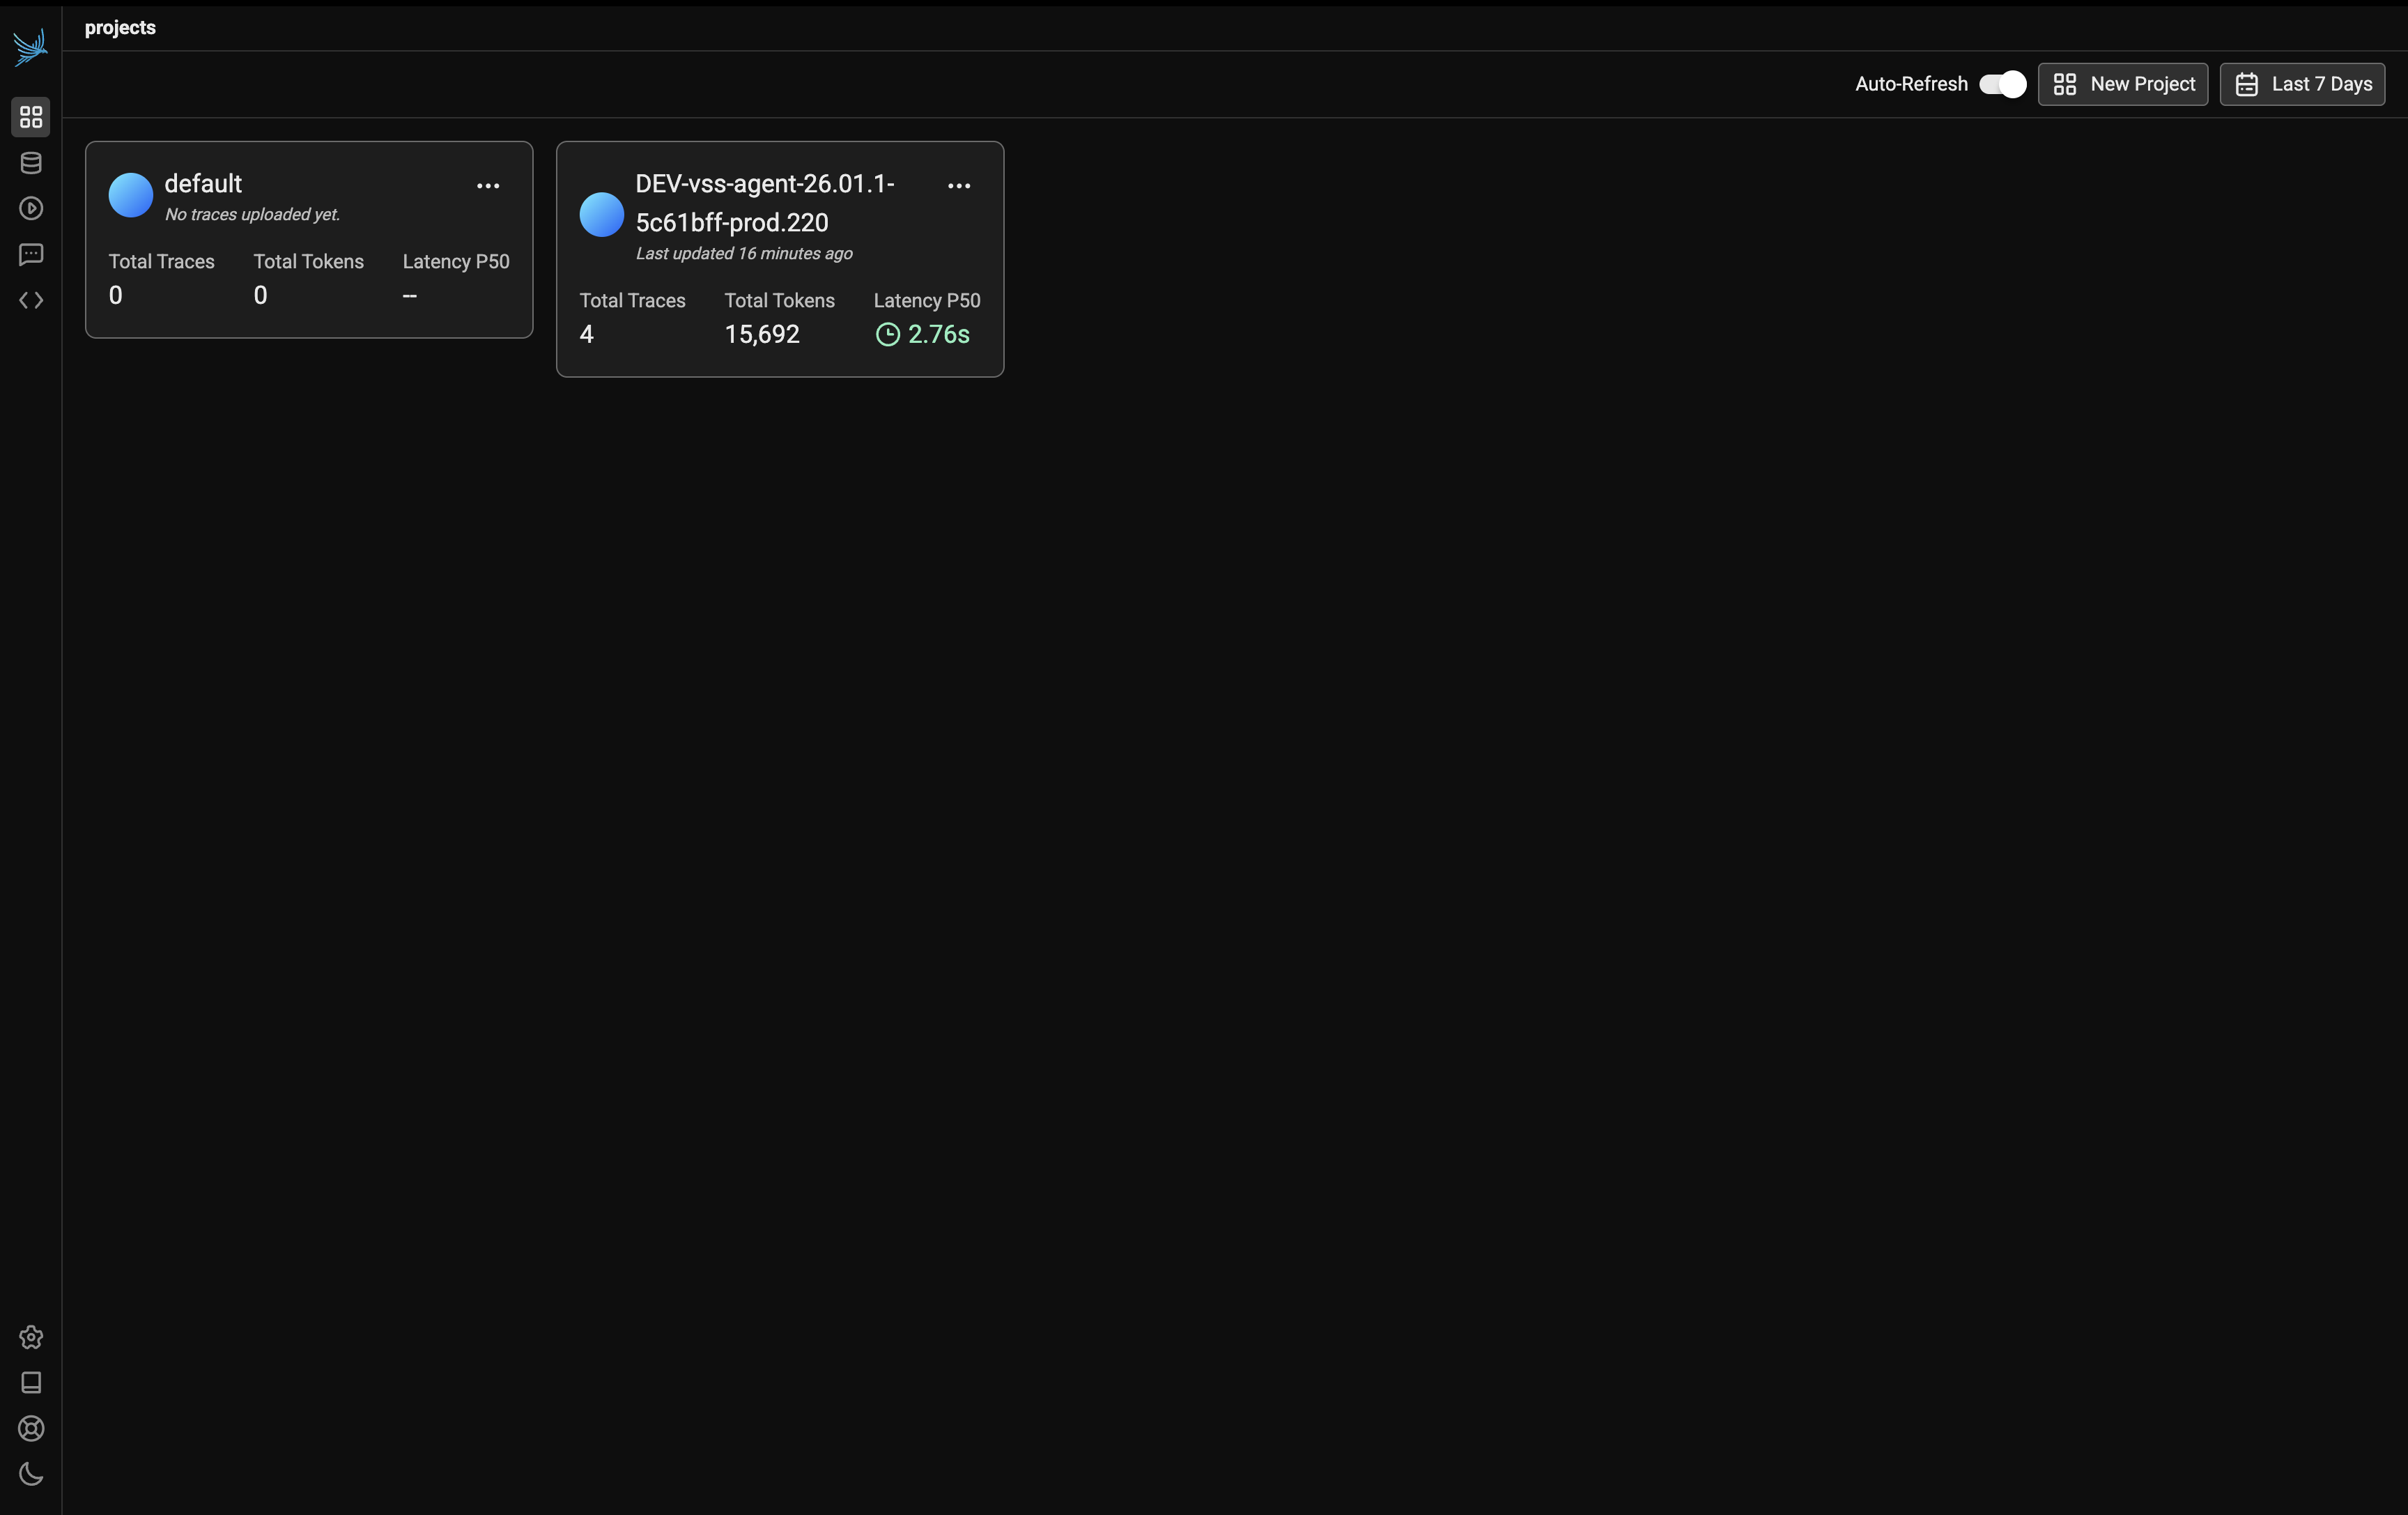
In the example above, select the DEV-vss-agent-26.01.1-5c61bff-prod.220 project to view traces from the VSS Agent workflow.
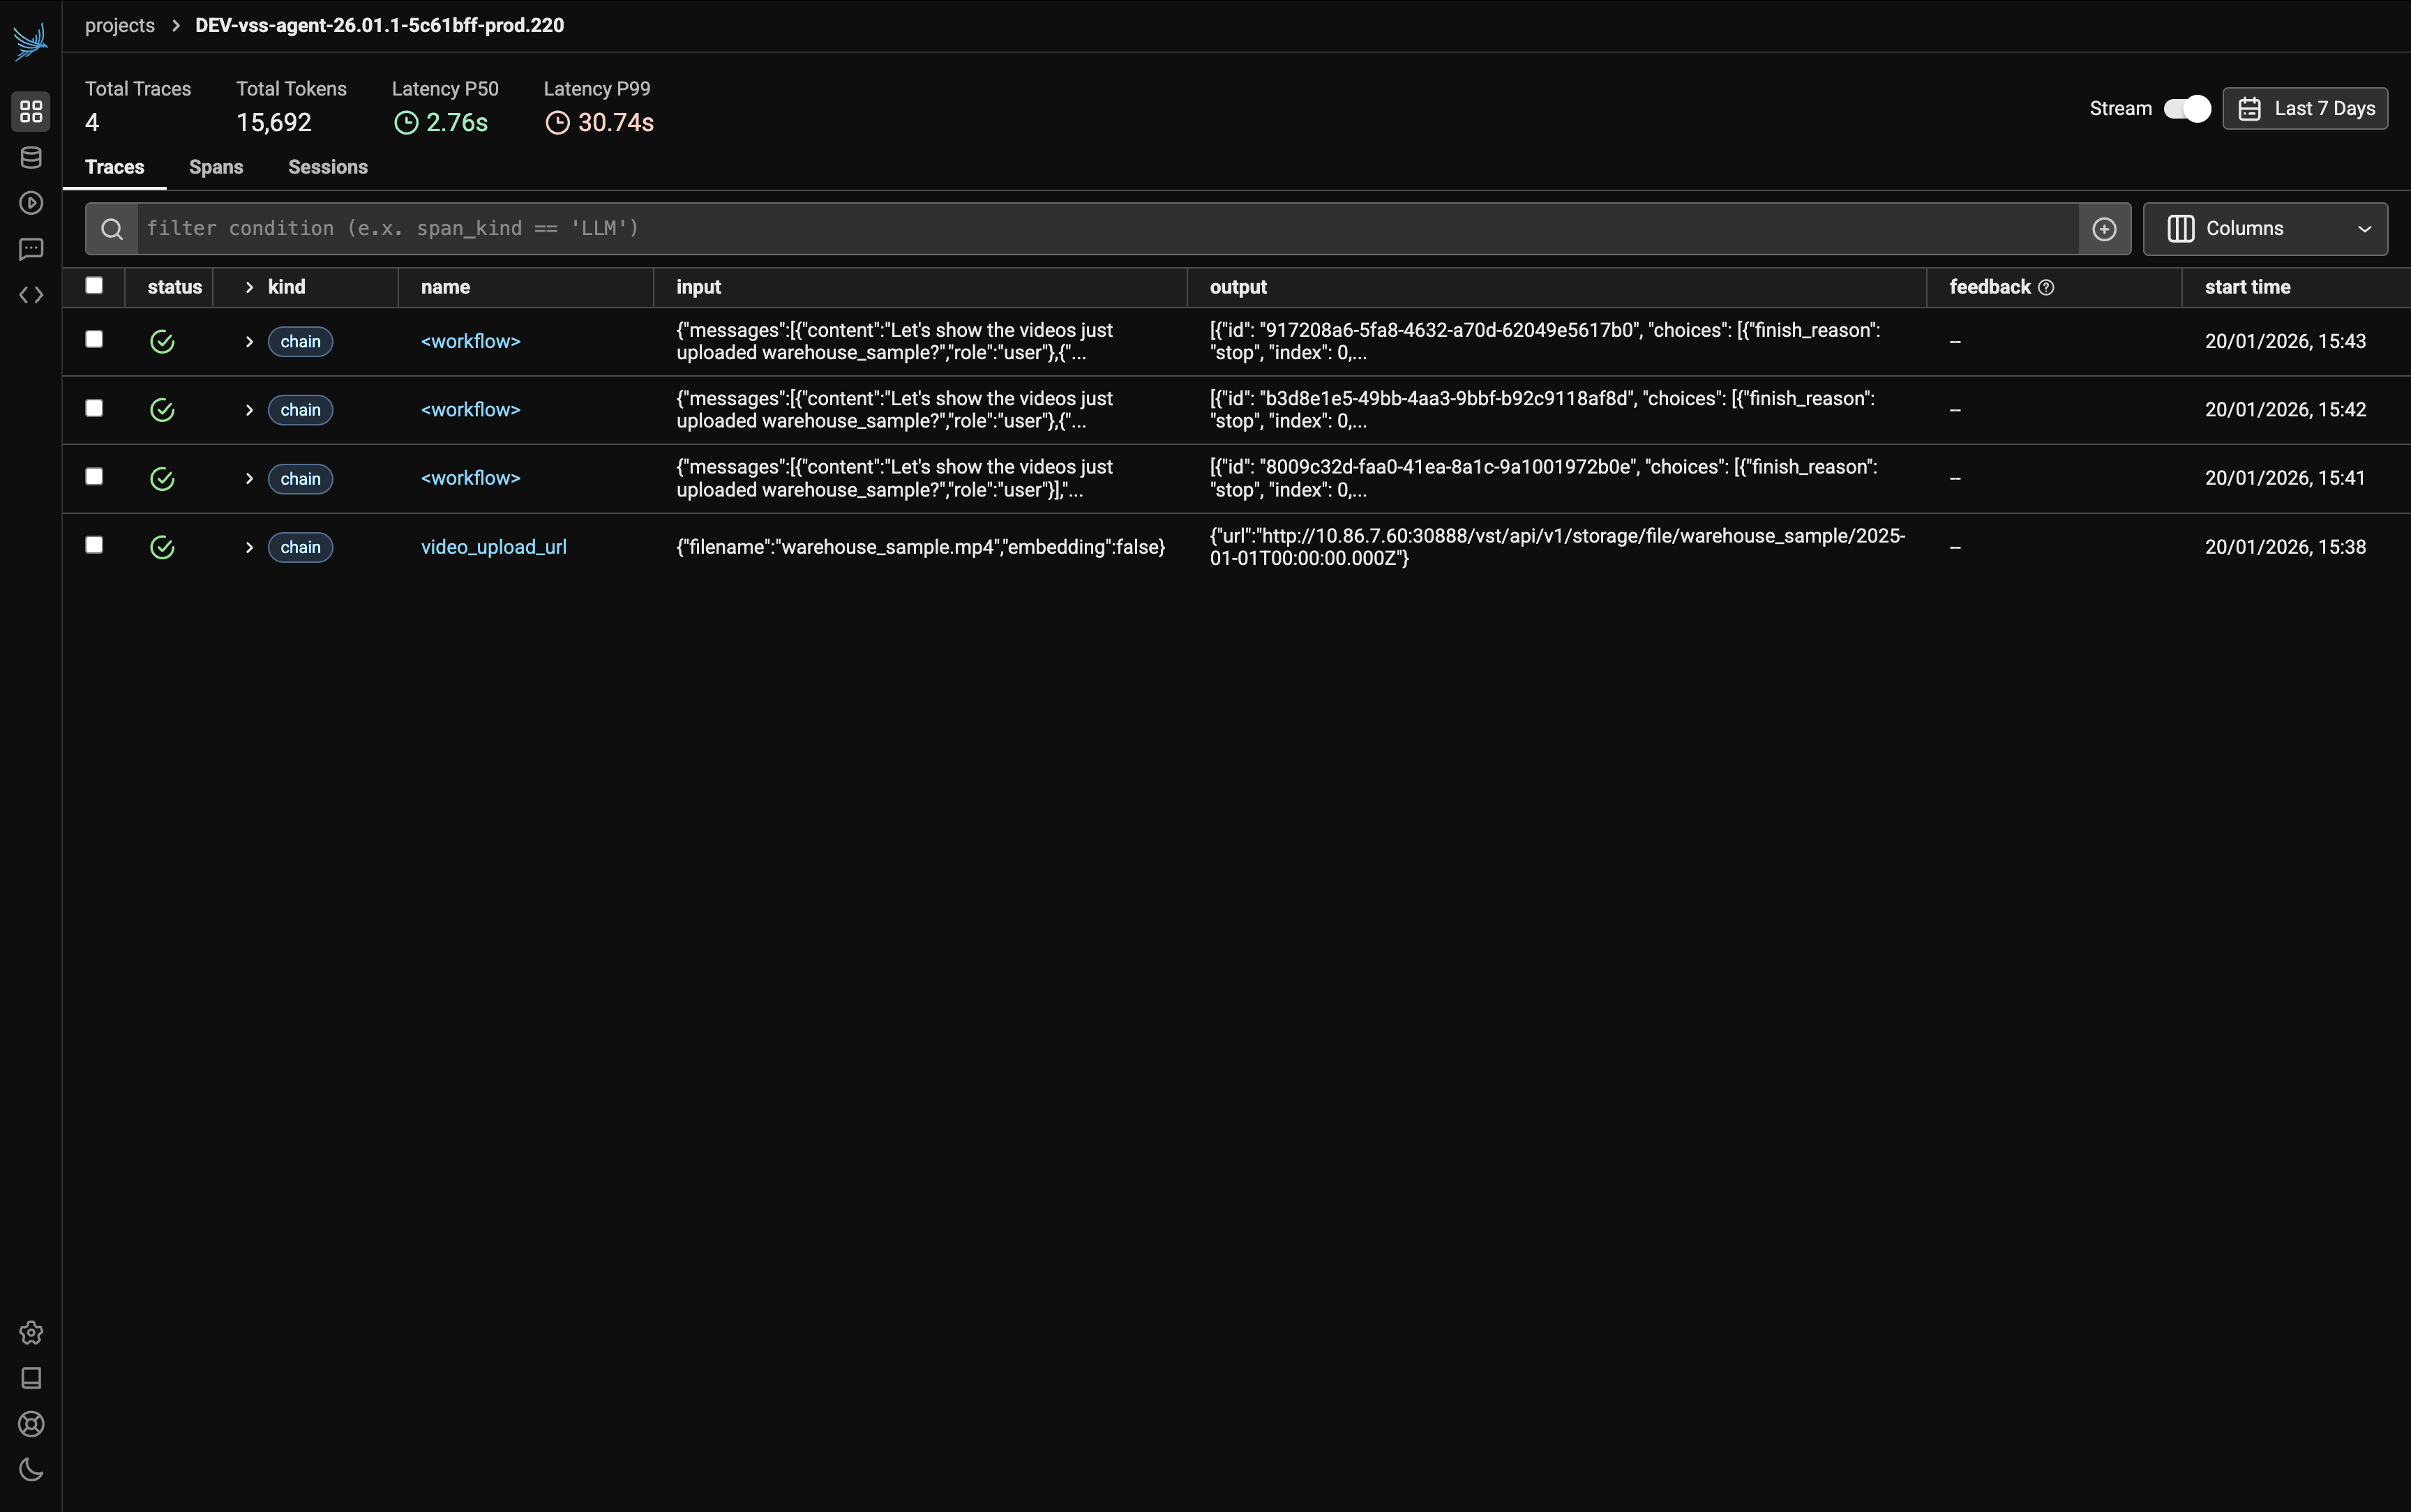
Traces List#
The traces list displays summary metrics at the top:
Total Traces: Number of recorded traces (e.g., 5)
Total Tokens: Combined token usage across all traces (e.g., 19,719)
Latency P50: Median latency (e.g., 2.59s)
Latency P99: 99th percentile latency (e.g., 30.45s)
Each trace in the list shows the following fields:
Status: Success or error indicator
Kind: Type of operation (e.g., workflow, LLM, tool)
Name: The trace or span name
Input: The user query or function input
Output: The response or return value
Start Timestamp: When the interaction occurred
Click on any trace to view its detailed span breakdown.
Sample Query Trace#
This example demonstrates a trace for the query:
What videos are available?
The following screenshots show the complete trace visualization with all spans expanded.
Workflow Execution#
The trace begins with the workflow span, which orchestrates the entire agent execution:
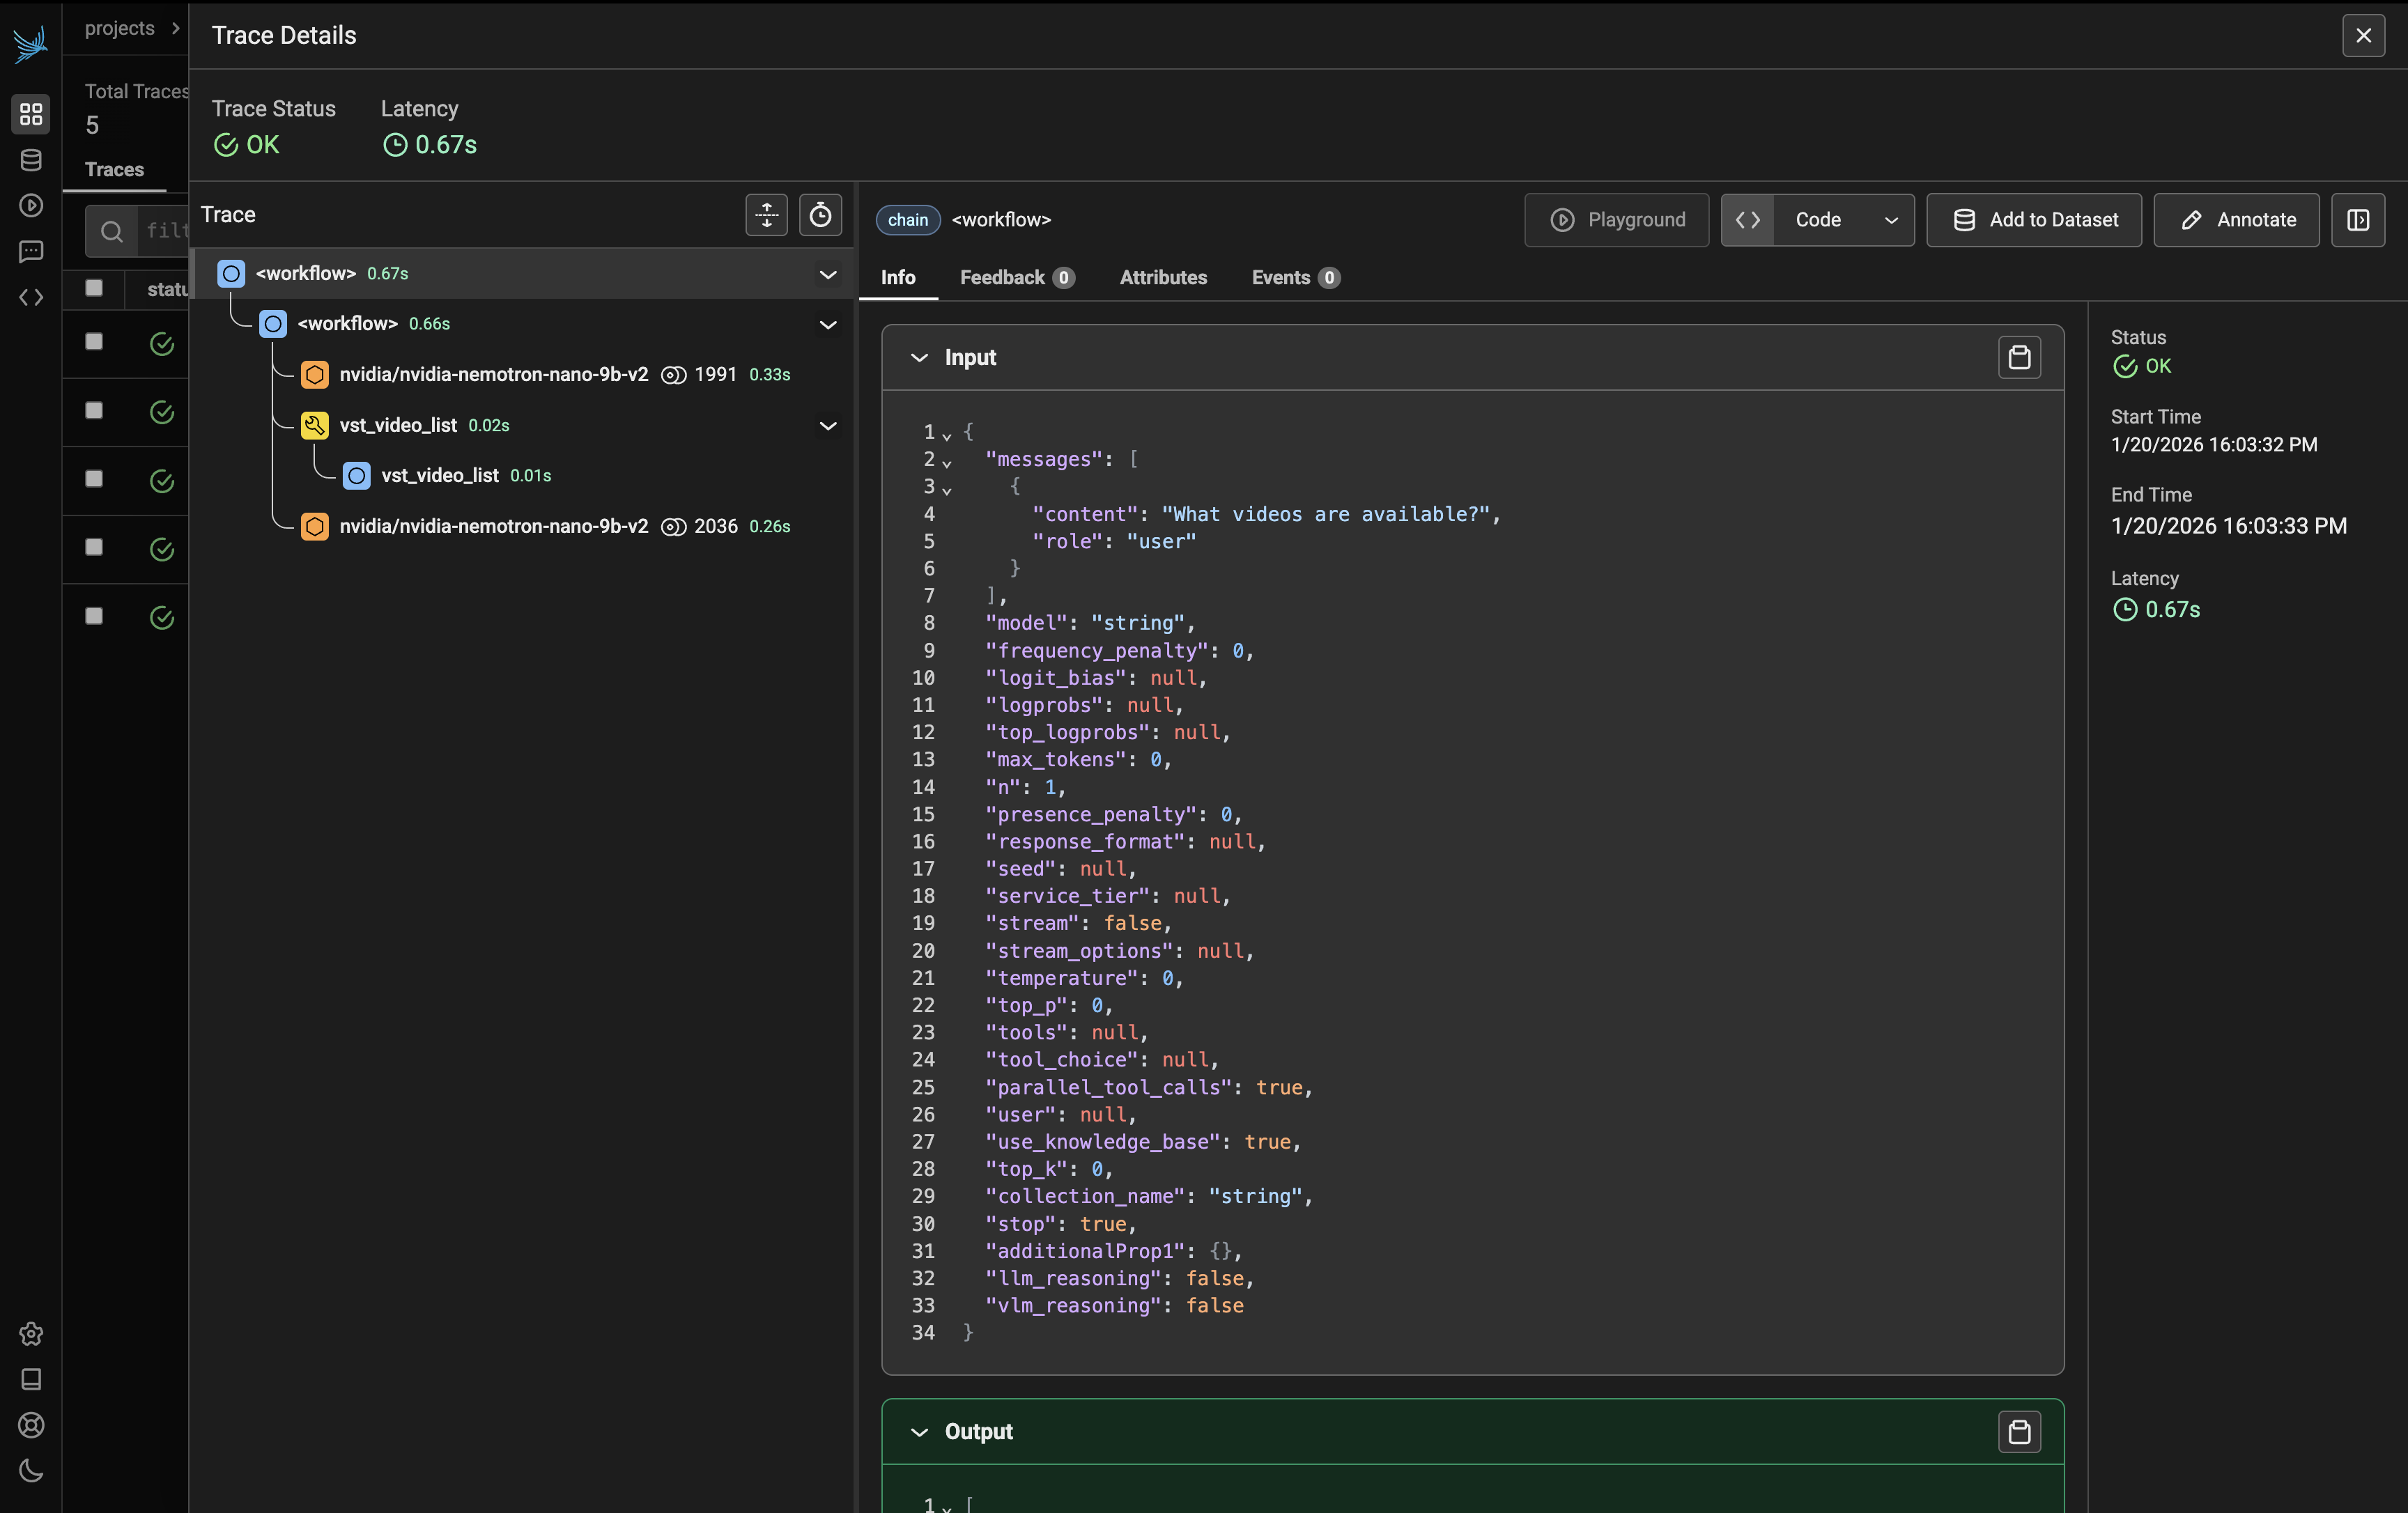
The workflow includes:
LLM Call (nvidia/nvidia-nemotron-nano-9b-v2): The first LLM call processes the user query. Click on this span to view:
Input: The user’s question and system prompt
Output: The LLM’s reasoning and decision to call a tool
Tool Call and Final Response#
After the initial LLM reasoning, the agent executes the appropriate tool:
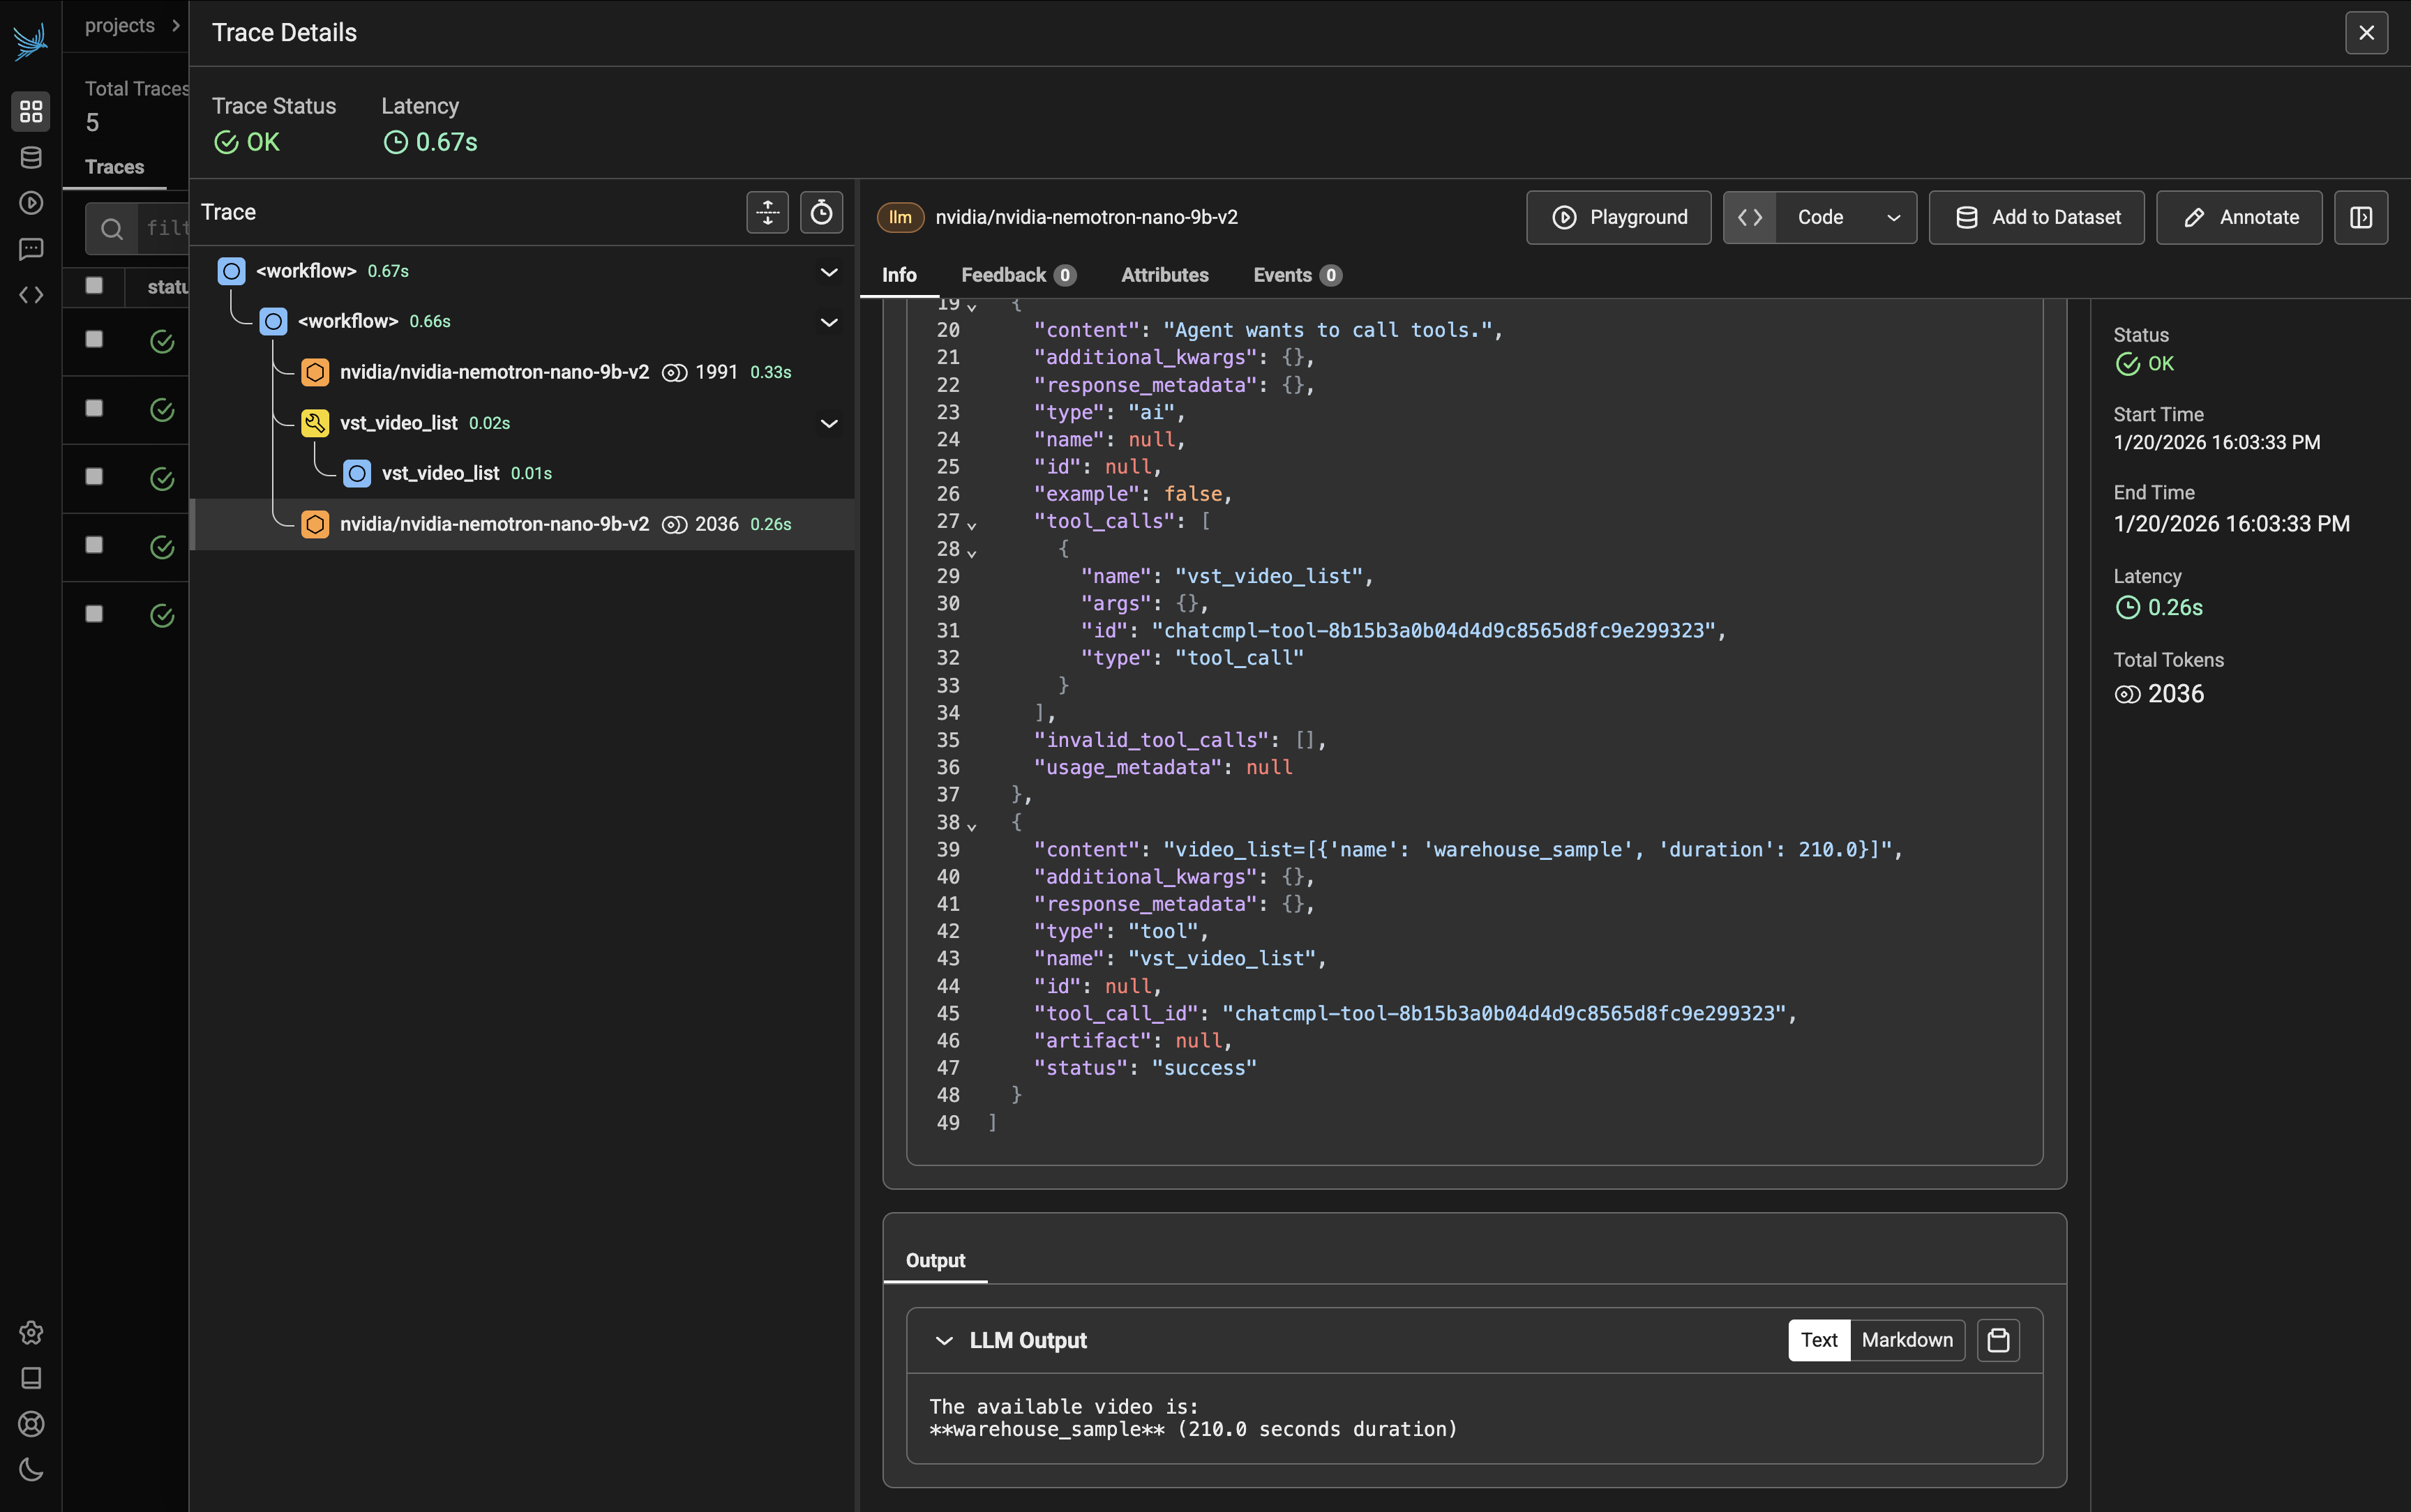
Tool Call (vst_video_list): The agent calls the
vst_video_listtool to retrieve available videos. Click on this span to view:Input: Tool parameters (if any)
Output: List of available videos returned by the tool
LLM Call (Final Response): The second LLM call takes the tool output and generates the final response for the user. Click on this span to view:
Input: The tool results combined with conversation context
Output: The formatted response presented to the user
Understanding the Trace Structure#
The trace view shows a hierarchical execution pattern typical of agent workflows:
workflow
├── LLM Call (nvidia/nvidia-nemotron-nano-9b-v2)  → Reasoning & tool selection
│   ├── Input: User query + system prompt
│   └── Output: Decision to call vst_video_list
├── Tool Call (vst_video_list)                    → Tool execution
│   ├── Input: Tool parameters
│   └── Output: List of videos
└── LLM Call (nvidia/nvidia-nemotron-nano-9b-v2)  → Final response generation
    ├── Input: Tool results + context
    └── Output: User-facing response
Inspecting Span Details#
Click on any span to view its details. The right panel displays key metrics:
Status: Success indicator (e.g., OK)
Start Time: When the span began (e.g., 1/20/2026 16:03:33 PM)
End Time: When the span completed (e.g., 1/20/2026 16:03:33 PM)
Latency: Duration of the operation (e.g., 0.26s)
Total Tokens: Token count for LLM calls (e.g., 2036)
The Info tab shows the span’s input and output:
Input: The exact parameters passed to the function or LLM prompt
Output: The response or return value from the operation
Key Metrics to Monitor#
When analyzing traces, pay attention to:
Total Latency: End-to-end time for the complete workflow
LLM Latency: Time spent waiting for LLM responses (often the largest contributor)
Tool Execution Time: Duration of individual tool calls (e.g.,
vst_video_list)Token Usage: Monitor input and output tokens for cost optimization
Viewing Container Logs#
Container logs are essential for diagnosing deployment issues, runtime errors, and service behavior.
Listing Containers#
To see all running containers in your deployment:
# List running containers
docker ps
Viewing Logs#
View logs for a specific container:
# View logs by container name
docker logs <container-name>

# View logs by container ID
docker logs <container-id>

# Follow logs in real-time
docker logs -f <container-name>

# View the last N lines
docker logs --tail 100 <container-name>
Common Log Analysis Tasks#
Search for errors:
docker logs <container-name> | grep -i error