Alert Verification Workflow#
Two approaches for leveraging VLMs to generate alerts are showcased as part of the agent workflows:
Alert Verification: The VLM analyzes video snippets corresponding to alerts generated upstream for verification; original alerts are generated through a combination of object detection/tracking and behavior analytics microservices that process video streams in real time. This approach invokes the VLM more sporadically and hence has lower GPU requirements, but depends on an upstream entity to generate “candidate” alerts for verification.
Real-Time Alerts: The VLM continuously processes segments from a video source (for example, a camera) at periodic intervals based on a user-defined chunk duration. This approach leverages the generalizability of VLMs to trigger alerts for a broad set of cases (VLM fine-tuning or prompt tuning may be needed). However, it has higher GPU requirements due to more frequent VLM usage.
This section addresses the Alert Verification workflow; see Real-Time Alerts for the other approach.
Use Cases for Alert Verification
PPE compliance verification (hard hats, safety vests)
Restricted area monitoring
Asset presence/absence detection
Custom object detection scenarios
Estimated Deployment Time: 15-20 minutes
The following diagram illustrates the alert verification workflow architecture:
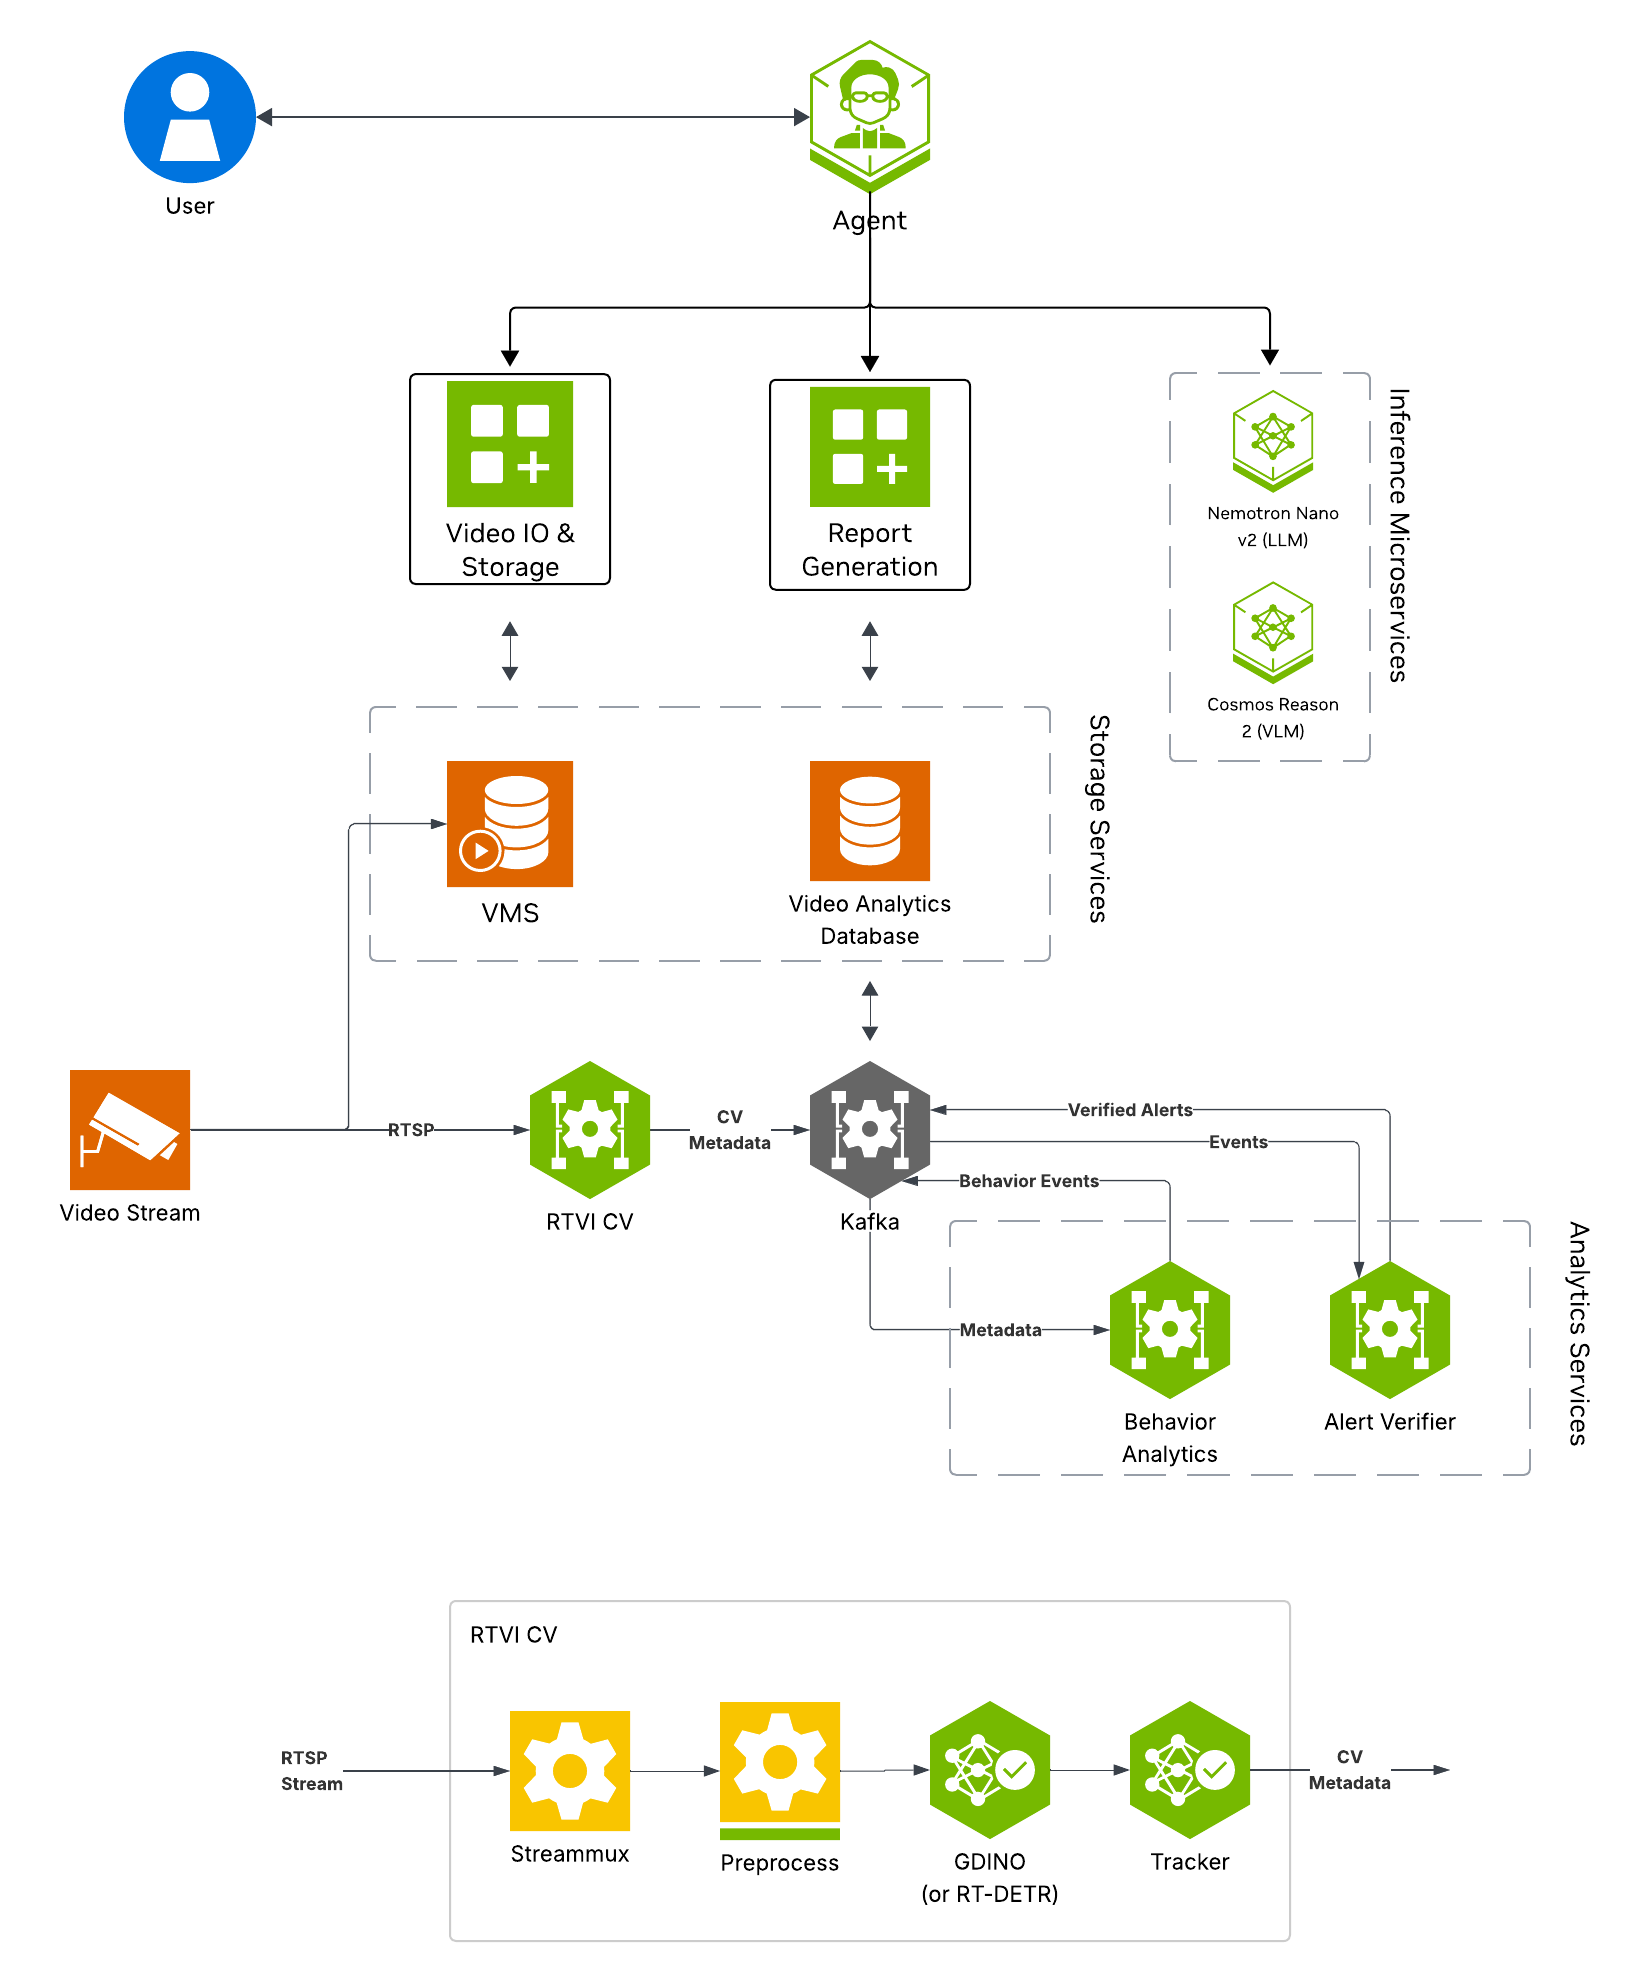
Key Features of the Alert Verification Agent:
RTVI CV for real-time object detection using Grounding DINO (open-vocabulary detection)
Behavior Analytics for rule-based and configurable alert generation from detection results
Alert Verification for VLM-based alert clip review to reduce false positives
Alert storage for querying and reporting
Report Generation
What’s being deployed#
NVStreamer: Video streaming service for dataset video playback, thereby replicating live cameras in a real-world deployment
Video IO & Storage (VIOS): Video ingestion (of NVStreamer video streams) supporting live streaming, recording, and playback features used by the agent
RTVI CV: Real-Time Video Intelligence CV Microservice for object detection that processes VIOS live streams to output metadata to Kafka
Behavior Analytics: Processes metadata from RTVI CV to generate alerts
Alert Verification: Verification of alert video using VLM
RTVI VLM: Real-Time VLM Microservice for vision-language model inference used by Alert Verification
ELK: Elasticsearch, Logstash, and Kibana stack for log storage and analysis
VSS Agent: Agent service that uses a configured LLM endpoint to route requests and orchestrate tool calls to VSS microservices and model endpoints (LLM/VLM NIMs) to answer questions and generate outputs
Nemotron LLM (NIM): LLM inference service used for reasoning, tool selection, and response generation
Phoenix: Observability and telemetry service for agent workflow monitoring
Prerequisites#
Before you begin, ensure all of the prerequisites are met. See Prerequisites for more details.
Note
For instructions on downloading sample data and the deployment package, see Download Sample Data and Deployment Package in the Quickstart guide.
If you have already completed those steps for another agent workflow, skip to Step 1: Deploy the Agent in the Deploy section below.
Deploy#
Step 1: Deploy the Agent#
Note
Set the NGC CLI API key, then run the deploy commands for your GPU type.
Refer to VSS-Agent-Customization-configure-llm and VSS-Agent-Customization-configure-vlm for all LLM and VLM (local and remote) configuration options. For RTVI-VLM configuration options, see Real-Time VLM.
For advanced settings and Agent Customization, see the deploy command help.
# Set NGC CLI API key
export NGC_CLI_API_KEY='your_ngc_api_key'

# View all available options
deploy/docker/scripts/dev-profile.sh --help
deploy/docker/scripts/dev-profile.sh up -p alerts -m verification -H H100
deploy/docker/scripts/dev-profile.sh up -p alerts -m verification -H H100 \
    --llm-device-id 1 --vlm-device-id 2
export LLM_ENDPOINT_URL=https://your-llm-endpoint.com
deploy/docker/scripts/dev-profile.sh up -p alerts -m verification -H H100 \
    --use-remote-llm
export VLM_ENDPOINT_URL=https://your-vlm-endpoint.com
deploy/docker/scripts/dev-profile.sh up -p alerts -m verification -H H100 \
    --use-remote-vlm
export LLM_ENDPOINT_URL=https://your-llm-endpoint.com
export VLM_ENDPOINT_URL=https://your-vlm-endpoint.com
deploy/docker/scripts/dev-profile.sh up -p alerts -m verification -H H100 \
    --use-remote-llm --use-remote-vlm
deploy/docker/scripts/dev-profile.sh up -p alerts -m verification -H RTXPRO6000BW
deploy/docker/scripts/dev-profile.sh up -p alerts -m verification -H RTXPRO6000BW \
    --llm-device-id 1 --vlm-device-id 2
export LLM_ENDPOINT_URL=https://your-llm-endpoint.com
deploy/docker/scripts/dev-profile.sh up -p alerts -m verification -H RTXPRO6000BW \
    --use-remote-llm
export VLM_ENDPOINT_URL=https://your-vlm-endpoint.com
deploy/docker/scripts/dev-profile.sh up -p alerts -m verification -H RTXPRO6000BW \
    --use-remote-vlm
export LLM_ENDPOINT_URL=https://your-llm-endpoint.com
export VLM_ENDPOINT_URL=https://your-vlm-endpoint.com
deploy/docker/scripts/dev-profile.sh up -p alerts -m verification -H RTXPRO6000BW \
    --use-remote-llm --use-remote-vlm
deploy/docker/scripts/dev-profile.sh up -p alerts -m verification -H L40S \
    --llm-device-id 1 --vlm-device-id 2
export LLM_ENDPOINT_URL=https://your-llm-endpoint.com
deploy/docker/scripts/dev-profile.sh up -p alerts -m verification -H L40S \
    --use-remote-llm
export VLM_ENDPOINT_URL=https://your-vlm-endpoint.com
deploy/docker/scripts/dev-profile.sh up -p alerts -m verification -H L40S \
    --use-remote-vlm
export LLM_ENDPOINT_URL=https://your-llm-endpoint.com
export VLM_ENDPOINT_URL=https://your-vlm-endpoint.com
deploy/docker/scripts/dev-profile.sh up -p alerts -m verification -H L40S \
    --use-remote-llm --use-remote-vlm
See VSS-Agent-Customization-configure-llm for remote LLM endpoint options.
export LLM_ENDPOINT_URL=https://your-llm-endpoint.com
deploy/docker/scripts/dev-profile.sh up -p alerts -m verification -H DGX-SPARK \
    --use-remote-llm
See VSS-Agent-Customization-configure-llm for remote LLM endpoint options.
export LLM_ENDPOINT_URL=https://your-llm-endpoint.com
deploy/docker/scripts/dev-profile.sh up -p alerts -m verification -H IGX-THOR \
    --use-remote-llm
See VSS-Agent-Customization-configure-llm for remote LLM endpoint options.
export LLM_ENDPOINT_URL=https://your-llm-endpoint.com
deploy/docker/scripts/dev-profile.sh up -p alerts -m verification -H AGX-THOR \
    --use-remote-llm
See Local LLM and VLM deployments on OTHER hardware and Local RTVI-VLM deployments on OTHER hardware for known limitations and configuration constraints.
deploy/docker/scripts/dev-profile.sh up -p alerts -m verification -H OTHER \
    --llm-env-file /path/to/llm.env --vlm-env-file /path/to/vlm.env
deploy/docker/scripts/dev-profile.sh up -p alerts -m verification -H OTHER \
    --llm-device-id 1 --vlm-device-id 2 \
    --llm-env-file /path/to/llm.env --vlm-env-file /path/to/vlm.env
export LLM_ENDPOINT_URL=https://your-llm-endpoint.com
deploy/docker/scripts/dev-profile.sh up -p alerts -m verification -H OTHER \
    --use-remote-llm --vlm-env-file /path/to/vlm.env
export VLM_ENDPOINT_URL=https://your-vlm-endpoint.com
deploy/docker/scripts/dev-profile.sh up -p alerts -m verification -H OTHER \
    --use-remote-vlm --llm-env-file /path/to/llm.env
export LLM_ENDPOINT_URL=https://your-llm-endpoint.com
export VLM_ENDPOINT_URL=https://your-vlm-endpoint.com
deploy/docker/scripts/dev-profile.sh up -p alerts -m verification -H OTHER \
    --use-remote-llm --use-remote-vlm
This command will download the necessary containers from the NGC Docker registry and start the agent. Depending on your network speed, this may take a few minutes.
This deployment uses the following defaults:
Host IP: src IP from
ip route get 1.1.1.1LLM model: nvidia/nvidia-nemotron-nano-9b-v2
VLM model: cosmos-reason2 (served via RTVI VLM container)
To use a different IP than the one derived:
-i: Manually specify the host IP address.-e: Optionally specify an externally accessible IP address for services that need to be reached from outside the host.
Note
When using a remote VLM of model-type nim (not openai), see How does a remote nim VLM access videos? for access requirements.
Once the deployment is complete, check that all the containers are running and healthy:
docker ps
Once all the containers are running, you can access the agent UI at http://<HOST_IP>:7777/.
Deploy with Agent Skills#
As an alternative to running the deployment command manually, you can use VSS
Agent Skills from a coding agent such as Claude Code, Codex, or NemoClaw.
First, install the deploy skill as described in Agent Skills and make it
accessible to your coding agent. The host must meet the same deployment requirements listed above (supported GPU/hardware for that profile)
and must meet the Prerequisites.
The deploy skill will choose the <platform> and <mode> to match your system, as detailed in Development Profile GPU Requirements.
Refer to the requirements table for valid platform and mode combinations compatible with your hardware.
Deploy the VSS alerts verification profile.
For edge platforms, ask the deploy skill to use a remote LLM when possible. Local LLM/VLM sharing on the edge GPU is supported, but a remote LLM is recommended for better response time. See VSS Agent Customization - Configure LLM for remote LLM endpoint options.
Deploy the VSS alerts verification profile on this DGX-SPARK machine with a remote LLM.
Deploy the VSS alerts verification profile on this IGX-THOR machine with a remote LLM.
Deploy the VSS alerts verification profile on this AGX-THOR machine with a remote LLM.
If you would like to modify the workflow to work with other videos or usecases, you can update the following files:
deploy/docker/developer-profiles/dev-profile-alerts/vlm-as-verifier/configs/alert_type_config.jsonModify the “output_category” and “user” fields here. “output_category” modifies the category type that shows up in the agent UI. “user” is the user prompt that is sent to the VLM for verification of each alert clip.
deploy/docker/developer-profiles/dev-profile-alerts/deepstream/configs/config_triton_nvinferserver_gdino.txtUpdate the “type_name” field under “postprocess” to change the objects that are detected by Grounding DINO. By default this is “person” with a threshold of 0.5. This can be modified to support multiple classes by using “ . “ as a delimiter.
deploy/docker/developer-profiles/dev-profile-alerts/vss-behavior-analytics/configs/vss-behavior-analytics-config.jsonUpdate the “value” field under
"name": "fovCountViolationIncidentObjectType"to change the objects that Behavior Analytics creates alerts for.
deploy/docker/developer-profiles/dev-profile-alerts/vlm-as-verifier/parsers/(optional)Drop a Python module exposing a parser class with a
parse(self, raw_response: str) -> dictmethod, then setvlm.response_parserinconfig.ymlto its dotted path. Use this to replace the built-in YES/NO verification parsing with classification, analytics, or enrichment outputs. See Pluggable Response Parser for the full contract, examples, and error handling.
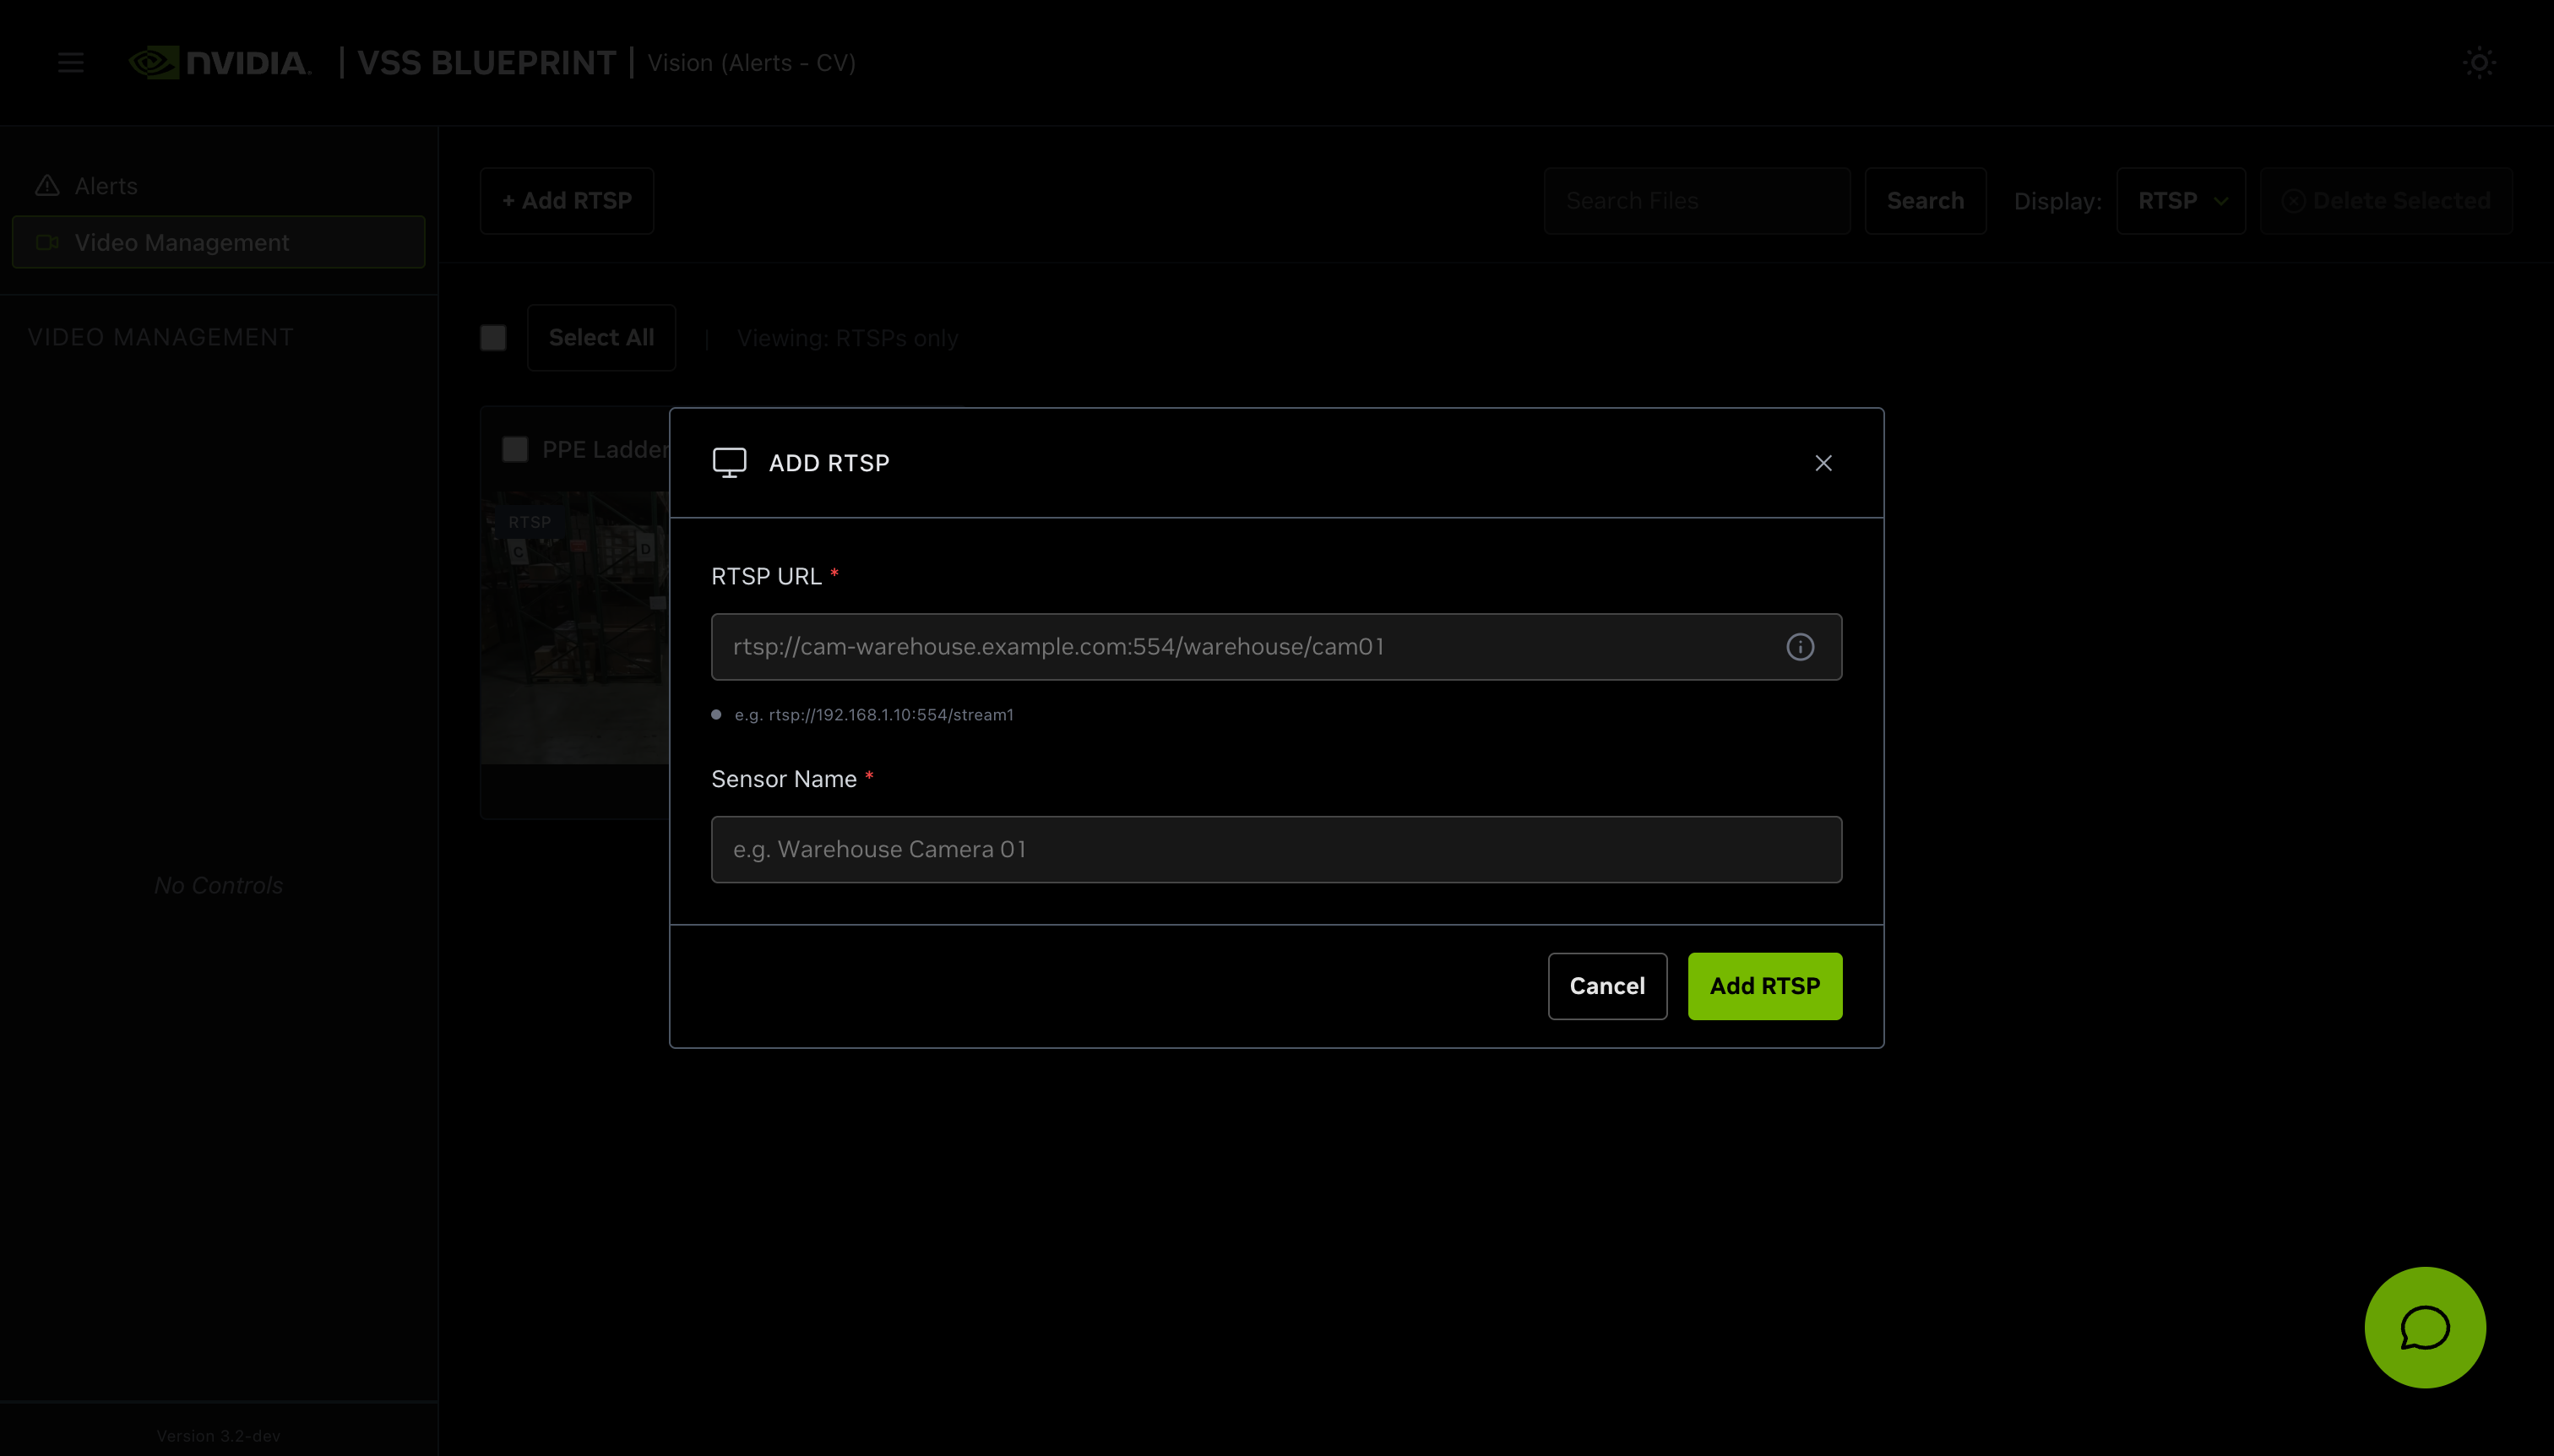
Step 2: Add a video stream#
Add an RTSP stream by clicking the + Add RTSP button on the Video Management tab in the agent UI. If you do not have an RTSP stream, you can use NVStreamer at http://<HOST_IP>:31000 to upload a video file and create an RTSP stream.
For this profile, use the sample-warehouse-ladder.mp4 stream.
Note
By default, this profile only supports up to one stream being processed at a time.
This can be increased by modifying the NUM_SENSORS environment variable in the deploy/docker/developer-profiles/dev-profile-alerts/.env file before deployment. On RTX PRO 6000, up to 4 streams at 10fps have been tested to work.
On edge platforms like DGX Spark, IGX Thor, and AGX Thor, up to 1 stream at 10fps has been tested to work due to GPU requirements.
Step 3: Verify pipeline components#
Open the Kibana UI at http://<HOST_IP>:7777/kibana/app/home#/ and navigate to the Discover tab.
Verify the following data indices are populated. It may take a few minutes for data to start appearing after adding the stream:
mdx-raw-*- Raw detection datamdx-incidents-*- Generated incidentsmdx-vlm-incidents-*- VLM-verified alerts
If the indices do not show data, check the following items:
Ensure that the Perception service is running and processing the stream. View the container logs with
docker logs -f vss-rtvi-cvand confirm that the engine files are built and the added stream is being processed. Common causes of failure include model download errors during startup and insufficient GPU memory.Confirm that the labels emitted by the Perception model match the labels that Behavior Analytics expects. Behavior Analytics processes only the object type specified by the
fovCountViolationIncidentObjectTypefield indeploy/docker/developer-profiles/dev-profile-alerts/vss-behavior-analytics/configs/vss-behavior-analytics-config.json.
Step 4: View alerts in the Agent UI#
Launch the Agent UI at http://<HOST_IP>:7777/.
List streams to verify connectivity, then use the Alerts tab to list alerts. Select the verified alerts option to view VLM-verified alerts.
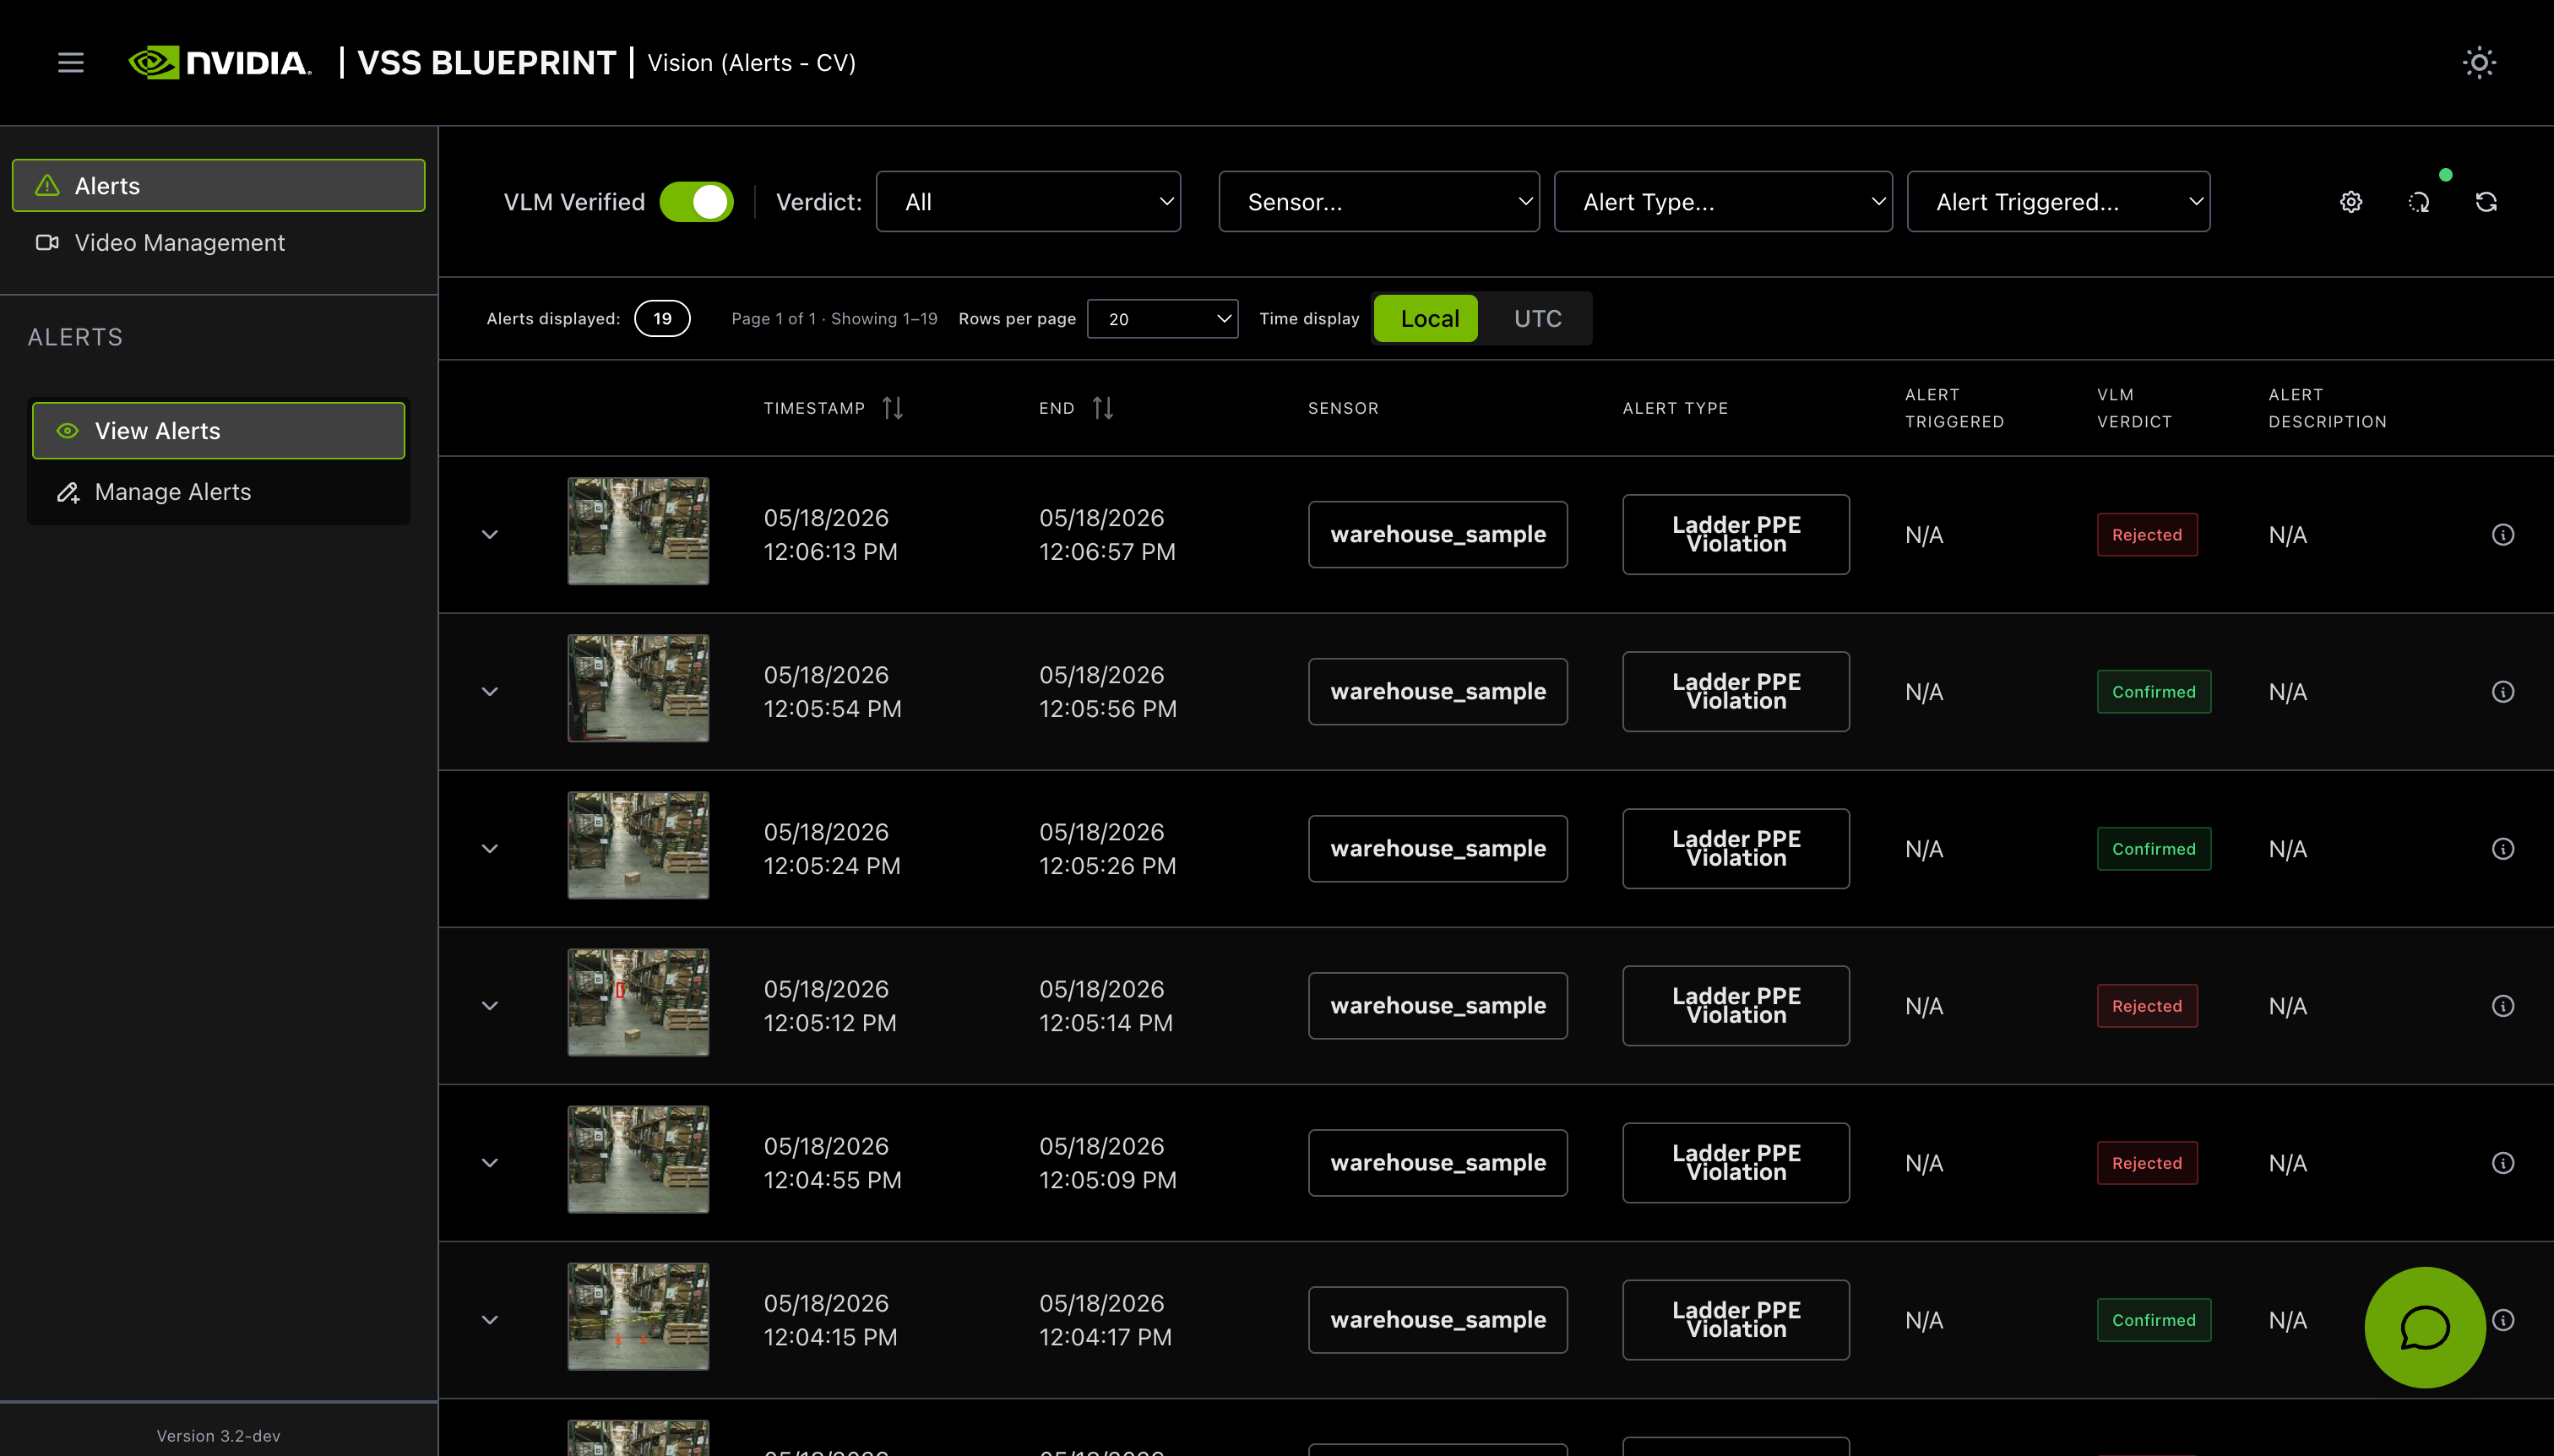
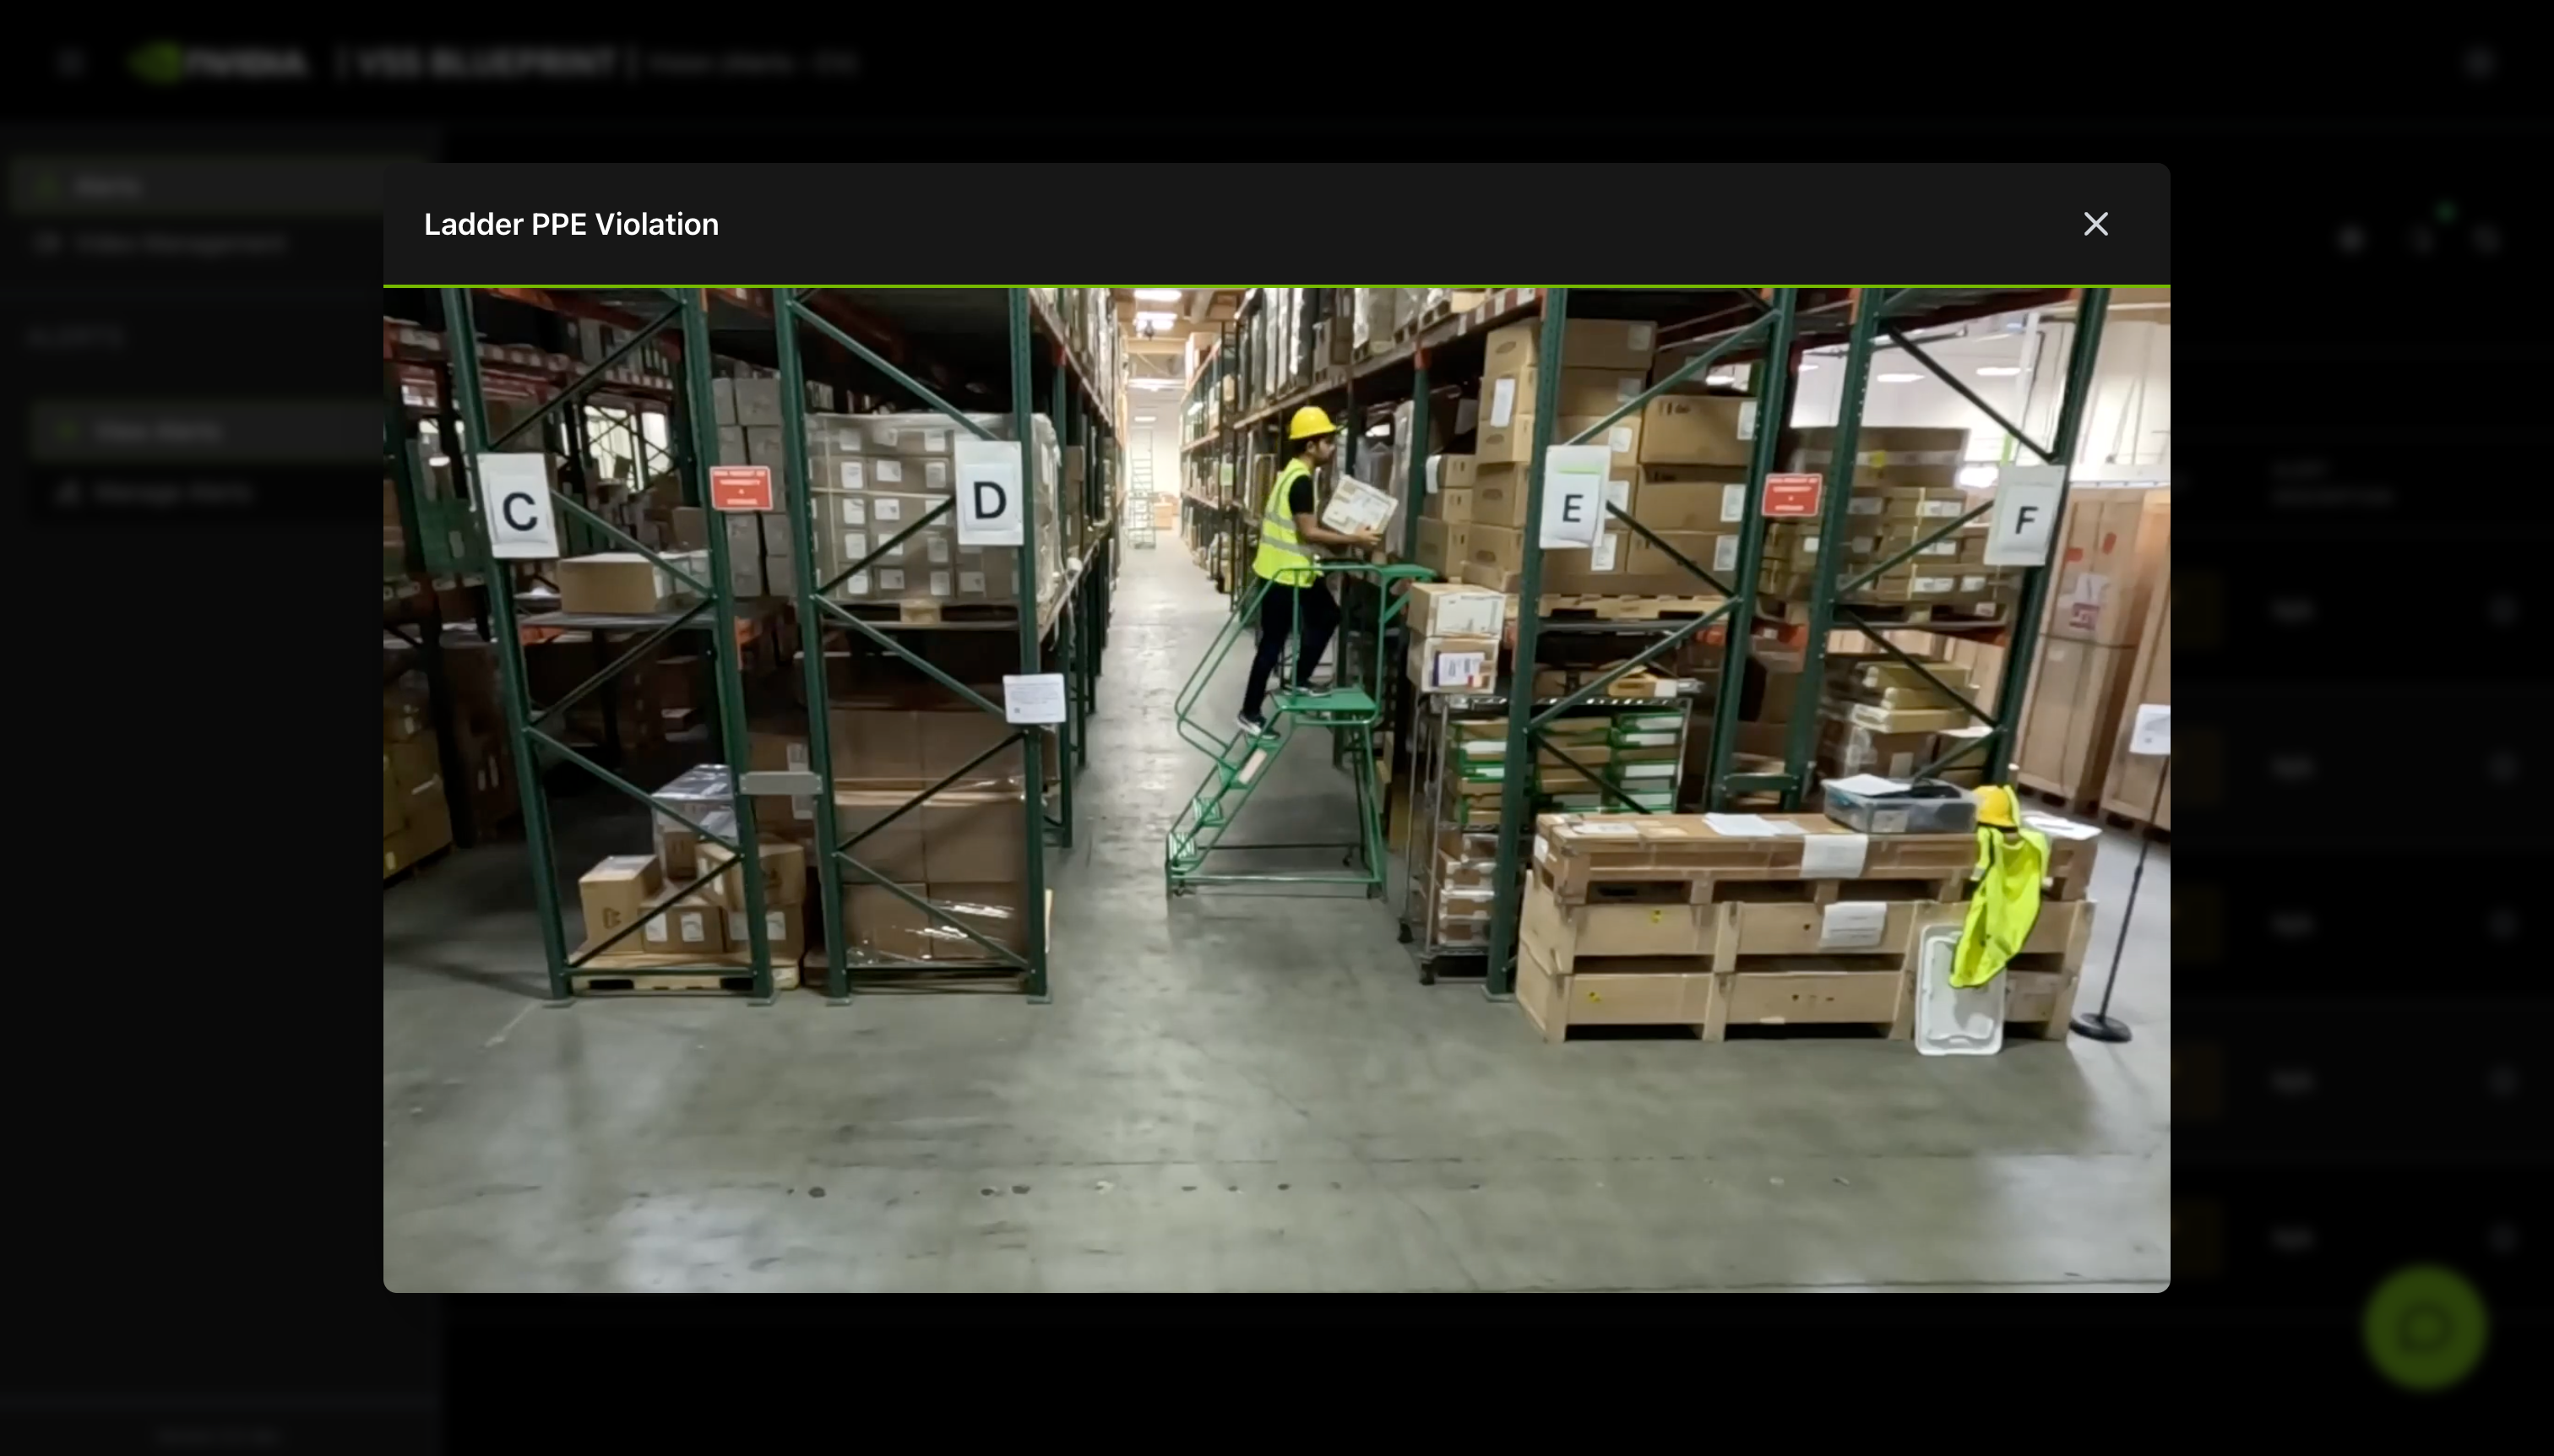
You can then click on a video thumbnail to play the video and view the alert. When the bounding box overlay is enabled, playback includes bounding boxes over objects of interest. This overlay is off by default; to enable it, set vst_config.add_overlay: true on the alert verification service and NEXT_PUBLIC_ALERTS_TAB_MEDIA_WITH_OBJECTS_BBOX=true for the Agent UI.
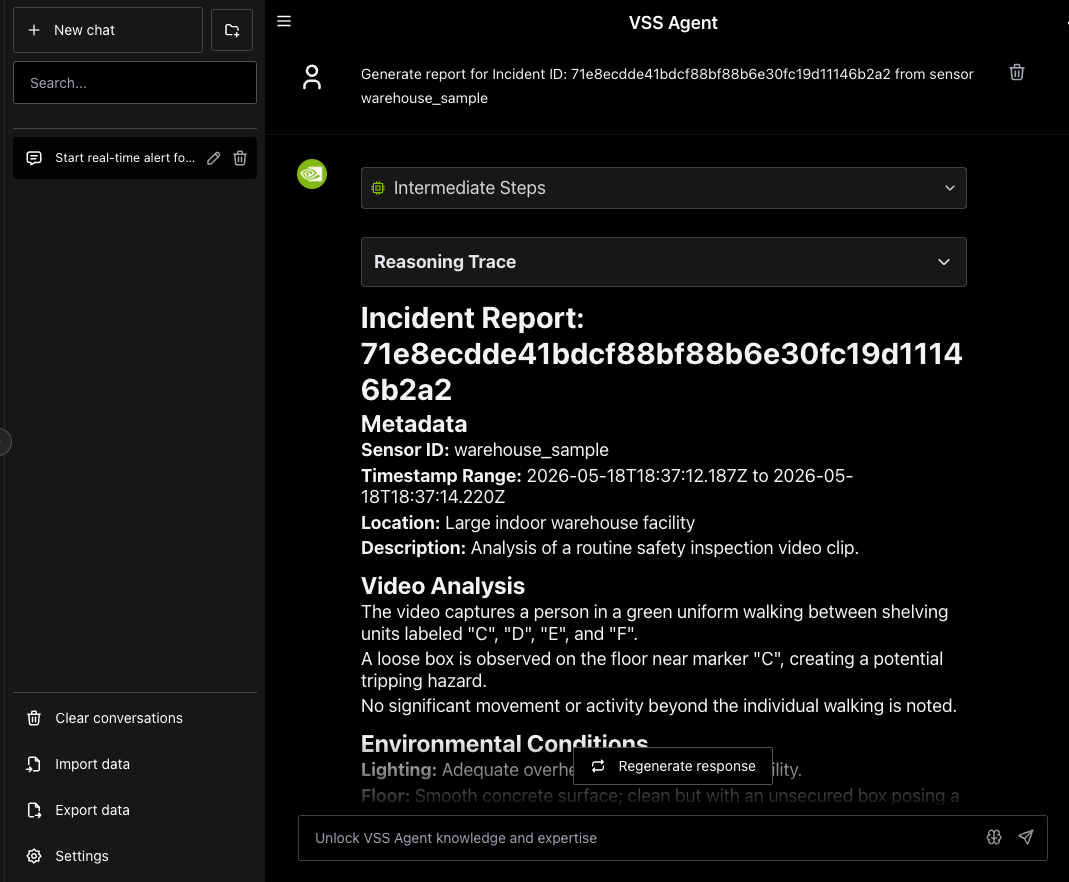
Step 5: Generate a Report for the Alert#
You can use the chat interface to request creation of a report for the generated alerts. The report is currently generated in markdown format and displayed in the VSS UI.
As a first step, identify the alert ID for which the report needs to be generated. Use the chat interface to retrieve the ID by listing recent alerts by count, or expand any alert in the Alerts tab to display the Id field along with associated metadata.
Now, use the ID to request generation of the report while also specifying the associated sensor, as shown in the sample image below.
Step 6: Teardown the Agent#
To tear down the agent, run the following command:
deploy/docker/scripts/dev-profile.sh down
This command will stop and remove the agent containers.
Service Endpoints#
Once deployed, the following services are available:
Service |
URL |
|---|---|
VSS UI |
|
Kibana UI |
|
NVStreamer UI |
|
VST UI |
|
Phoenix UI |
|
Next Steps#
Once you’ve familiarized yourself with the alert verification workflow, you can explore:
Modifying the alert prompt in the Alerts Microservice configuration.
Adjusting rate limit settings to control alert verification frequency.
Configuring G-DINO prompting and class thresholds for custom detection scenarios.
Known Issues#
Some VLM inaccuracies might be observed depending on the model and configuration used with the RTVI VLM container.
Video snippets generated for alerts may be short (for example, only a couple of seconds) depending on behavior analytics processing of the specific video, which could impact VLM accuracy. To address this issue, modify the fovCountViolationIncidentThreshold setting to the desired minimum alert clip duration in deploy/docker/developer-profiles/dev-profile-alerts/vss-behavior-analytics/configs/vss-behavior-analytics-config.json.
Video playback duration for verified alerts may not exactly match the alert timestamps.
Report generation may produce inaccurate results. As a potential workaround, remove the
use_base64: trueline undervideo_understanding_isoindeveloper-profiles/dev-profile-alerts/vss-agent/configs/config.yml.If perception crashes and restarts, streams are not automatically re-added and alerts will not be generated.
For remote VLM and LLM deployments, the alert verification timeout may need to be increased from the default value of 5 seconds. See Alert Verification VLM Configuration Options for specific details.
VLM verdict verification can fail in the UI even when VLM requests are processed successfully. Alert Bridge response parsing accepts only raw verdicts such as
A/BorYes/Nobefore serializing them toconfirmedorrejected. As a result, a semantically validrejectedverdict from Cosmos Reason can fail schema validation and be persisted asverification-failed.The VST UI is externally accessible on both port 30000 and 30888 because both ports are exposed on the host network. For security hardening, consider using a firewall to allowlist only the required VST ingress port.