VSS Reference User Interface#
Overview#
The major functionalities are encapsulated Tab-wise. Tabs represent the major functionalities of the UI and can be enabled/disabled based on the deployed blueprint/profile. Below the list of tabs on the main left sidebar, exists the controls pertaining to the current tab.
Each tab is described in detail in its respective section below.
The UI provides a global Chat sidebar to interact with an agentic backend service (if the service is deployed). This Chat sidebar is available across multiple tabs (Search, Alerts, etc.) and provides a more integrated experience.
The UI supports both dark and light themes. To change the theme, click the theme toggle button in the top right corner.
Global Chat Sidebar#
Note
The Global Chat Sidebar replaces the separate Chat Tab that previous VSS use cases and workflows relied on.
The Chat Tab is no longer actively documented from this release on.
You can still enable either surface at deployment time through environment variables on the UI service.
For the sidebar, use variables matching
NEXT_PUBLIC_(ENABLE_CHAT_SIDEBAR|CHAT_SIDEBAR_.*|SIDEBAR_CHAT_.*).
For the legacy Chat Tab, set NEXT_PUBLIC_ENABLE_CHAT_TAB and the other NEXT_PUBLIC_* variables.
The Global Chat sidebar can be opened by clicking the Chat icon at the bottom-right corner of the screen as shown above.
The Global Chat Sidebar is a persistent, collapsible chat panel available across multiple tabs (Search, Alerts, etc.) that provides direct access to the Agentic backend service without navigating away from the current view.
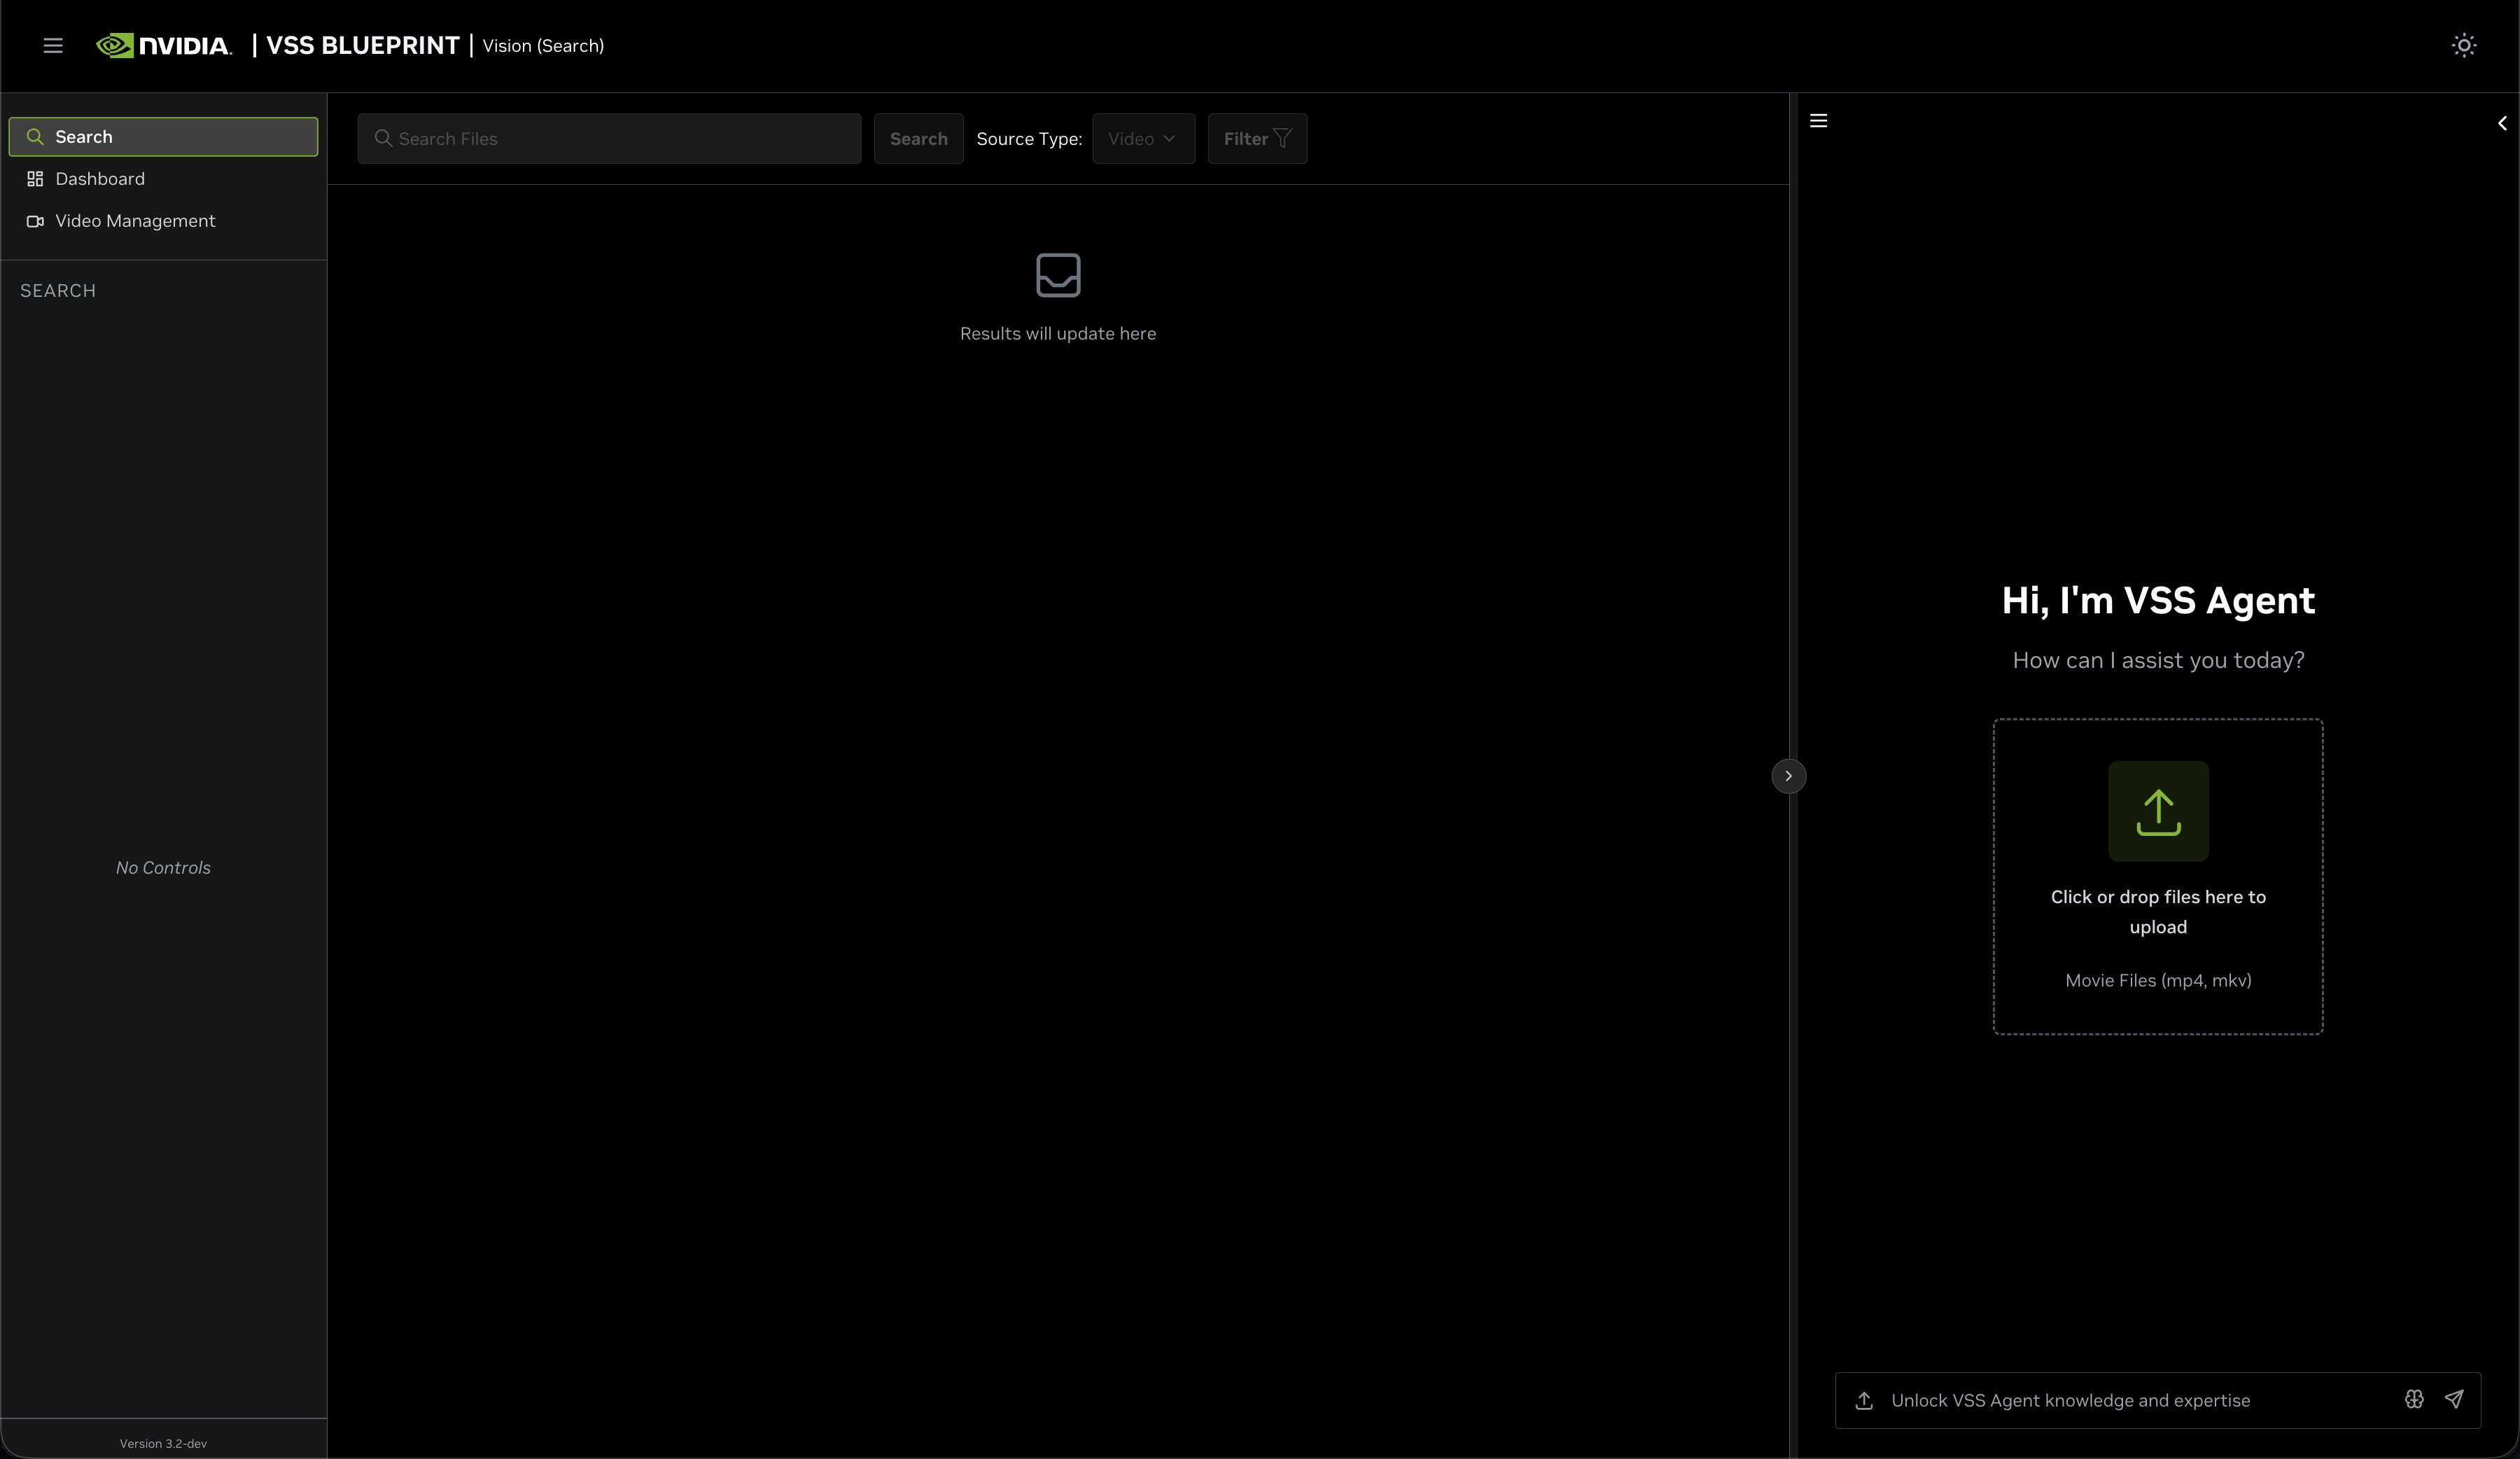
Toggle:
Click the chat icon at the bottom-right corner of the screen to open.
Click the minimize button on the left edge of the sidebar to close it.
The sidebar is resizable by dragging its left edge (between 1/3 and 2/3 of the content area width)
Key Features:
Natural language conversational interaction with the Vision Agent
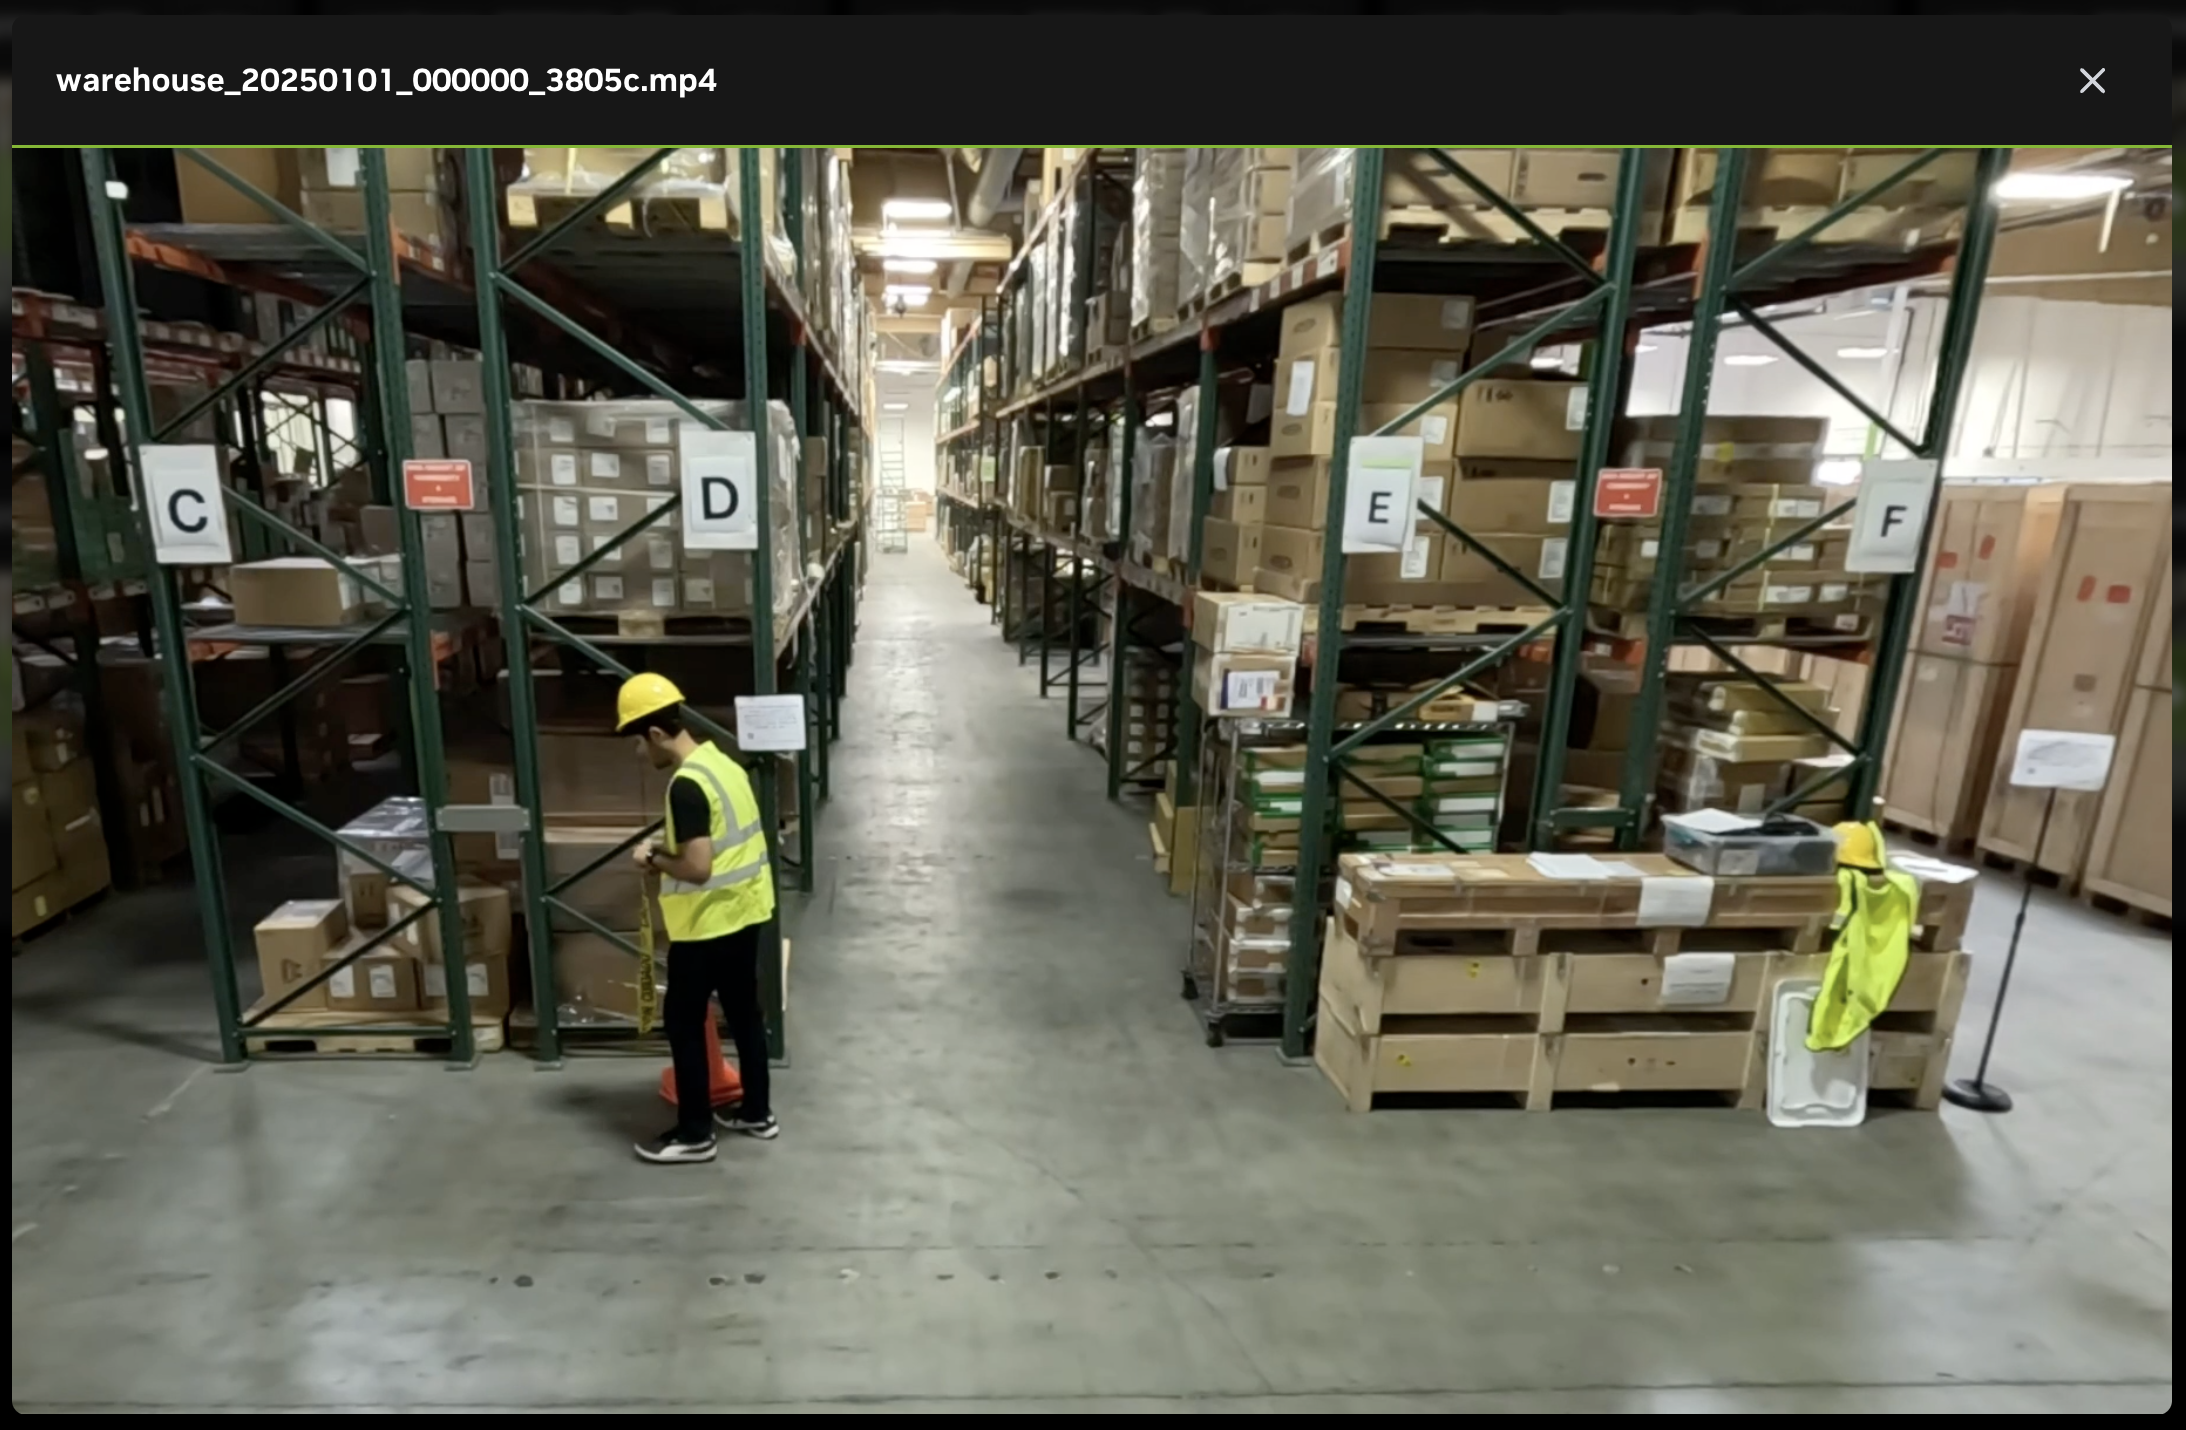
Video upload for agent analysis (drag-and-drop or click to browse; MP4, MKV supported)
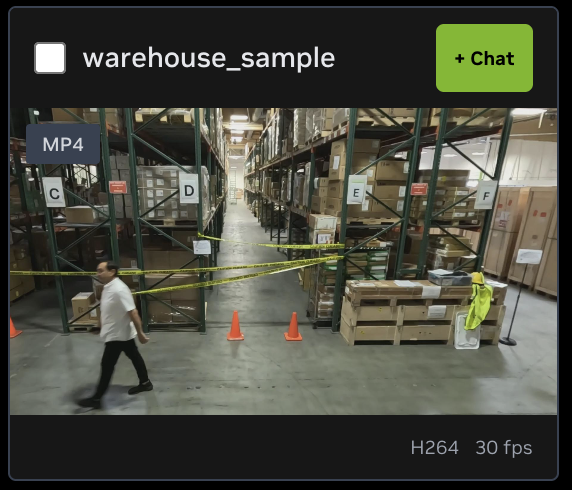
Context-aware queries — attach video clips from search results or alert metadata as context using the “+ Chat” button on video cards or the “Generate Report” button in alert rows
Agentic query results are reflected directly in the current tab’s content area (e.g., search results populate the Search Tab grid), if applicable.
Chat history with new-conversation and folder-organization support
Unseen response indicator (orange border on the “Chat” tab) when responses arrive while the sidebar is collapsed
Send applicable agent parameters (supported based on the deployed blueprint/profile) along with the query to the agentic backend service.
Preserve the conversation context while working across multiple tabs.
Chat Input#
Type your question in the input box at the bottom of the sidebar. Press Enter or click the send button to submit the query to the Vision Agent. The agent processes the query and streams the response in real time.
For streamed responses, each answer card includes an “Insights” component that shows the intermediate steps of the agent’s reasoning as the response is generated.
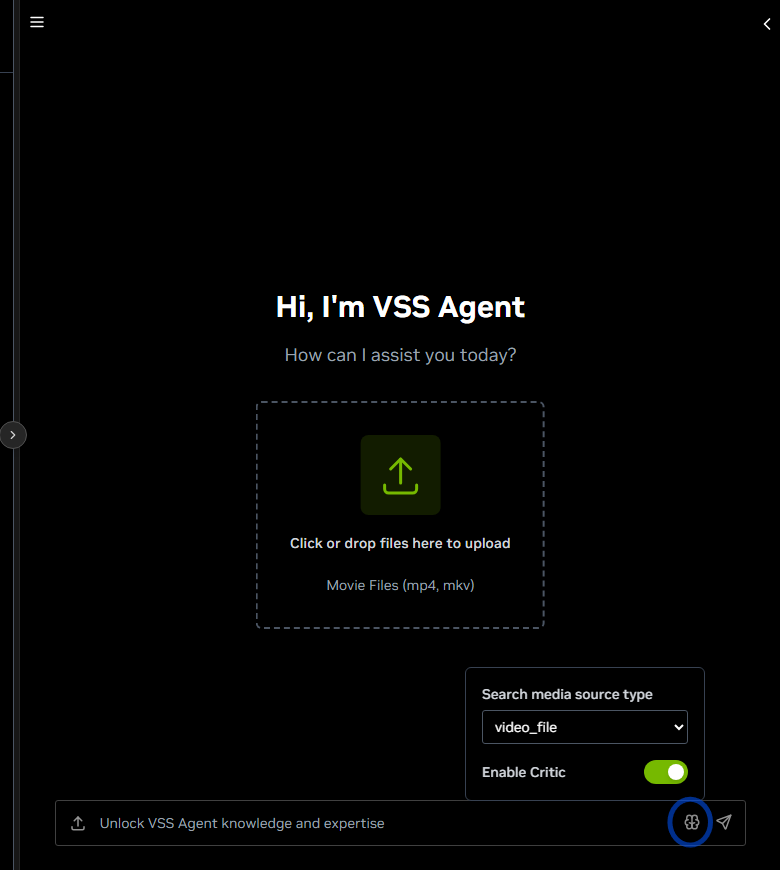
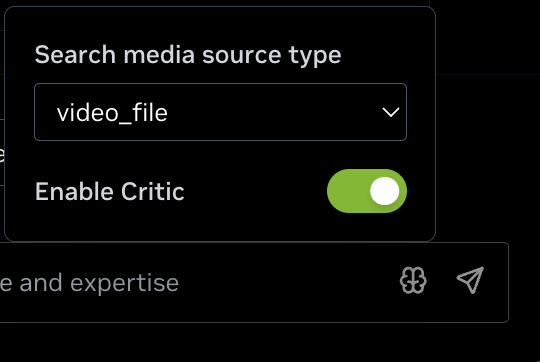
When the current deployment defines agent parameters, an Agent Parameters control appears in the chat input bar (to the left of the send button). Click it to open a popover, set the supported values, and submit your query. The selected parameters are sent with each request to the agentic backend service.
The available fields depend on the deployed blueprint or profile. For example, a search deployment may expose Search media source type and Enable Critic; a base profile may expose reasoning toggles. If no parameters are configured for the deployment, the control is not shown.
Note
Configure sidebar agent parameters at deployment time with
NEXT_PUBLIC_SIDEBAR_CHAT_CHAT_API_CUSTOM_AGENT_PARAMS_JSON on the UI service.
Set the value to a JSON object with a params array. Each entry supports name, label,
type (boolean, string, number, or select), default-value, optional options for
select, optional changeable (defaults to true), and optional tooltip-info.
Video Upload#
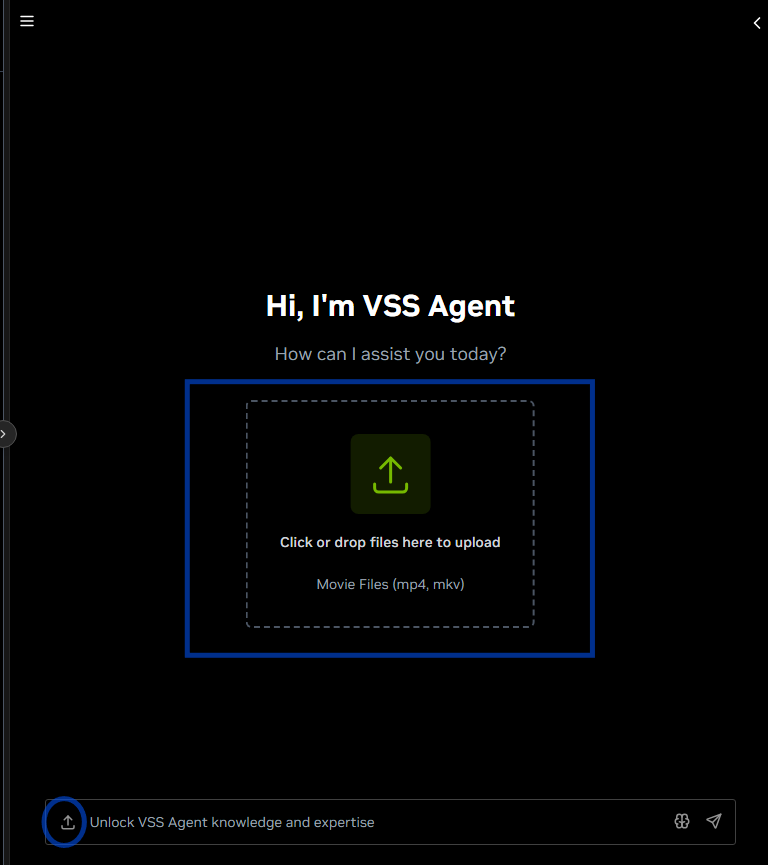
The Chat Sidebar supports uploading video files for analysis by the Agent.
Drag and Drop: Drag video files directly into the upload area
Click to Browse: Click the upload area to open a file browser
Upload Button: Click the upload icon button next to the chat input box
Supported Formats: MP4, MKV
After uploading, the agent can analyze the video content and answer questions about it.
Note
Upload functionality through the Chat Sidebar will not be available if disabled in the deployment scripts.
Controls/Settings Panel#
The collapsible left side panel inside the Chat Sidebar contains chat controls:
New chat: Start a new conversation
New folder: Create a new folder to organize conversations
Search: Search through existing conversations
Chat History: List of previous conversations (shows “No data” when empty)
Export data: Export conversation data to a file
Import data: Import (a previous exported) conversation data from a file
Settings: Open the settings dialog
The settings dialog allows you to configure:
“HTTP URL for Chat Completion” — The URL of the agent query HTTP endpoint.
“Websocket URL for Chat Completion” — The URL of the agent query websocket endpoint.
“Websocket Schema” — The schema of the agent query websocket endpoint.
“Enable Intermediate Steps” — Show or hide the “Insights” component in the response.
“Expand Intermediate Steps by default” — Auto-expand the hierarchy in the “Insights” component.
“Override intermediate Steps with same Id” — Show nested hierarchy view of agent call sequences.
Interaction with Tabs#
The Chat Sidebar integrates with different tabs: Example flows are:
In the Search Tab, when the sidebar is open, manual search controls are disabled. Queries submitted through the sidebar trigger an agentic search, and matching video results populate the Search Tab’s content area. Use the “+ Chat” button on video cards to attach clip context to the sidebar input (see + Chat Button).
In the Alerts Tab, use the “Generate Report” button in an expanded alert row to send alert metadata to the Chat Sidebar for AI-powered analysis.
Video/Sensor related context can be added to the chat input by clicking the “+ Chat” button on video/sensor cards in the Search Tab, Video Management Tab.
Unseen Response Indicator#
When a response arrives while the Chat Sidebar is collapsed, the Chat icon shows an orange border to indicate unseen content. Clear the indicator by:
Opening the Chat Sidebar — viewing the content marks it as seen.
Clicking the cancel button on the orange border — marks content as seen without opening the sidebar.
Tabs#
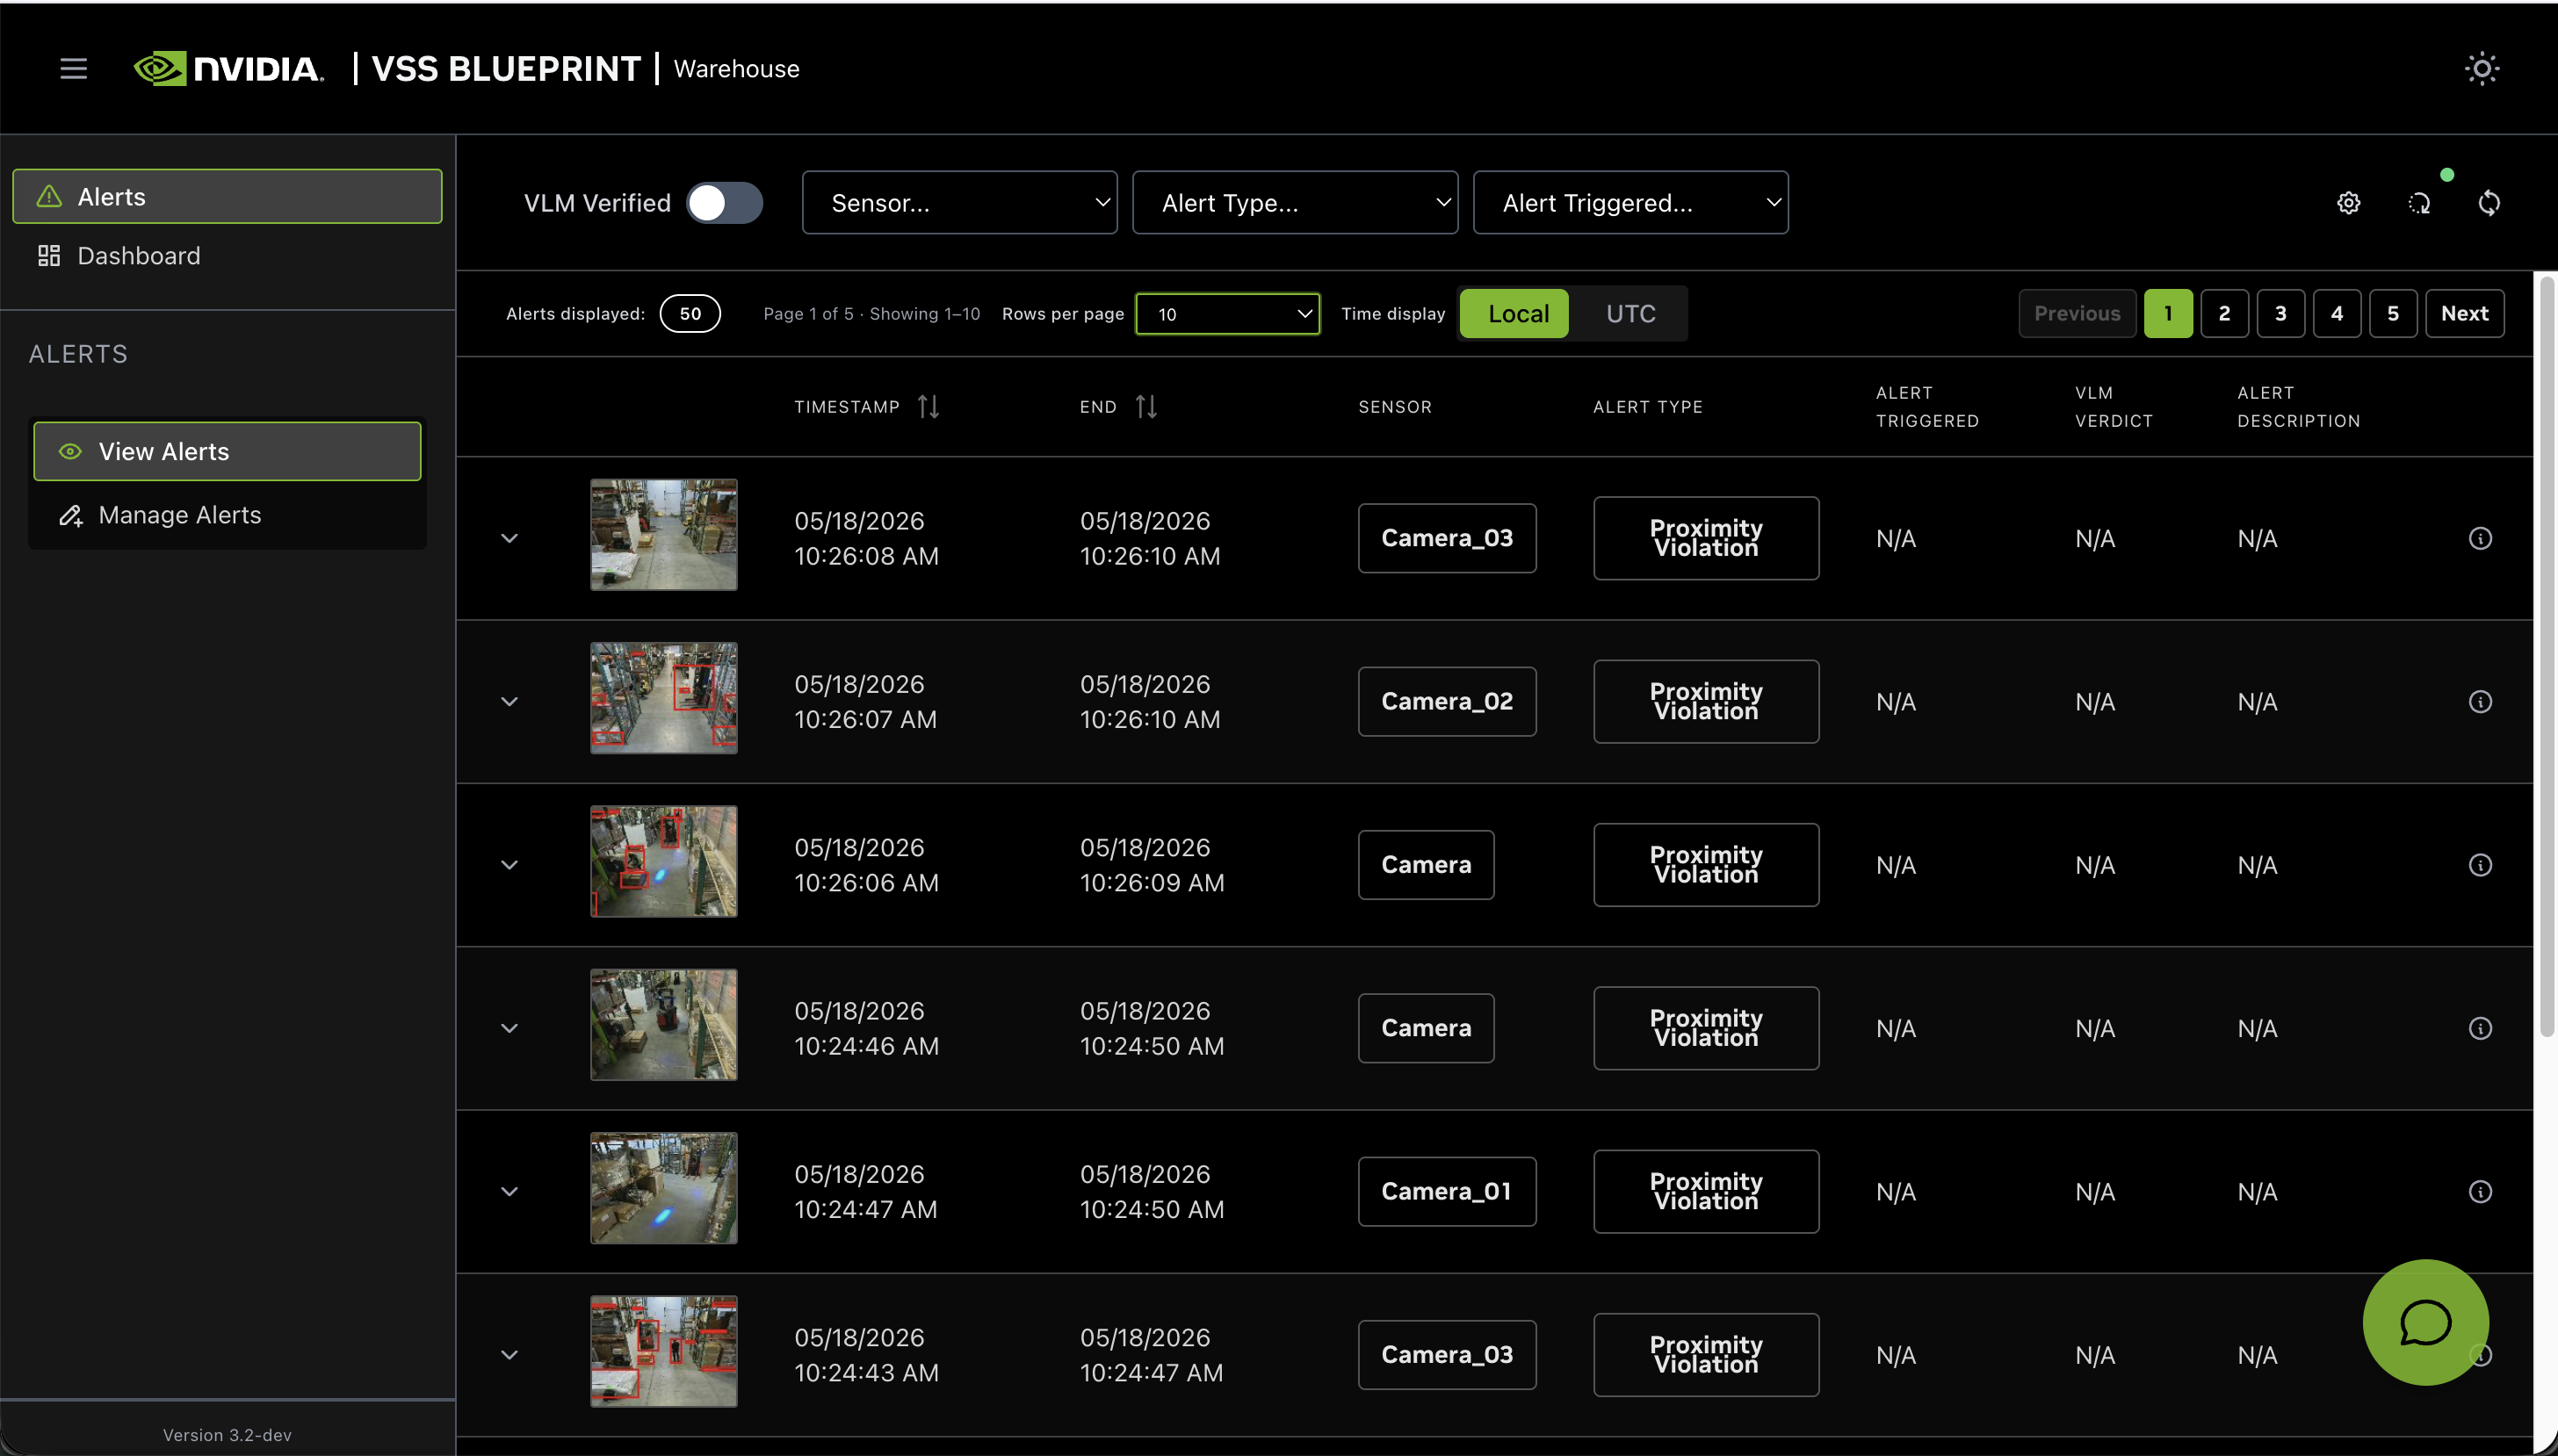
1. Alerts Tab#
The Alerts Tab provides a complete interface for monitoring, investigating, and managing AI-detected incidents. It is organized into two views accessible from the left sidebar:
View Alerts — Real-time monitoring dashboard for viewing, filtering, and investigating detected incidents.
Manage Alerts — Configuration interface for creating and managing real-time alert rules.
Key Features:
[View Alerts] Sidebar navigation with View Alerts and Manage Alerts tabs
[View Alerts] Advanced filtering (verification, verdict, sensor, type, trigger)
[View Alerts] Configurable query range and fetch size via Alerts Settings
[View Alerts] Sortable table with pagination and expandable metadata
[View Alerts] Load More functionality for incremental data retrieval
[View Alerts] Integrated video playback with optional bounding box overlay
[View Alerts] Auto-refresh with configurable intervals
[Manage Alerts] Real-time alert rule management (create, duplicate, delete)
Light/Dark theme support
Default Configuration:
These initial settings are configured via system environment variables:
Setting |
Default |
Environment Variable |
|---|---|---|
VLM Verified |
ON |
|
Query Range (Time Window) |
10 minutes |
|
Fetch Size (Max Results) |
100 alerts |
|
Auto-Refresh Interval |
1 second |
|
Rows Per Page |
20 |
Hardcoded default (overridable per session) |
Max Search Time Limit |
Unlimited |
|
Alerts API URL |
— |
|
Media Bounding Box Overlay |
OFF |
|
Sidebar Navigation#
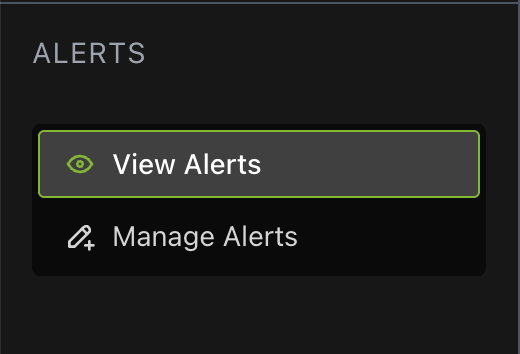
The left sidebar contains a vertical tab list with two tabs:
View Alerts (eye icon) — Opens the alerts monitoring dashboard.
Manage Alerts (pencil icon) — Opens the alert rules management interface.
The selected tab is persisted in the session, so it is preserved when navigating away and back.
When Manage Alerts is selected, a “Create alert rule” button appears below the tabs to quickly add a new rule.
View Alerts#
The View Alerts panel is the primary monitoring dashboard. It consists of:
Filter Controls — Top bar with filters, settings, and refresh controls
Alerts Table — Sortable, paginated table with video playback and metadata
Filter Controls#
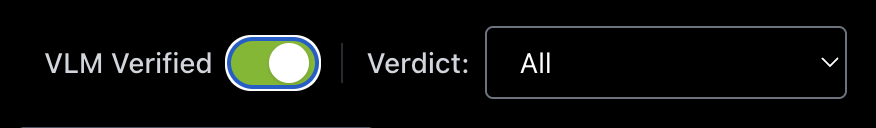
VLM Verified Toggle#
|

|
Filters alerts by VLM verification status:
ON 🔵 = Show only VLM-verified alerts
OFF ⚪ = Show all unverified alerts
Verdict Filter#
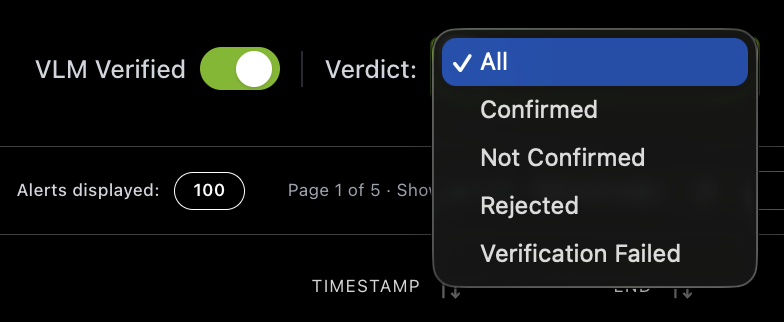
Visible only when VLM Verified is ON. Options:
All
Confirmed (true positives)
Not Confirmed
Rejected (false positives)
Verification Failed
Sensor / Alert Type / Alert Triggered#
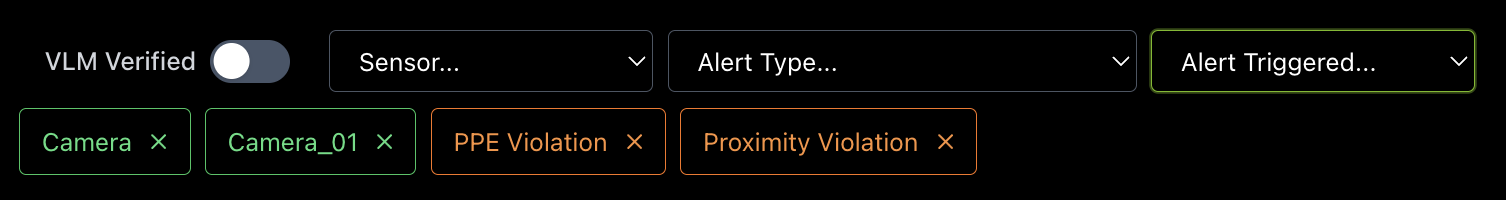
Three dropdown filters for narrowing results:
Click a dropdown → Select a value → A filter tag appears below
Click ✕ on a tag to remove it
Quick add: Click sensor, alert type, or alert triggered values directly in the table rows to add them as filters
Filter Tags: Color-coded badges (🔵 Sensor • 🟠 Alert Type • 🟢 Triggered). Multiple filters use AND logic.
Alerts Settings#
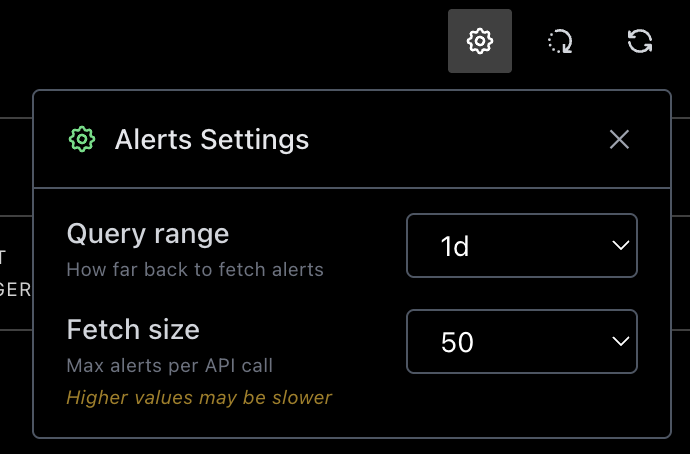
Click the gear icon (⚙) in the filter bar to open the Alerts Settings popover. This popover contains:
Query Range:
Controls the time window for fetching alerts from the API.
Preset options: 10 min (default) • 20 min • 30 min • 1h • 2h
Custom: Select “Custom” to enter a specific duration. If a maximum search time limit is configured (via
NEXT_PUBLIC_ALERTS_TAB_MAX_SEARCH_TIME_LIMIT), the custom value will be capped accordingly. A value of0means unlimited.
Tip: Shorter query ranges load faster and reduce server load.
Fetch Size:
Controls the maximum number of alerts returned per API call.
Preset options: 50 • 100 • 200 • 500 • 1000 • 2000 • 5000
Custom: Select “Custom” to enter a value between 10 and 5000
Note: Higher fetch sizes may result in slower API responses. The fetch size also determines when the “Load More” button becomes available — if the API returns a batch equal to the fetch size, more data may be available.
Refresh Controls#
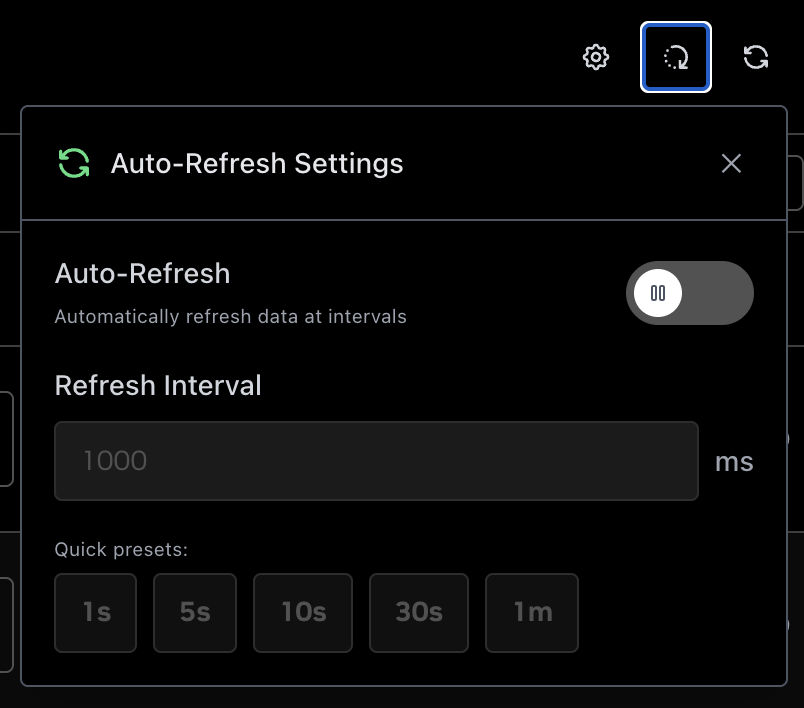
Auto-Refresh (↻ icon): Configurable intervals — 1s / 5s / 10s / 30s / 1min. When enabled, the icon turns blue with a pulsing dot indicator.
Manual Refresh (🔄 icon): Click to refresh data immediately. The icon spins while loading.
Best Practice: Use 1–5s intervals for active monitoring, 30s–1min to reduce load, and disable auto-refresh during detailed analysis.
Alerts Table#
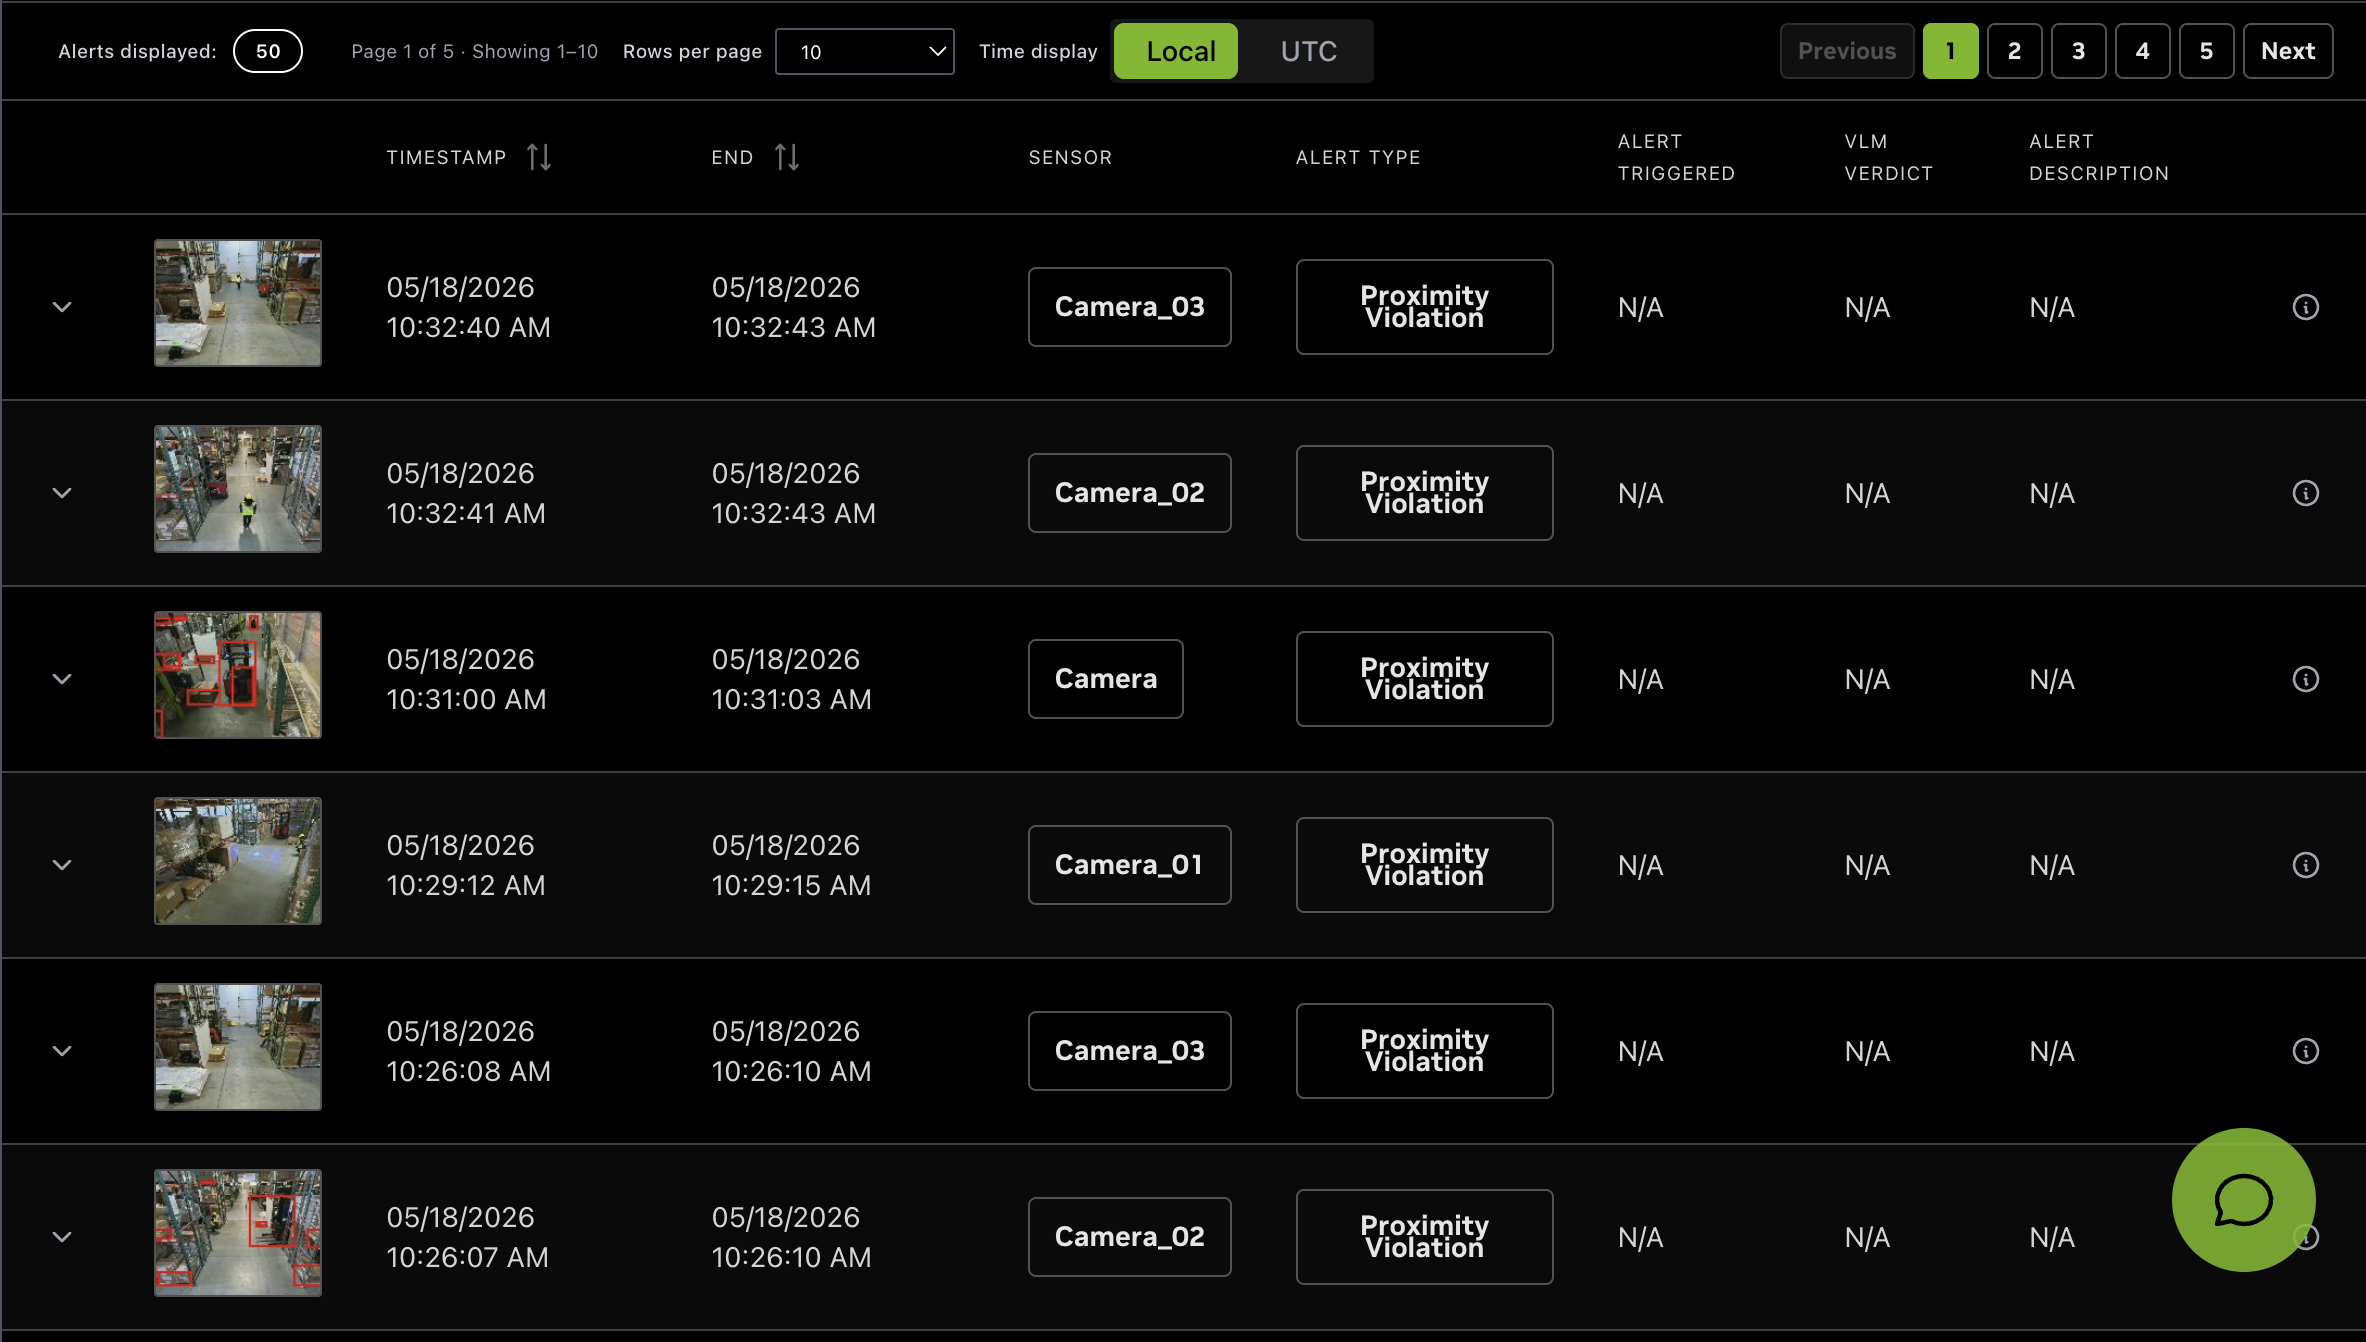
Table Toolbar#
The sticky toolbar above the table header provides:
Alerts displayed — Total count of alerts matching current filters
Pagination summary — Shows “Page X of Y · Showing start–end” when pagination is active
Rows per page — Control how many rows are displayed per page. Presets: 10 • 20 • 50 • 100 • 200 • 500, or enter a custom value (1–500)
Time display — Toggle between Local time and UTC for timestamps shown in the table
Columns#
Column |
Description |
▼/▲ |
Expand/collapse metadata |
Thumbnail |
Video preview (click to play) |
Timestamp |
Alert start time (sortable: ↑ ↓ ⇅) |
End |
Alert end time (sortable: ↑ ↓ ⇅) |
Sensor |
Sensor ID (click to add as filter) |
Alert Type |
Alert classification (click to add as filter) |
Alert Triggered |
Module that detected the alert (click to add as filter) |
VLM Verdict |
🟢 Confirmed • 🔴 Rejected • 🟡 Failed • ⚪ N/A |
Alert Description |
Alert details text |
ⓘ |
Expand/collapse metadata |
Sorting#
Click the Timestamp or End column headers to cycle through sort states:
1st click = Ascending ↑
2nd click = Descending ↓
3rd click = Reset to default ⇅
Pagination#
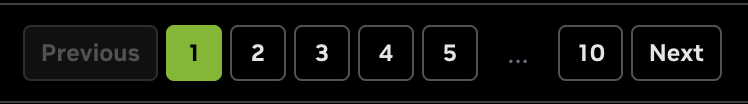
The table supports client-side pagination:
Page navigation — Previous/Next buttons and page number buttons with ellipsis for large page counts
Rows per page — Adjustable from the table toolbar (presets: 10, 20, 50, 100, 200, 500, or custom 1–500)
Auto-reset — The table automatically returns to page 1 when filters, query range, VLM settings, page size, or sort order change
Load More Alerts#

When additional data may be available beyond the current fetch size, a “Load more alerts” button appears at the bottom of the last page.
The button shows the batch size: “Load more alerts (up to N)”
Clicking it fetches older alerts and appends them to the existing dataset
Auto-refresh must be disabled to use Load More — a tooltip explains this when auto-refresh is active
After loading more alerts, the table resets expanded rows and sort state while preserving the current view
How it works: The Load More function queries for alerts older than the earliest alert in the current dataset. Results are merged and deduplicated by alert ID.
Expandable Rows#
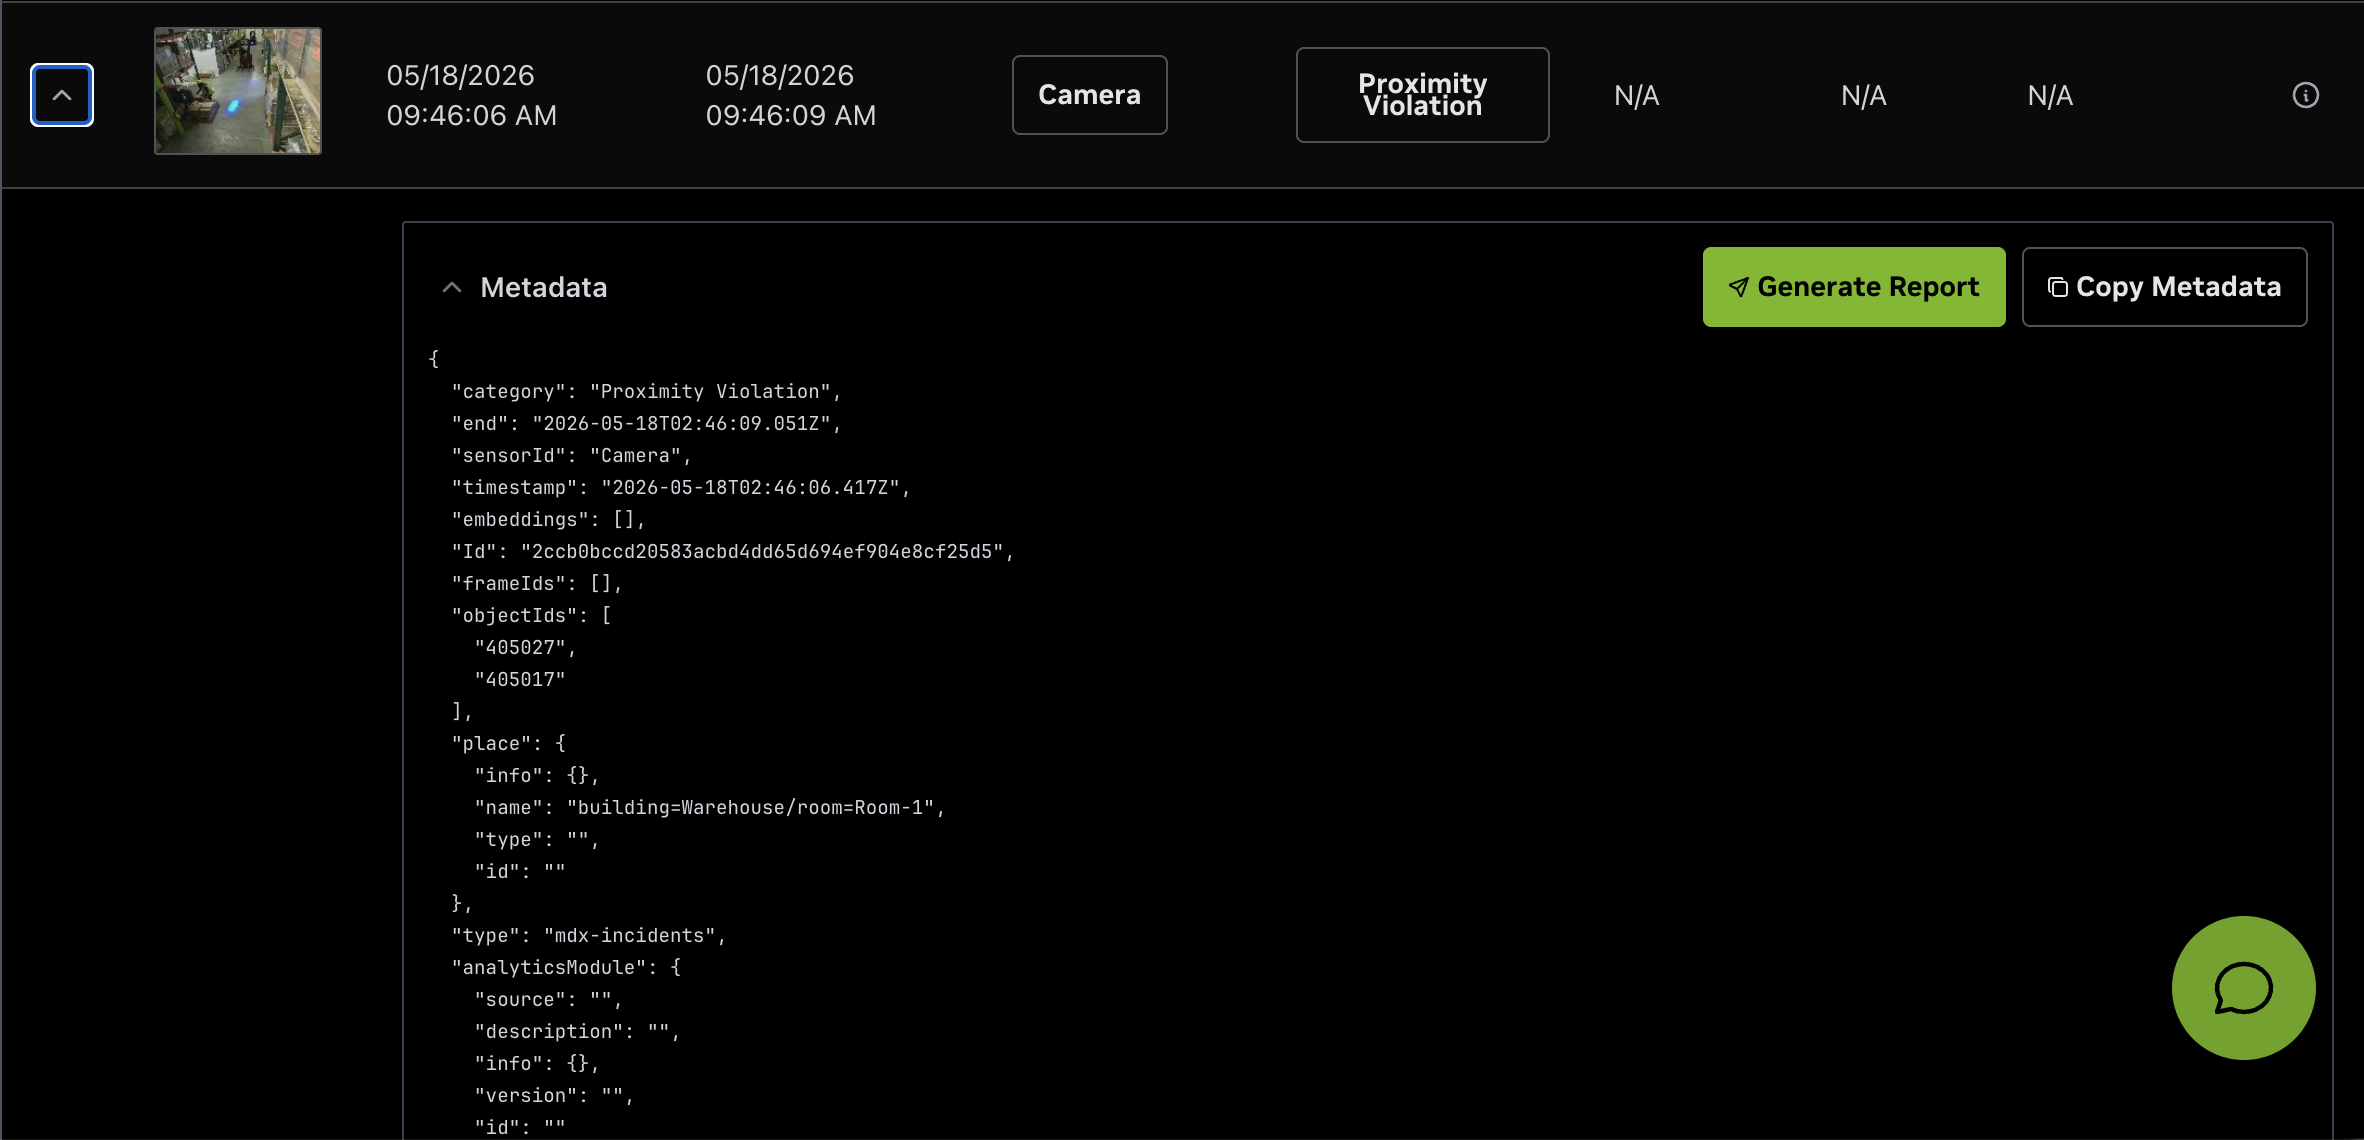
Click ▼ or ⓘ to expand a row and view its Metadata section.
Available actions in expanded rows:
Generate Report — Sends alert metadata to the Global Chat Sidebar for AI-powered analysis (available when a report prompt template is configured). The Chat Sidebar opens automatically with the alert context pre-filled, allowing follow-up questions about the incident.
Copy Report Prompt — Copies a formatted template with metadata for AI analysis to clipboard
Copy Metadata — Copies the complete JSON metadata for debugging or sharing
All copy actions show a visual confirmation.
Video Playback#
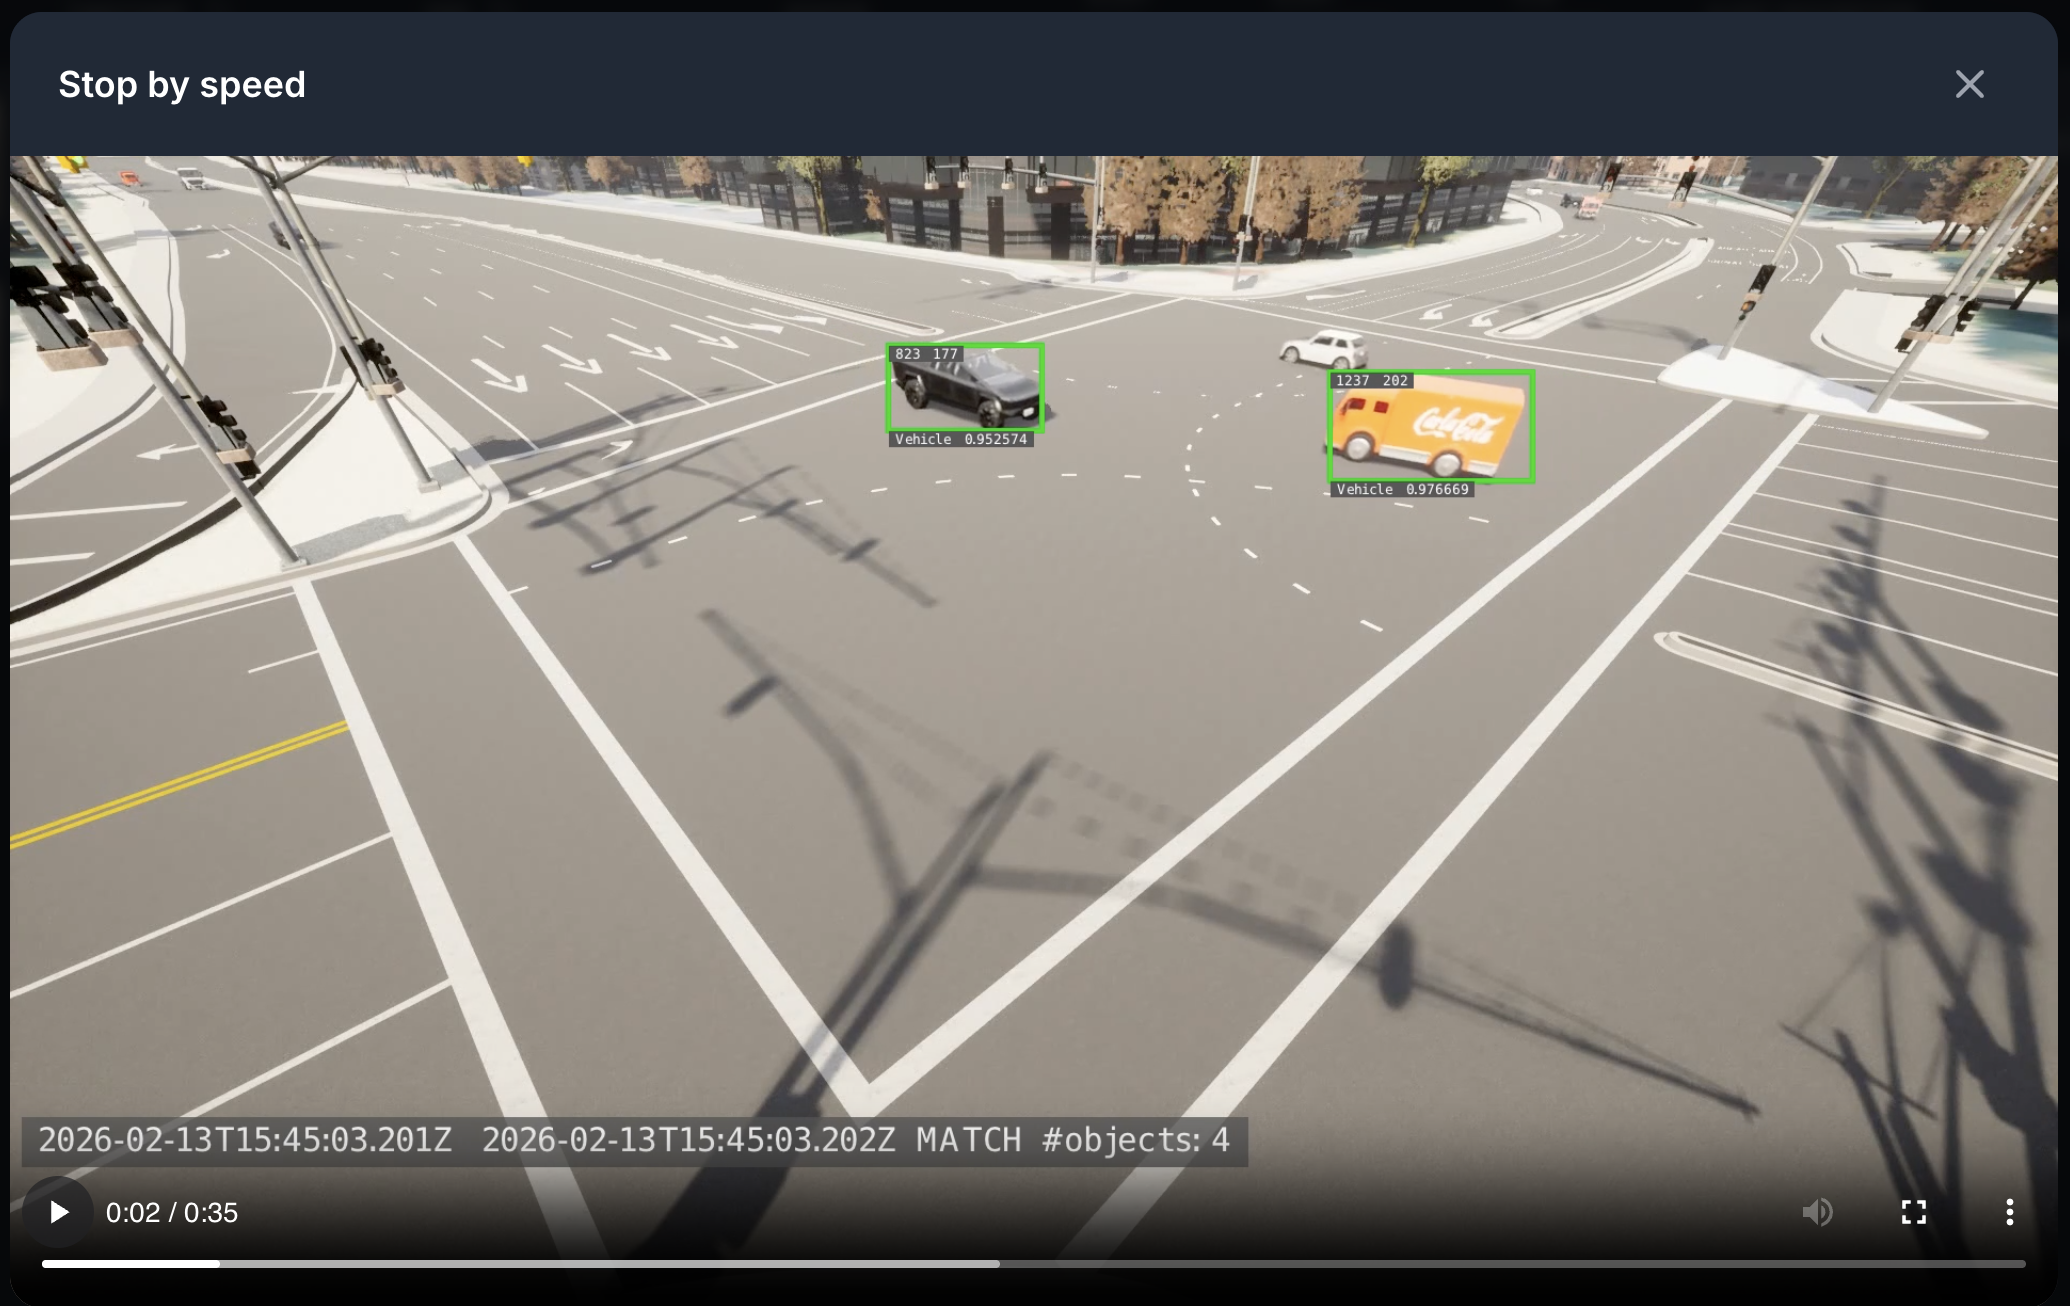
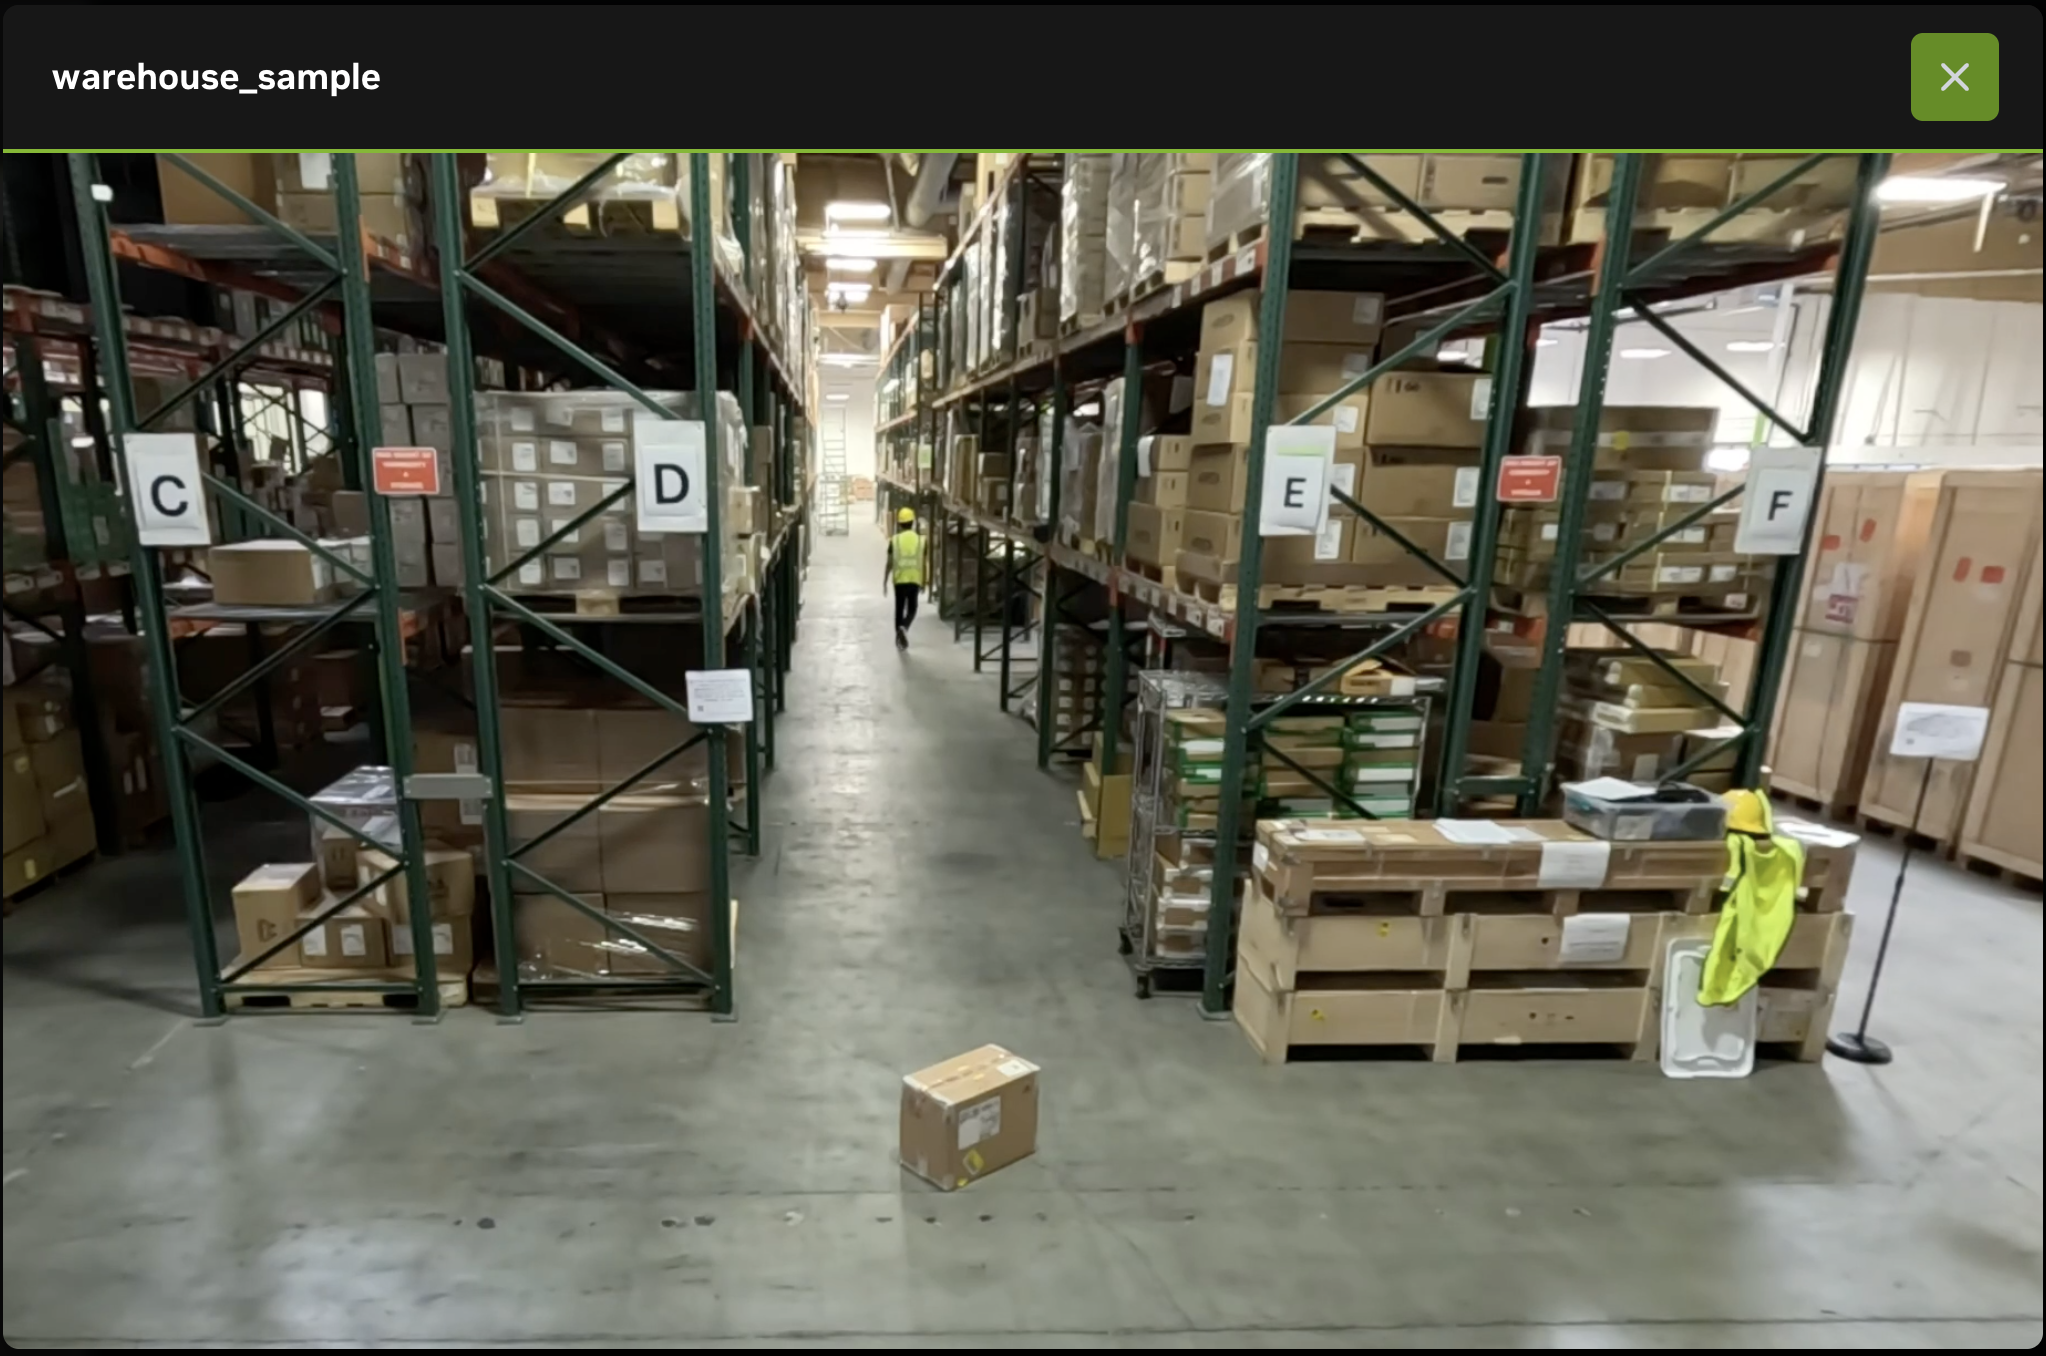
Click the thumbnail or play button to open a video modal with Play/Pause, seek bar, volume control, and fullscreen support.
Requires: Sensor mapping, VST service, and network connectivity.
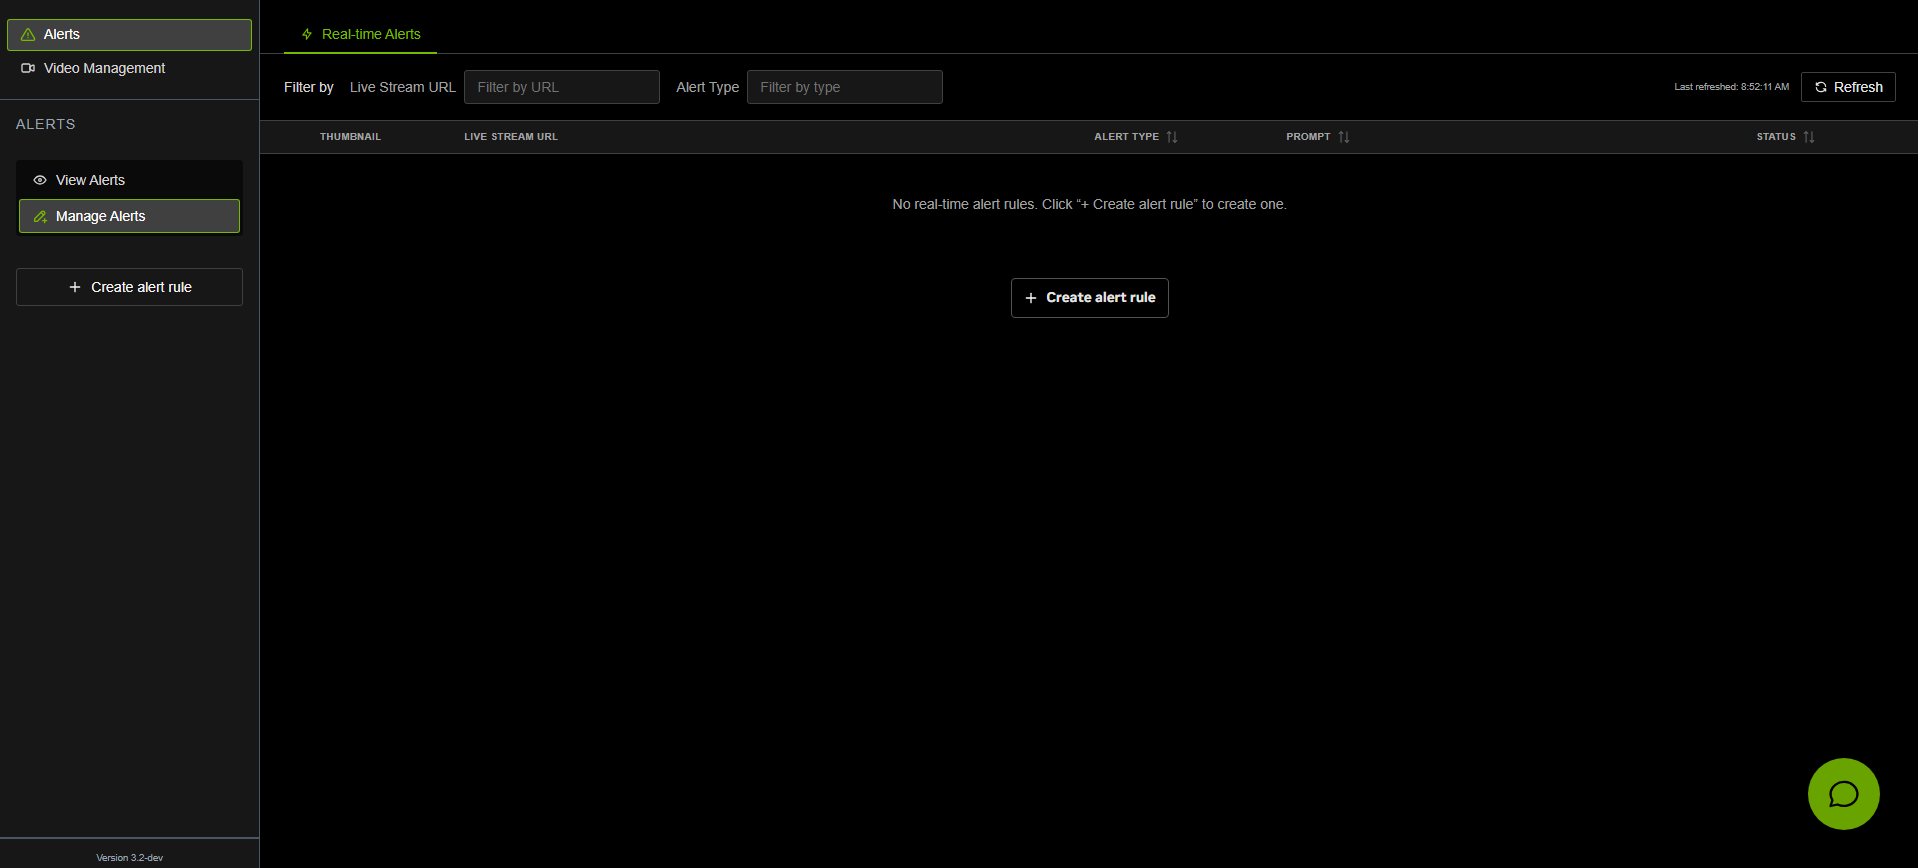
Manage Alerts#
The Manage Alerts view provides an interface for creating and managing real-time alert rules. These rules configure the alert bridge service to detect specific events on live video streams.
Requirements: The Manage Alerts feature requires the Alerts API URL to be configured (NEXT_PUBLIC_ALERTS_API_URL). Without this, the view will display an error.
Alert Rule Kinds#
The Manage Alerts view has tabs for different rule types:
Real-time Alerts — Active and fully functional. Configure rules that process live video streams.
Alert Verification — Coming soon (currently disabled).
Filter and Refresh#

The filter bar provides text-based filtering for the rules table:
Live Stream URL — Filter rules by stream URL (substring, case-insensitive)
Alert Type — Filter rules by alert type (substring, case-insensitive)
Refresh — Click to reload the rules list from the API
Alert Rules Table#
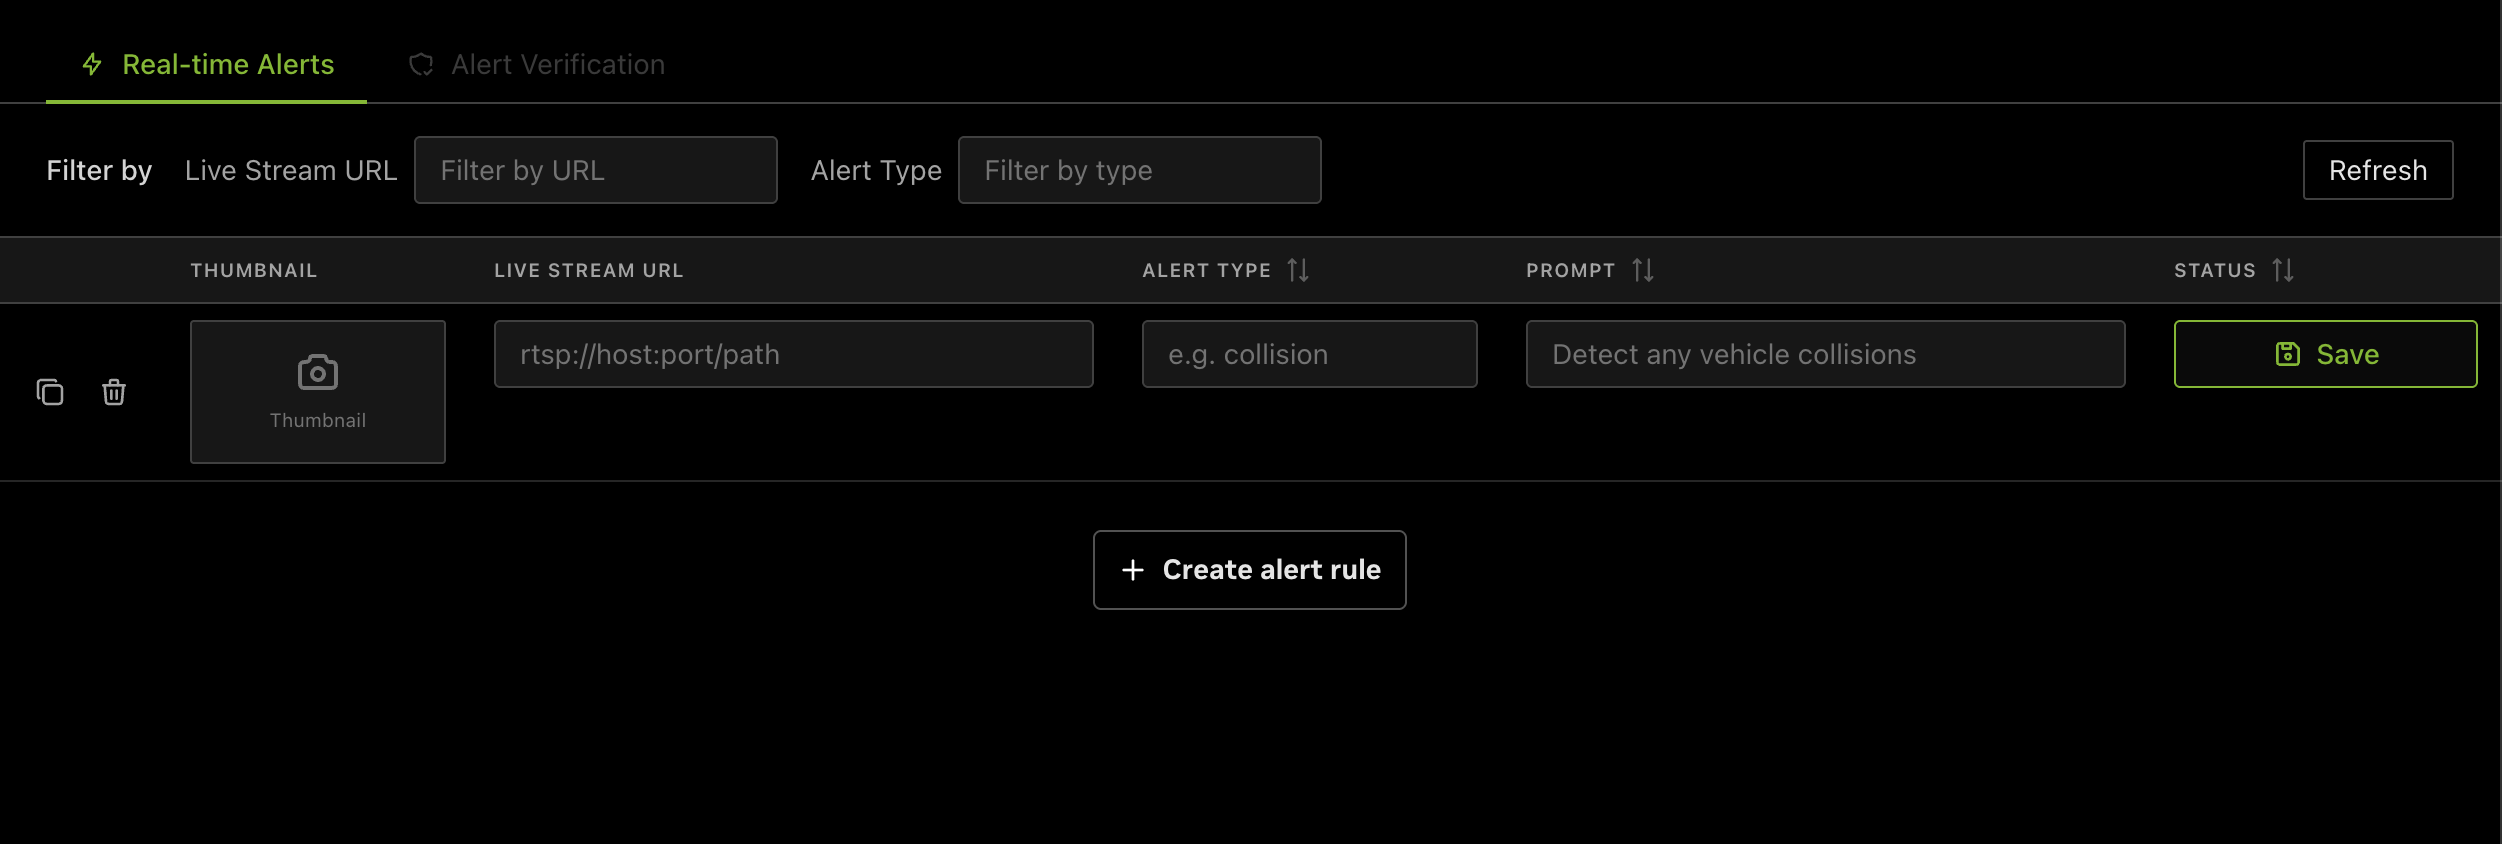
The table displays all configured real-time alert rules with the following columns:
Column |
Description |
Actions |
Duplicate (copy as new draft) and Delete (two-step confirmation: trash icon → confirm/cancel) for saved rules. For draft rows: Duplicate and Discard. |
Thumbnail |
Live stream preview image from the configured sensor. Automatically resolves the sensor from the stream URL. |
Live Stream URL |
For saved rules: read-only RTSP stream URL resolved at creation time. For draft rows: a sensor picker (combobox) sourced from VIOS’s live-stream catalog — the selected sensor’s RTSP URL is shown below the picker for verification. |
Alert Type |
Classification type for the alert rule. Editable for draft rows, read-only for saved rules. |
Prompt |
Detection prompt describing what the rule should look for. Editable for draft rows, read-only for saved rules. |
Status |
Rule status badge (e.g., “active”) with creation timestamp for saved rules. |
Sorting: Saved rules can be sorted by Alert Type, Prompt, or Status columns using the three-state sort cycle (ascending → descending → reset).
Creating Alert Rules#
There are two ways to create a new alert rule:
Sidebar button — Click “Create alert rule” in the left sidebar (visible when Manage Alerts tab is active)
Inline button — Click “Create alert rule” at the bottom of the rules table
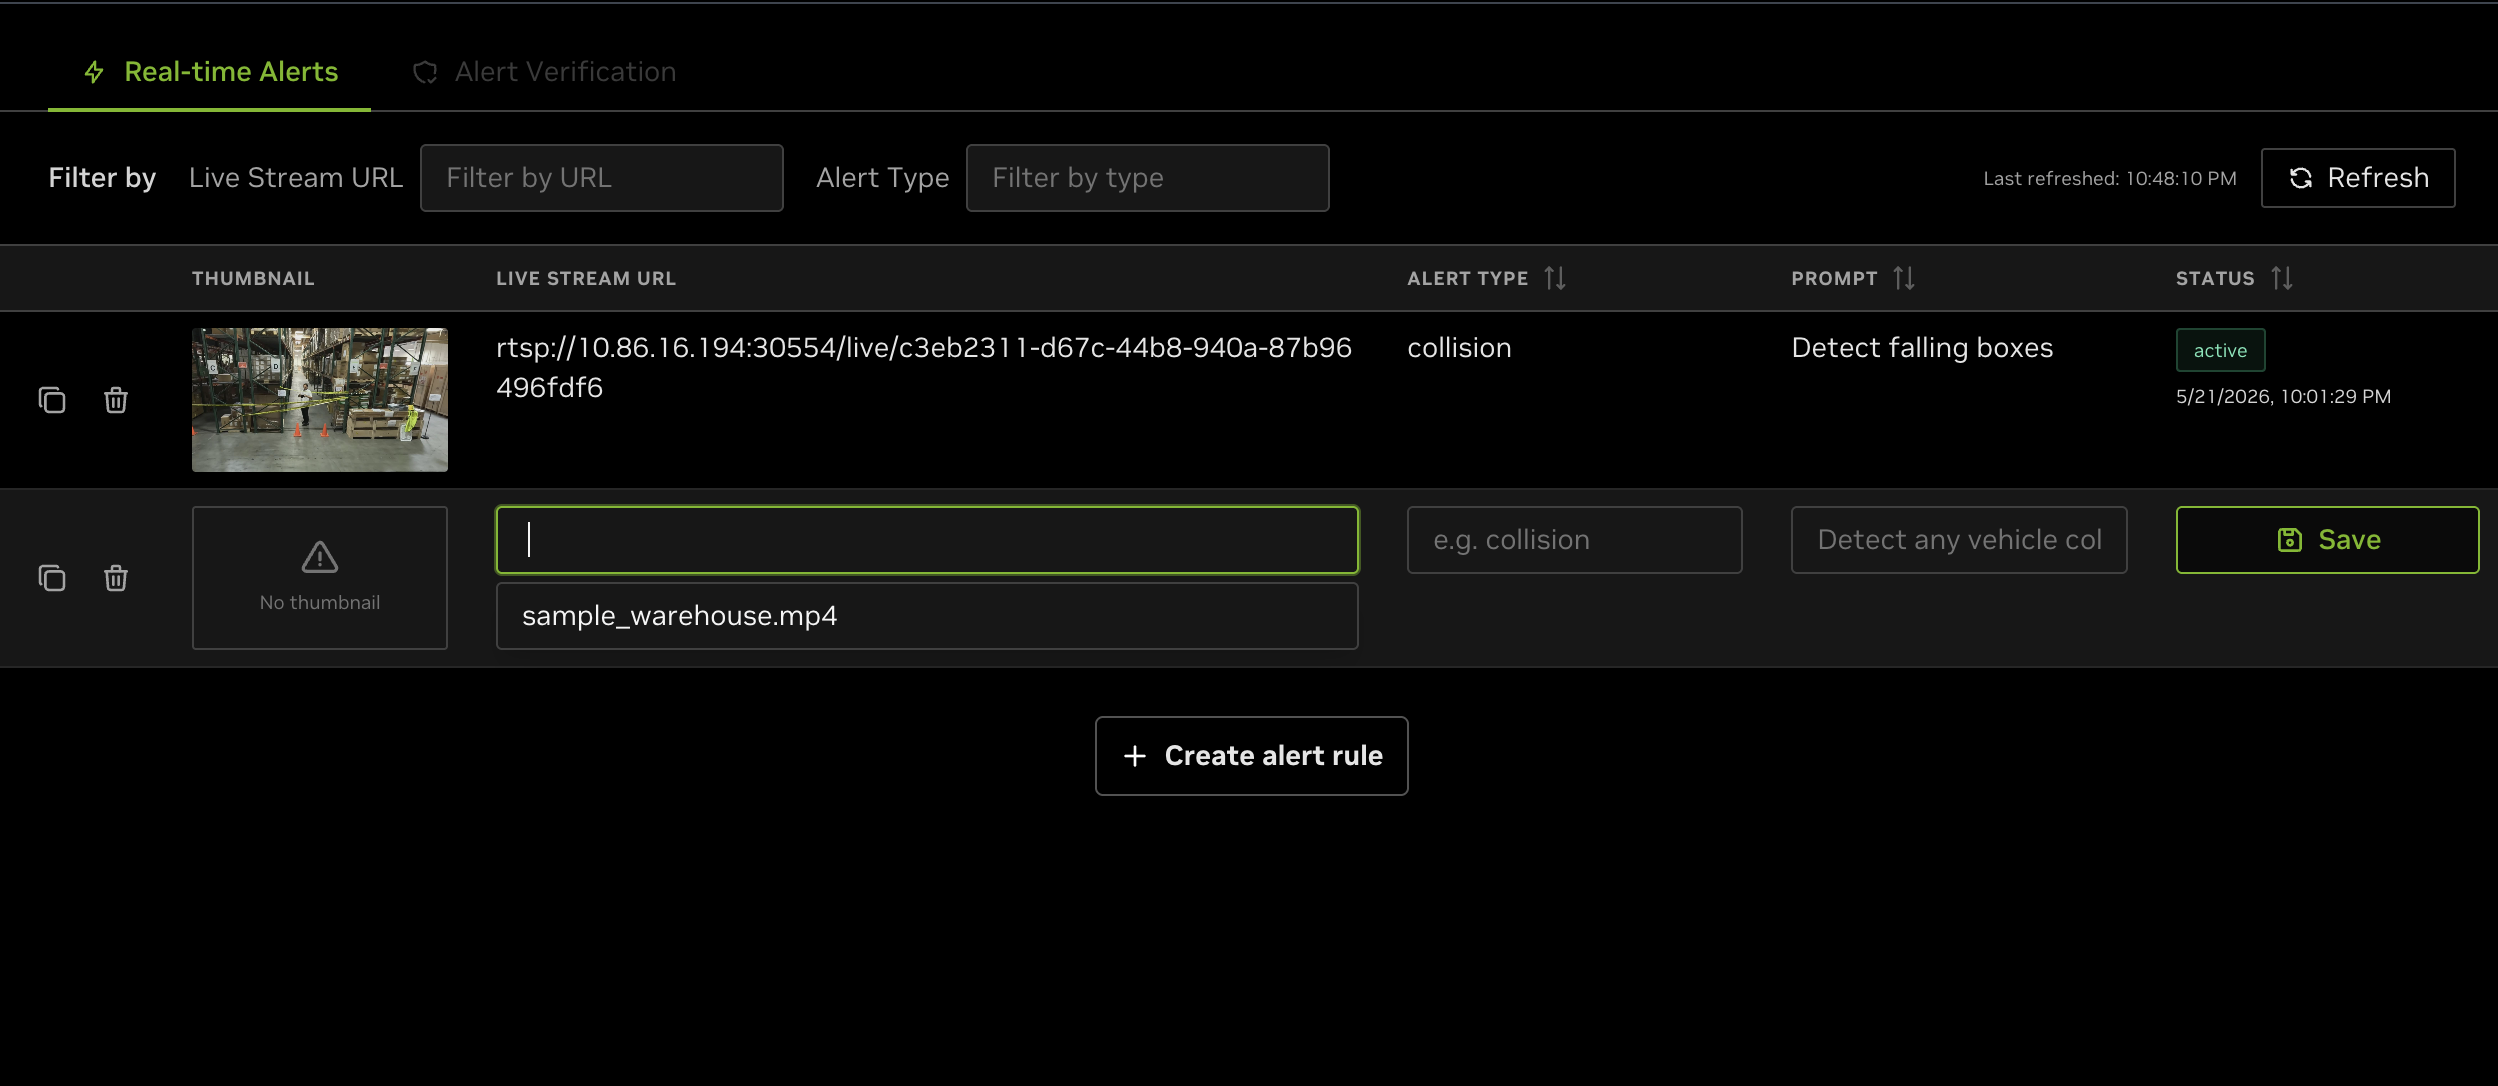
Both actions add a new draft row at the bottom of the table with editable fields:
Live Stream URL (required) — A sensor picker (combobox) populated from VIOS’s live-stream catalog. See Picking a sensor below.
Alert Type (required) — Specify the alert classification
Prompt (required) — Describe what the rule should detect
Click Save to submit the rule to the alert bridge API. The UI looks up the selected sensor name in the catalog, attaches the resolved RTSP URL, and posts the rule.
Picking a sensor
When you click “+ Create alert rule” (or duplicate an existing row), the UI immediately calls GET /v1/live/streams on VIOS to fetch the current catalog of registered live streams. Each catalog entry carries the friendly sensor name, its RTSP URL, and the VIOS stream id. The catalog is not cached — every “+ Create alert rule” click fetches it fresh, so sensors registered in VIOS (for example, after uploading a new video through NVStreamer or the VIOS UI) appear in the dropdown right away.
In the draft row’s Live Stream URL column:
Click the input to open a dropdown listing every sensor returned by VIOS.
Type to filter — the list narrows to entries whose name contains what you’ve typed (case-insensitive).
Click a suggestion, or use ↑/↓ and Enter to pick one. Escape closes the dropdown.
After selection, the chosen sensor’s RTSP URL is shown as a hint below the input so you can verify you picked the right one.
The dropdown shows friendly names (for example, warehouse-cam-1 or sample_warehouse.mp4), not URLs. You never need to copy/paste an RTSP URL — the UI resolves it from VIOS and sends it with the rule.
Custom sensor names
You can also type a sensor name that is not yet in the VIOS catalog (for example, a stream you plan to register later). The UI shows a “Not in VIOS catalog — will be created against this sensor name” hint below the input and forwards only the sensor name to the alert bridge; the alert bridge decides whether to accept the rule.
Empty state: When no rules exist, the table displays instructions to use the “Create alert rule” button to get started.
Deleting Alert Rules#
To delete a saved rule:
Click the trash icon in the Actions column
The icon changes to a confirm/cancel pair
Click the checkmark to confirm deletion, or the X to cancel
Draft rows that have not been saved can be removed by clicking the Discard button.
2. Dashboard Tab#
This tab shows the Kibana dashboard for the blueprint that it is deployed on.
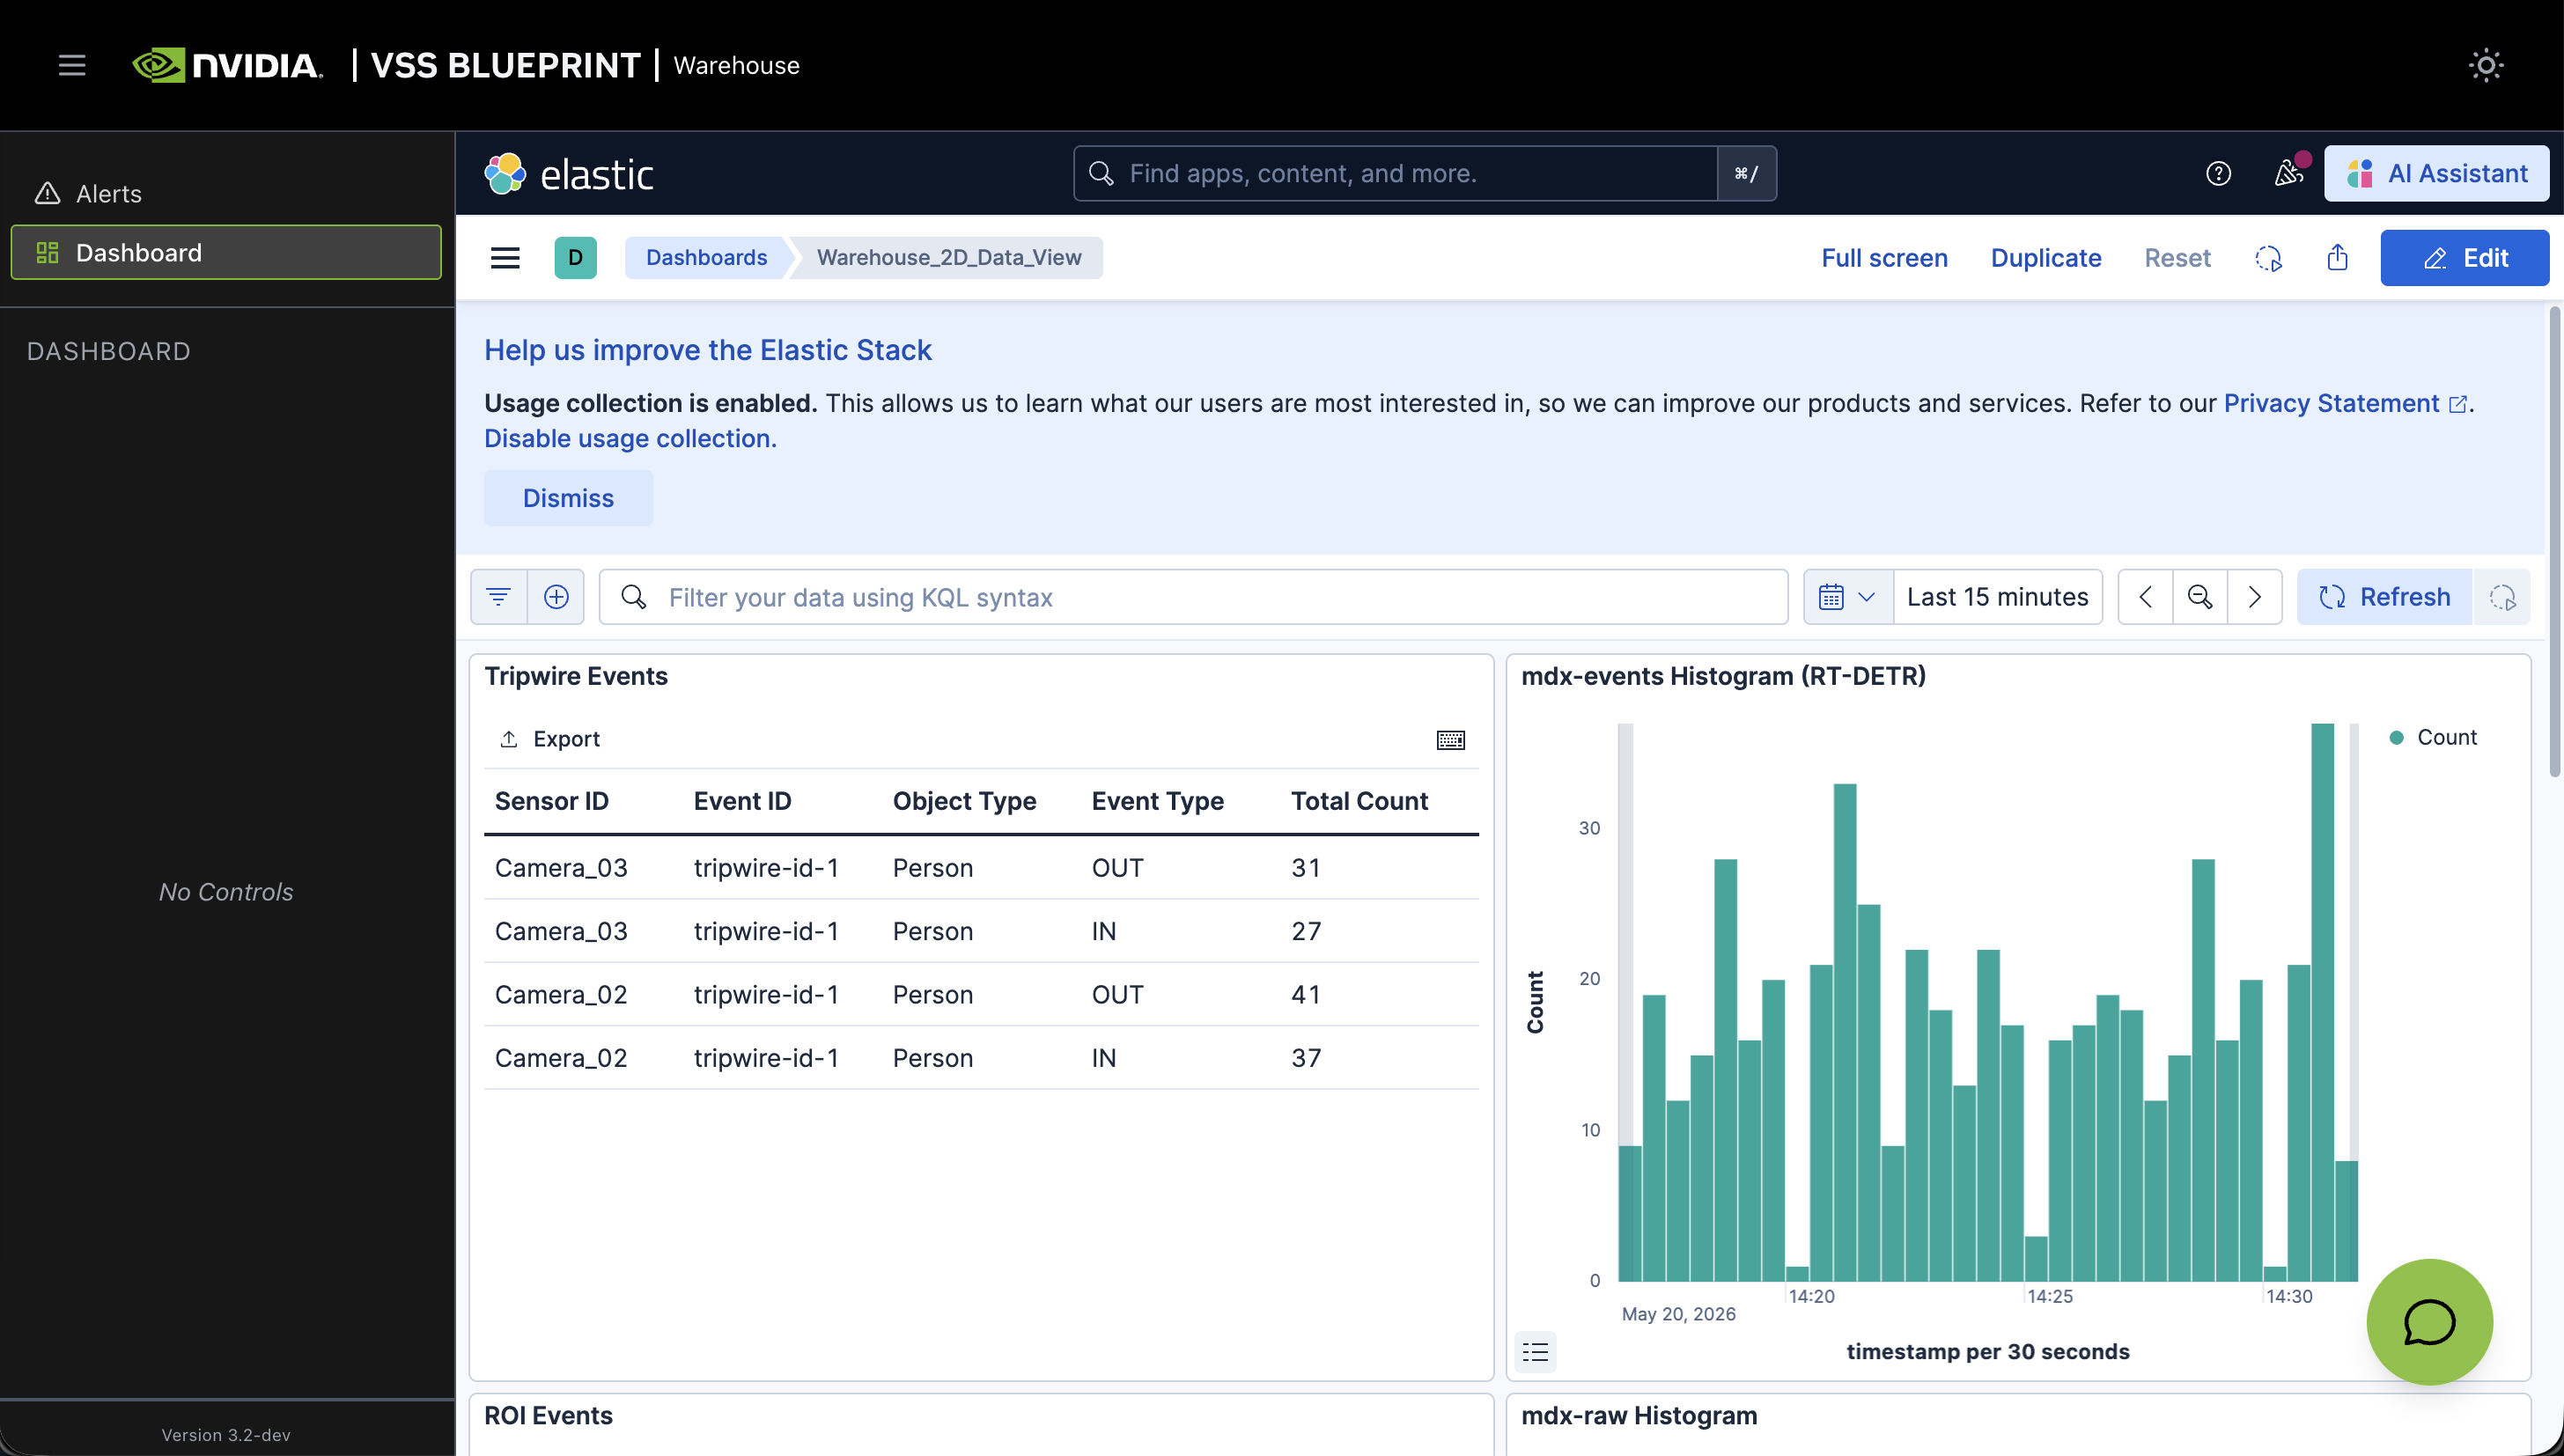
Note
Blueprint deployments typically include a pre-configured Kibana dashboard (as shown above).
Refer to the Kibana documentation for usage details.
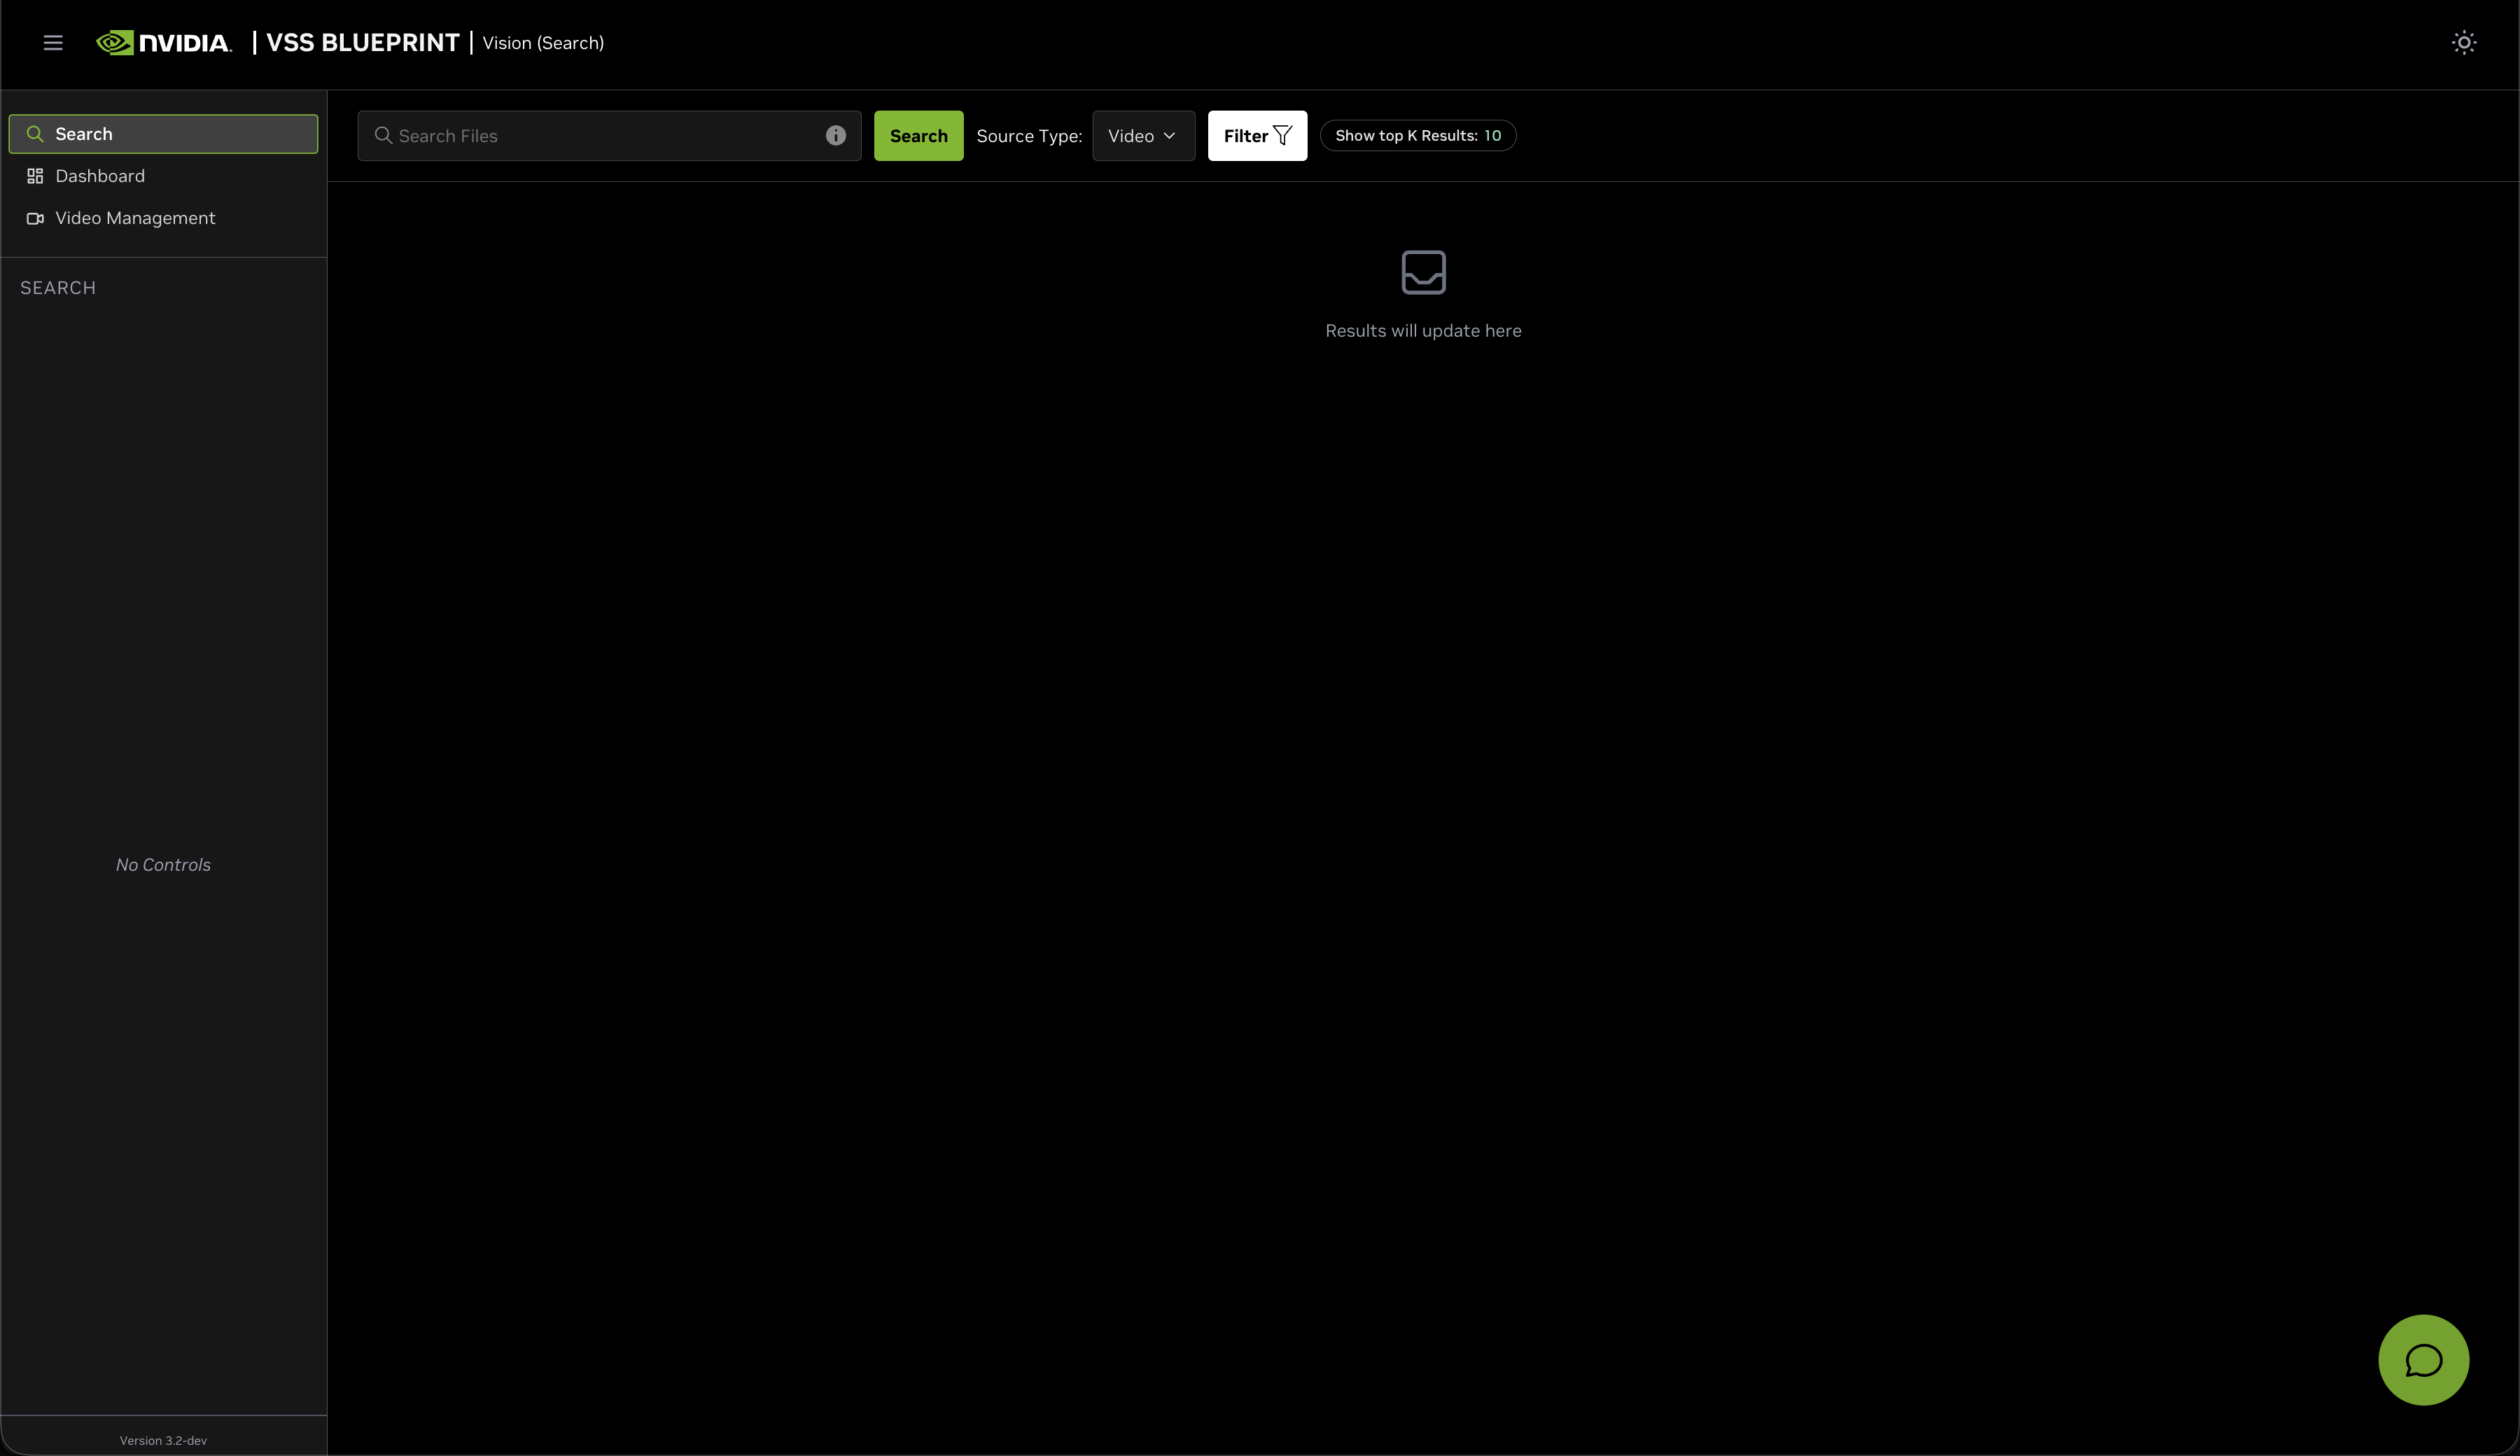
3. Search Tab#
Search Tab provides a semantic video search interface that allows users to find relevant video clips using natural language queries or metadata filters powered by AI-based similarity matching.
Key Features:
Natural language video search
Manual filtering mode with advanced filter options
Configurable result count (Top K) for performance optimization
Advanced filtering: datetime range, sensors, description, similarity threshold
Local timezone handling for accurate time display
Auto-refresh when switching between tabs
Interactive filter tags with quick remove functionality
Video results displayed as responsive grid cards with thumbnails
Integrated video playback modal with full controls
Collapsible Chat Sidebar for direct agent interaction within the Search Tab
Search by Image — select detected objects from paused video frames and find similar objects across cameras
Main Sections:
This guide covers the primary interface components:
Search Controls - Search input, source type, and filter button
Filter Options - Advanced filtering popover with date range, sensors, description, similarity threshold, and result count
Filter Tags - Visual display of active filters with quick remove functionality
Video Results - Responsive grid of video cards with thumbnails, time ranges, and metadata
Chat Sidebar - Collapsible agent chat panel with video upload and conversational search
Search by Image - Object-based visual search from paused video frames across all streams
Search Controls#
Search Input#

The search input field is required and supports natural language queries. Type your query in the search box and click the “Search” button to execute.
Examples:
“Find videos with people walking”
“Show me clips with a person in green jacket carrying boxes”
“Search for vehicle activity near entrance”
Input Behavior:
The search field displays an error highlight (red border) if you attempt to search with an empty query
The error clears automatically when you start typing
Search is triggered only by clicking the “Search” button or pressing Enter
Clicking the Close icon (X) to clear the search input and resets the search
Source Type#
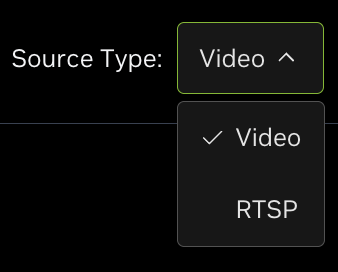
Select the source type to search from. The default is Video File.
Video File - Search from uploaded video files
RTSP - Search from live RTSP camera streams
Filter Options#
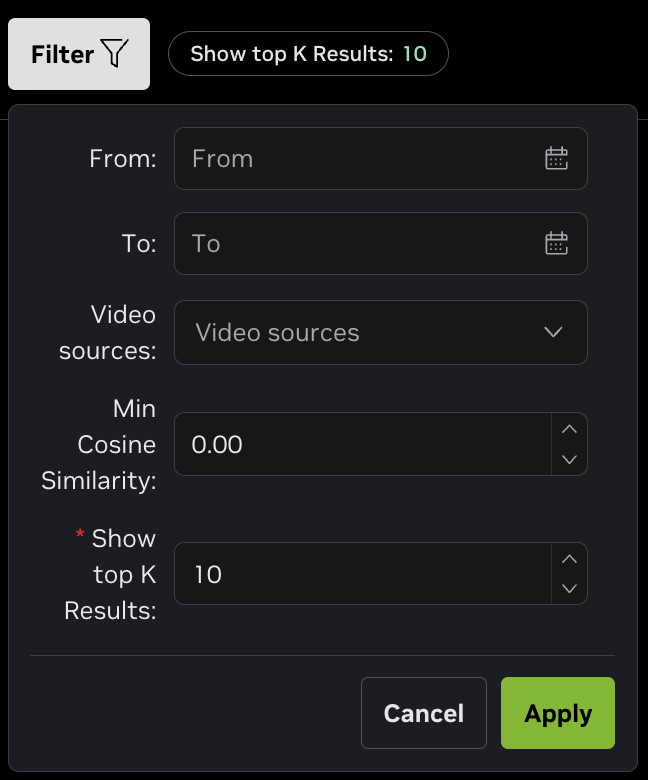
Click the “Filter” button to open the filter popover with advanced filtering options. The popover automatically closes when you click outside of it or click the “Apply” button to apply your filters.
Note
Filter options are only available when the Chat Sidebar is collapsed. When the Chat Sidebar is open, the Filter button and existing filter tags are disabled.
The filter popover provides the following options:
Datetime Range#
Select start and end dates to filter videos within a specific time period.
From: Starting date and time
To: Ending date and time
Format:
MMM dd yyyy hh:mm:ss aa(12-hour format with AM/PM)Times are interpreted as local timezone and sent to the API without timezone conversion
Tip: Leave both fields empty to search across all available time periods.
Video Names#
Multi-select dropdown to filter video names.
Select one or multiple video names from the list
Video names are fetched from the VST API
Min Cosine Similarity#
Set a minimum similarity threshold to filter results by relevance score.
Range: -1.00 to 1.00
Higher values (e.g., 0.80) return more relevant matches
Lower values (e.g., 0.20) return broader results
Value is automatically rounded to 2 decimal places
Default: No minimum threshold (returns all results)
Show top K Results#
Specify the maximum number of search results to display.
Required field - Must have a value
Minimum: 1 result
Default: 10 results
Enter any positive integer based on your needs
If the field is left empty when closing the popover, it automatically resets to the default value of 10
A filter tag is displayed only when the value differs from the default (10)
Filter Tags#
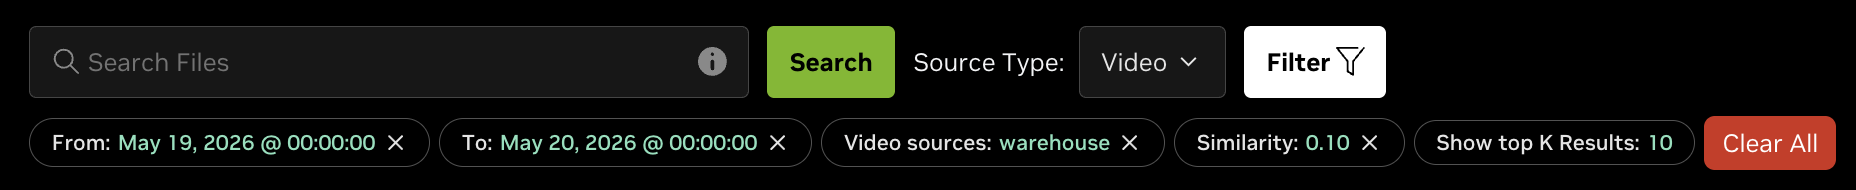
Active filters are displayed as tags below the search controls:
Click ✕ on any tag to remove that filter and reset to default (except for “Show top K Results” tag, which cannot be removed individually)
Click “Clear All” to remove all removable filters at once
Tags display: From date, To date, Video names (sensors), Min Cosine Similarity, Description, Show top K Results (only shown when value differs from default of 10)
Video Results#
Search results are displayed as a responsive grid of video cards.
Video Card#
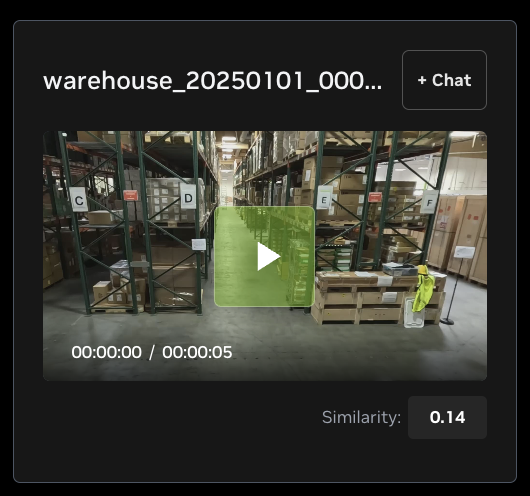
Each video card displays:
Element |
Description |
Video Name |
Filename of the video clip |
Thumbnail |
Preview image from the video (click to play) |
Play Button |
Click to open video in playback modal |
Time Range |
Start time / End time of the clip in |
Info Icon ⓘ |
Hover to see video description (if available) |
Similarity Score |
Cosine similarity value (-1.00 - 1.00) indicating relevance. Displayed when available from search results |
+ Chat button |
Adds this video clip as sensor context to the Chat Sidebar input (see + Chat Button below) |
+ Chat Button#
Each video card includes a “+ Chat” button in the top-right corner, next to the video name. This button lets you attach a specific video clip as context to the Chat Sidebar, enabling follow-up questions about that clip.
How it works:
Click the “+ Chat” button on a video card.
The clip’s sensor context (video name, start time, end time) is added as a context chip in the Chat Sidebar input.
The button briefly changes to “✓ Added” for 2 seconds to confirm, then reverts to “+ Chat”.
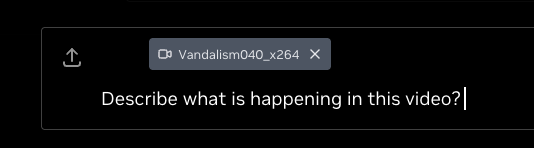
Type a follow-up question in the Chat Sidebar that references the attached clip (e.g., “Describe what is happening in this video” or “Are there any safety violations?”).
States:
State |
Description |
|
Default state. Click to add this video clip as context to the Chat Sidebar. |
|
Confirmation state (shown for 2 seconds after clicking). The clip context has been attached to the chat input. |
Disabled |
The button is grayed out when the Chat Sidebar is not available (e.g., chat sidebar feature is not enabled in the deployment). |
Note
The + Chat button adds the video clip as a context reference — it does not automatically send a message. After adding context, open the Chat Sidebar and type your question. Multiple clips can be added as context before sending a query.
Video Playback#
Click the play button or thumbnail to open the video playback modal with:
Play/Pause controls
Seek bar
Volume control
Fullscreen option
Search by Image button (appears when video is paused, if enabled)
Requires: VST service connectivity and proper sensor configuration.
Chat Sidebar#
The Search Tab includes the Global Chat Sidebar on the right side, providing direct access to the Vision Agent without leaving the search interface. Refer to the Global Chat Sidebar section for full feature details (video upload, chat controls, settings, etc.).
Toggle:
Click the vertical “Chat” tab on the right edge to open or close the sidebar
The sidebar is resizable by dragging its left edge (between 1/3 and 2/3 of the content area width)
Default width: 380px
Interaction Modes:
When the Chat Sidebar is open, the behavior is similar to when it is collapsed while an agent query is executing: the search controls (search input, source type, filters, and filter tags) are disabled in both cases. In the open state, users interact with the agent through the Chat Sidebar, and the agent’s responses can automatically populate the search results grid. This allows conversational search — ask the agent a question and see matching video results appear in the main search area.
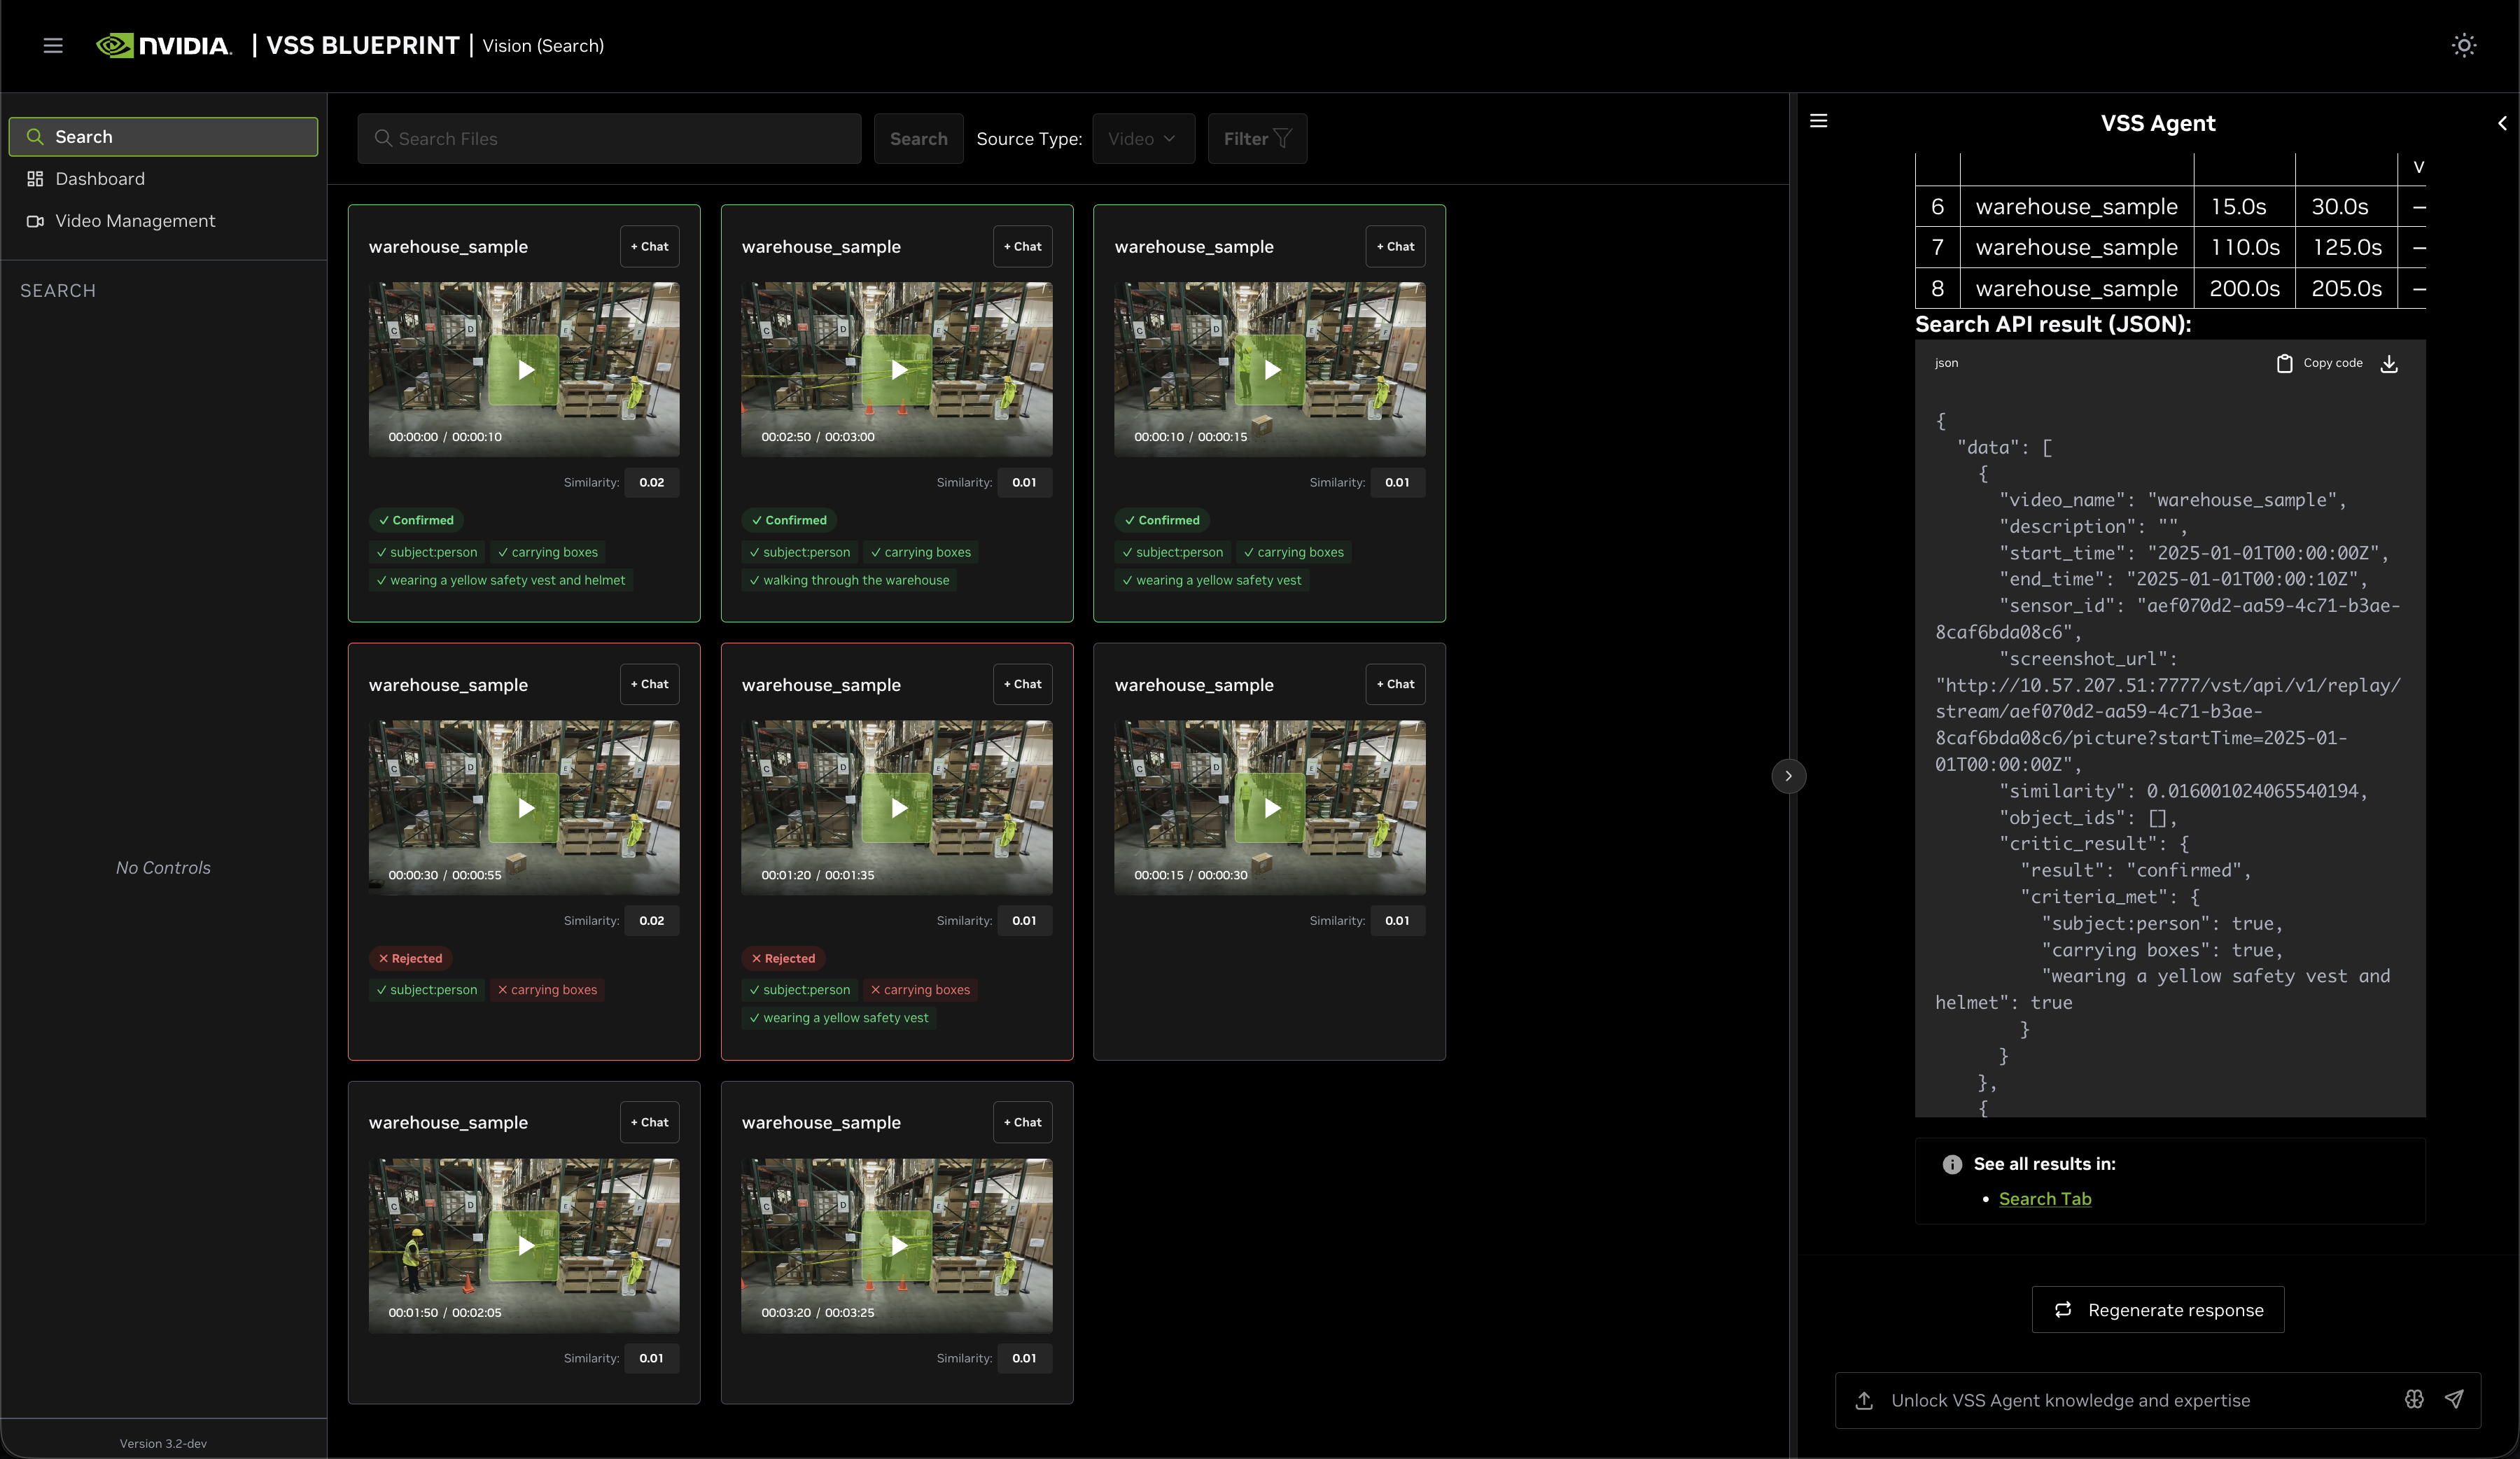
Example
Type a natural-language query in the Chat Sidebar and the agent will run a search and fill the results grid. For example, ask “person with yellow hat carrying boxes”; the agent interprets the query, runs the search, and matching video clips appear in the main area. The screenshot below illustrates this flow: the query in the chat and the corresponding search results (e.g. thumbnails and clips) shown in the grid.
When the Chat Sidebar is collapsed, the search controls are re-enabled and users can perform manual searches with filters as usual.
Unseen response indicator:
When a response to a query is unseen and the Chat Sidebar was closed, the vertical “Chat” tab on the right edge shows an orange border once the new response is generated to indicate unseen content. You can clear the indicator (mark as seen) in either of these ways:
Open the Chat Sidebar — viewing the content marks it as seen and removes the orange border.
Click the cancel button on the orange border — marks the new content as seen and removes the indicator without opening the sidebar.
Agentic Query Results#
When a query is submitted through the Chat Sidebar, the agent’s response can populate video results directly in the Search Tab’s main content area. The agent interprets the natural language query, executes a search, and matching video clips appear in the results grid alongside the chat response.
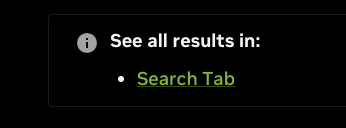
At the bottom of the agent’s response in the Chat Sidebar, a “See all results in: Search Tab” link is displayed. When the user is on a different tab (e.g., Alerts, Video Management), clicking this link navigates back to the Search Tab and displays the query results.
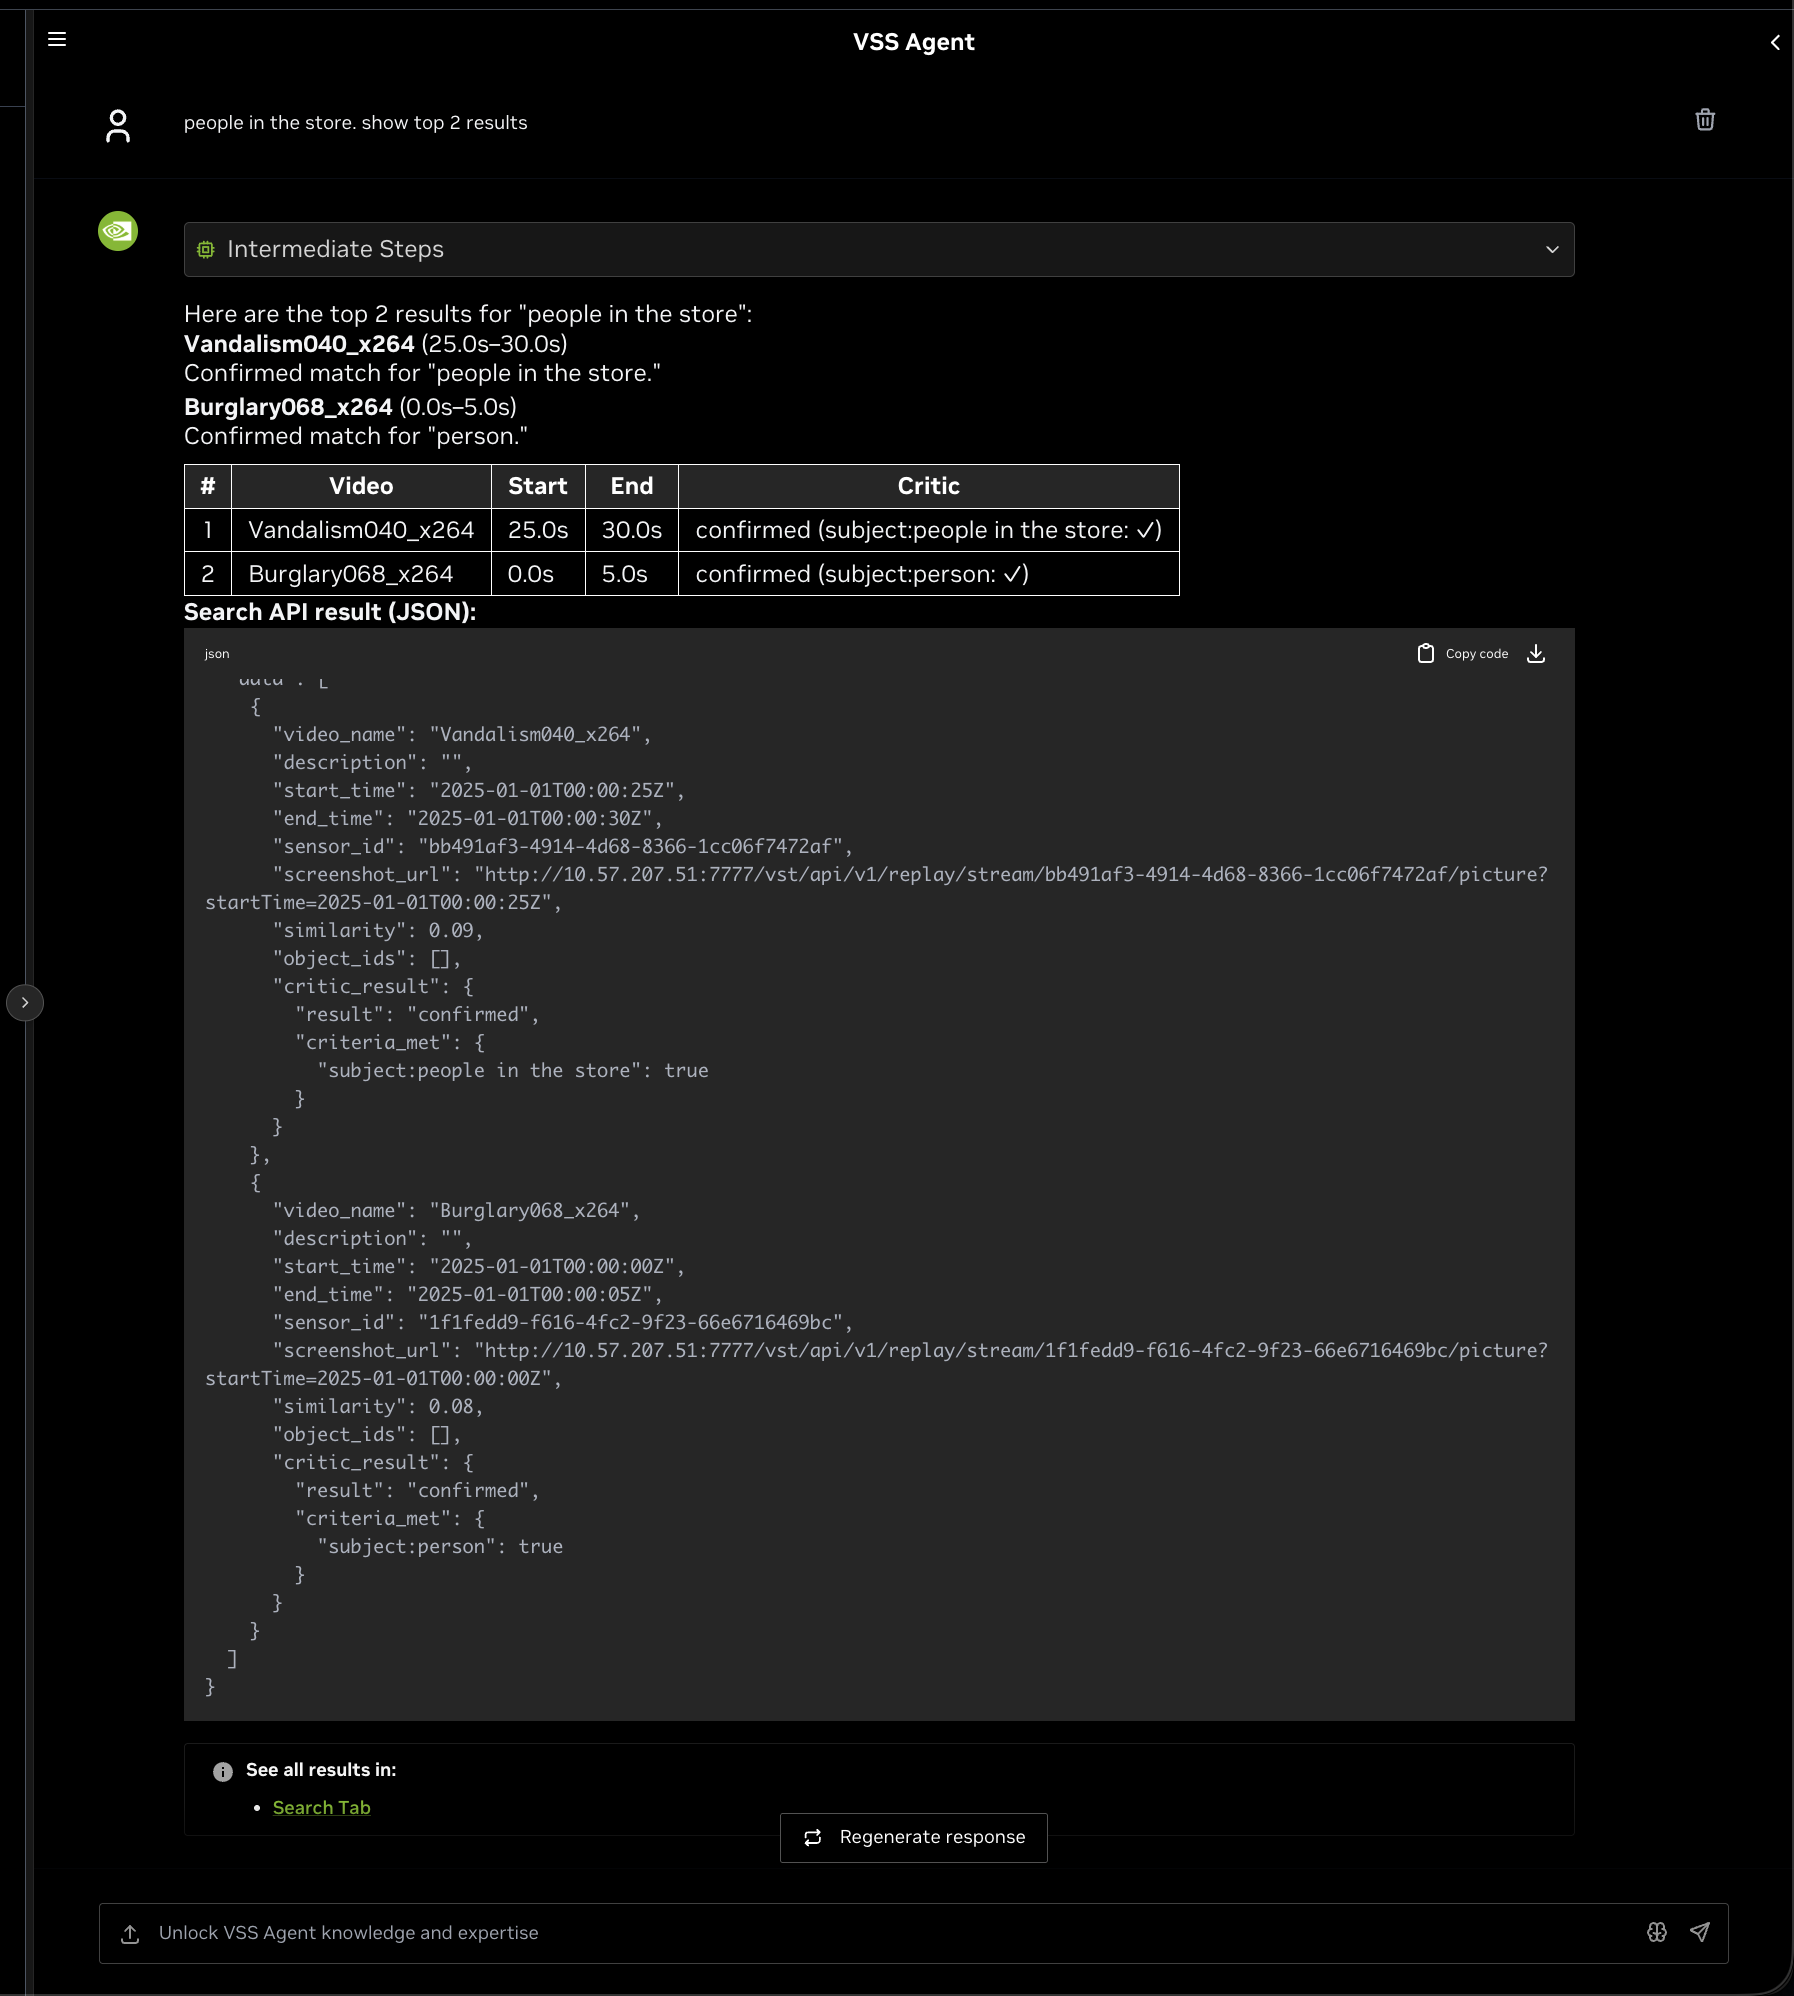
Critic Verification#
When the Critic Agent is enabled and has run for a search request, search result cards display verification details for each evaluated clip. The Critic Agent uses a VLM (Vision Language Model) to verify whether each search result actually matches the user’s query.
Users can toggle the critic agent on or off per query using the Enable Critic toggle in the Chat Sidebar settings.
When the critic agent has run, the search result cards show the verification outcome:
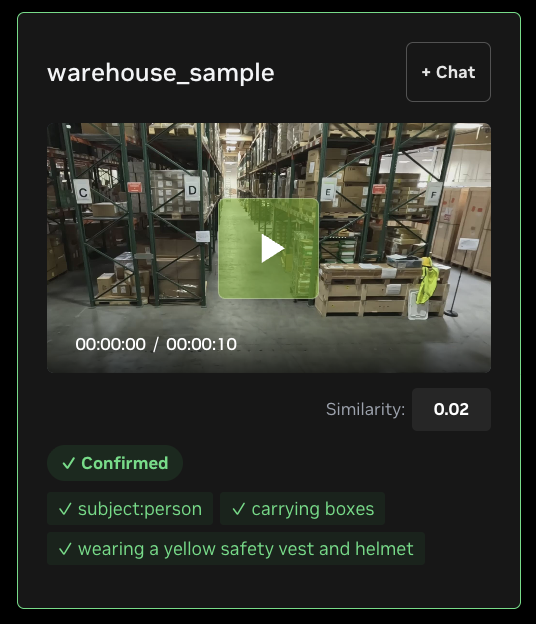
Result Card Indicators:
Each evaluated result card shows the critic verdict through visual cues:
Indicator |
Description |
Border color |
The card border is colored to reflect the verdict: green for confirmed, red for rejected, yellow for unverified. Cards from searches that did not use the critic agent retain the default gray border. |
Verdict badge |
A colored badge below the similarity score displays the verdict: ✓ Confirmed (green), ✗ Rejected (red), or ? Unverified (yellow). |
Criteria chips |
Below the verdict badge, each criterion extracted from the query is listed as a small chip with a green check (✓) when satisfied or a red cross (✗) when not satisfied (e.g., |
Sorting Behavior:
When critic results are present, search results are automatically re-sorted by verdict before similarity:
Confirmed results appear first
Unverified results appear second
Rejected results appear last
Within each verdict group, results are ordered by descending similarity score. When the critic agent did not run for the request, results retain their original similarity ordering.
Note
The Critic Agent is enabled by default. To disable it across the entire deployment, set ENABLE_CRITIC=false before deploying. See Critic Agent Overview for more details.
Search by Image#
Search by Image allows you to select a detected object from a paused video frame and perform an agentic search for visually similar objects across all cameras and video streams.
Note
Search by Image is only available when the mediaWithObjectsBbox option is enabled in the deployment configuration. This feature requires the MDX Web API (/frames endpoint) and VST Picture API to be deployed and accessible.
How to Use:
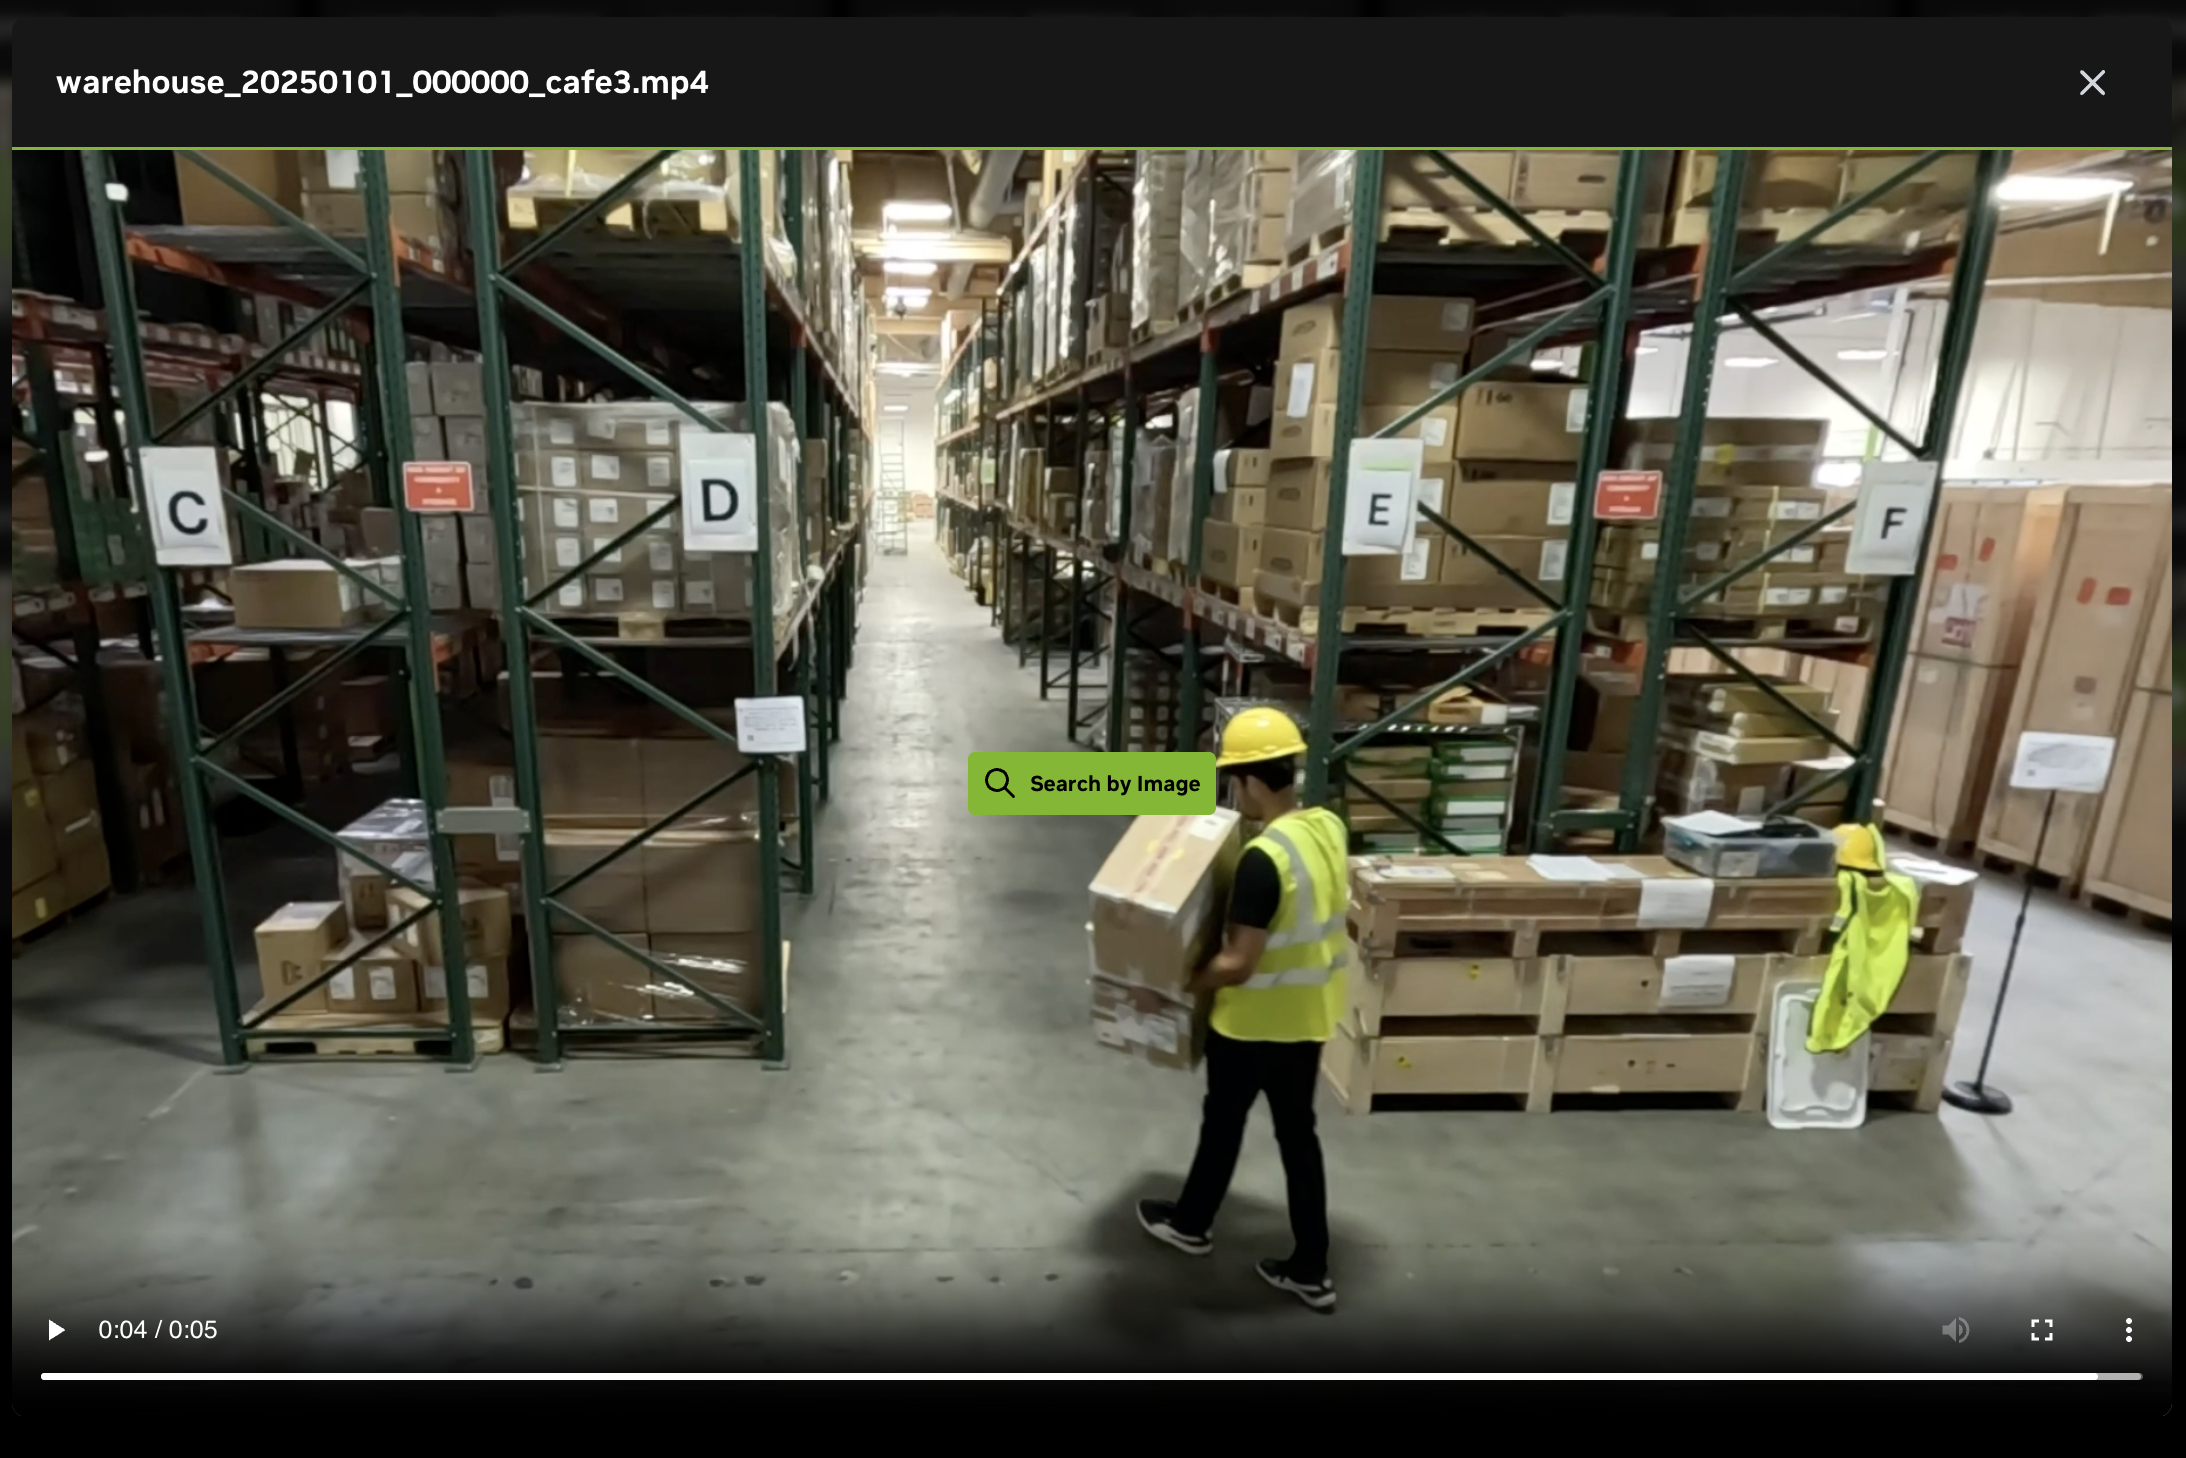
Play a video — Click on a video card from the search results to open the video playback modal.
Pause the video — Pause playback at the frame containing the object of interest. A “Search by Image” button appears in the center of the paused video.
Enter Search by Image Mode — Click the “Search by Image” button. The system fetches the still frame and any detected bounding boxes from the backend.
Select an object — Click on a bounding box to select the target object. The selected box is highlighted in green. An info bar below shows the selected object ID and type.
Execute the search — Click the “Search” button in the info bar to find similar objects across all streams. The agent will process the query and return matching results.
Cancel — Click “Cancel” in the info bar or close the modal to exit Search by Image mode.
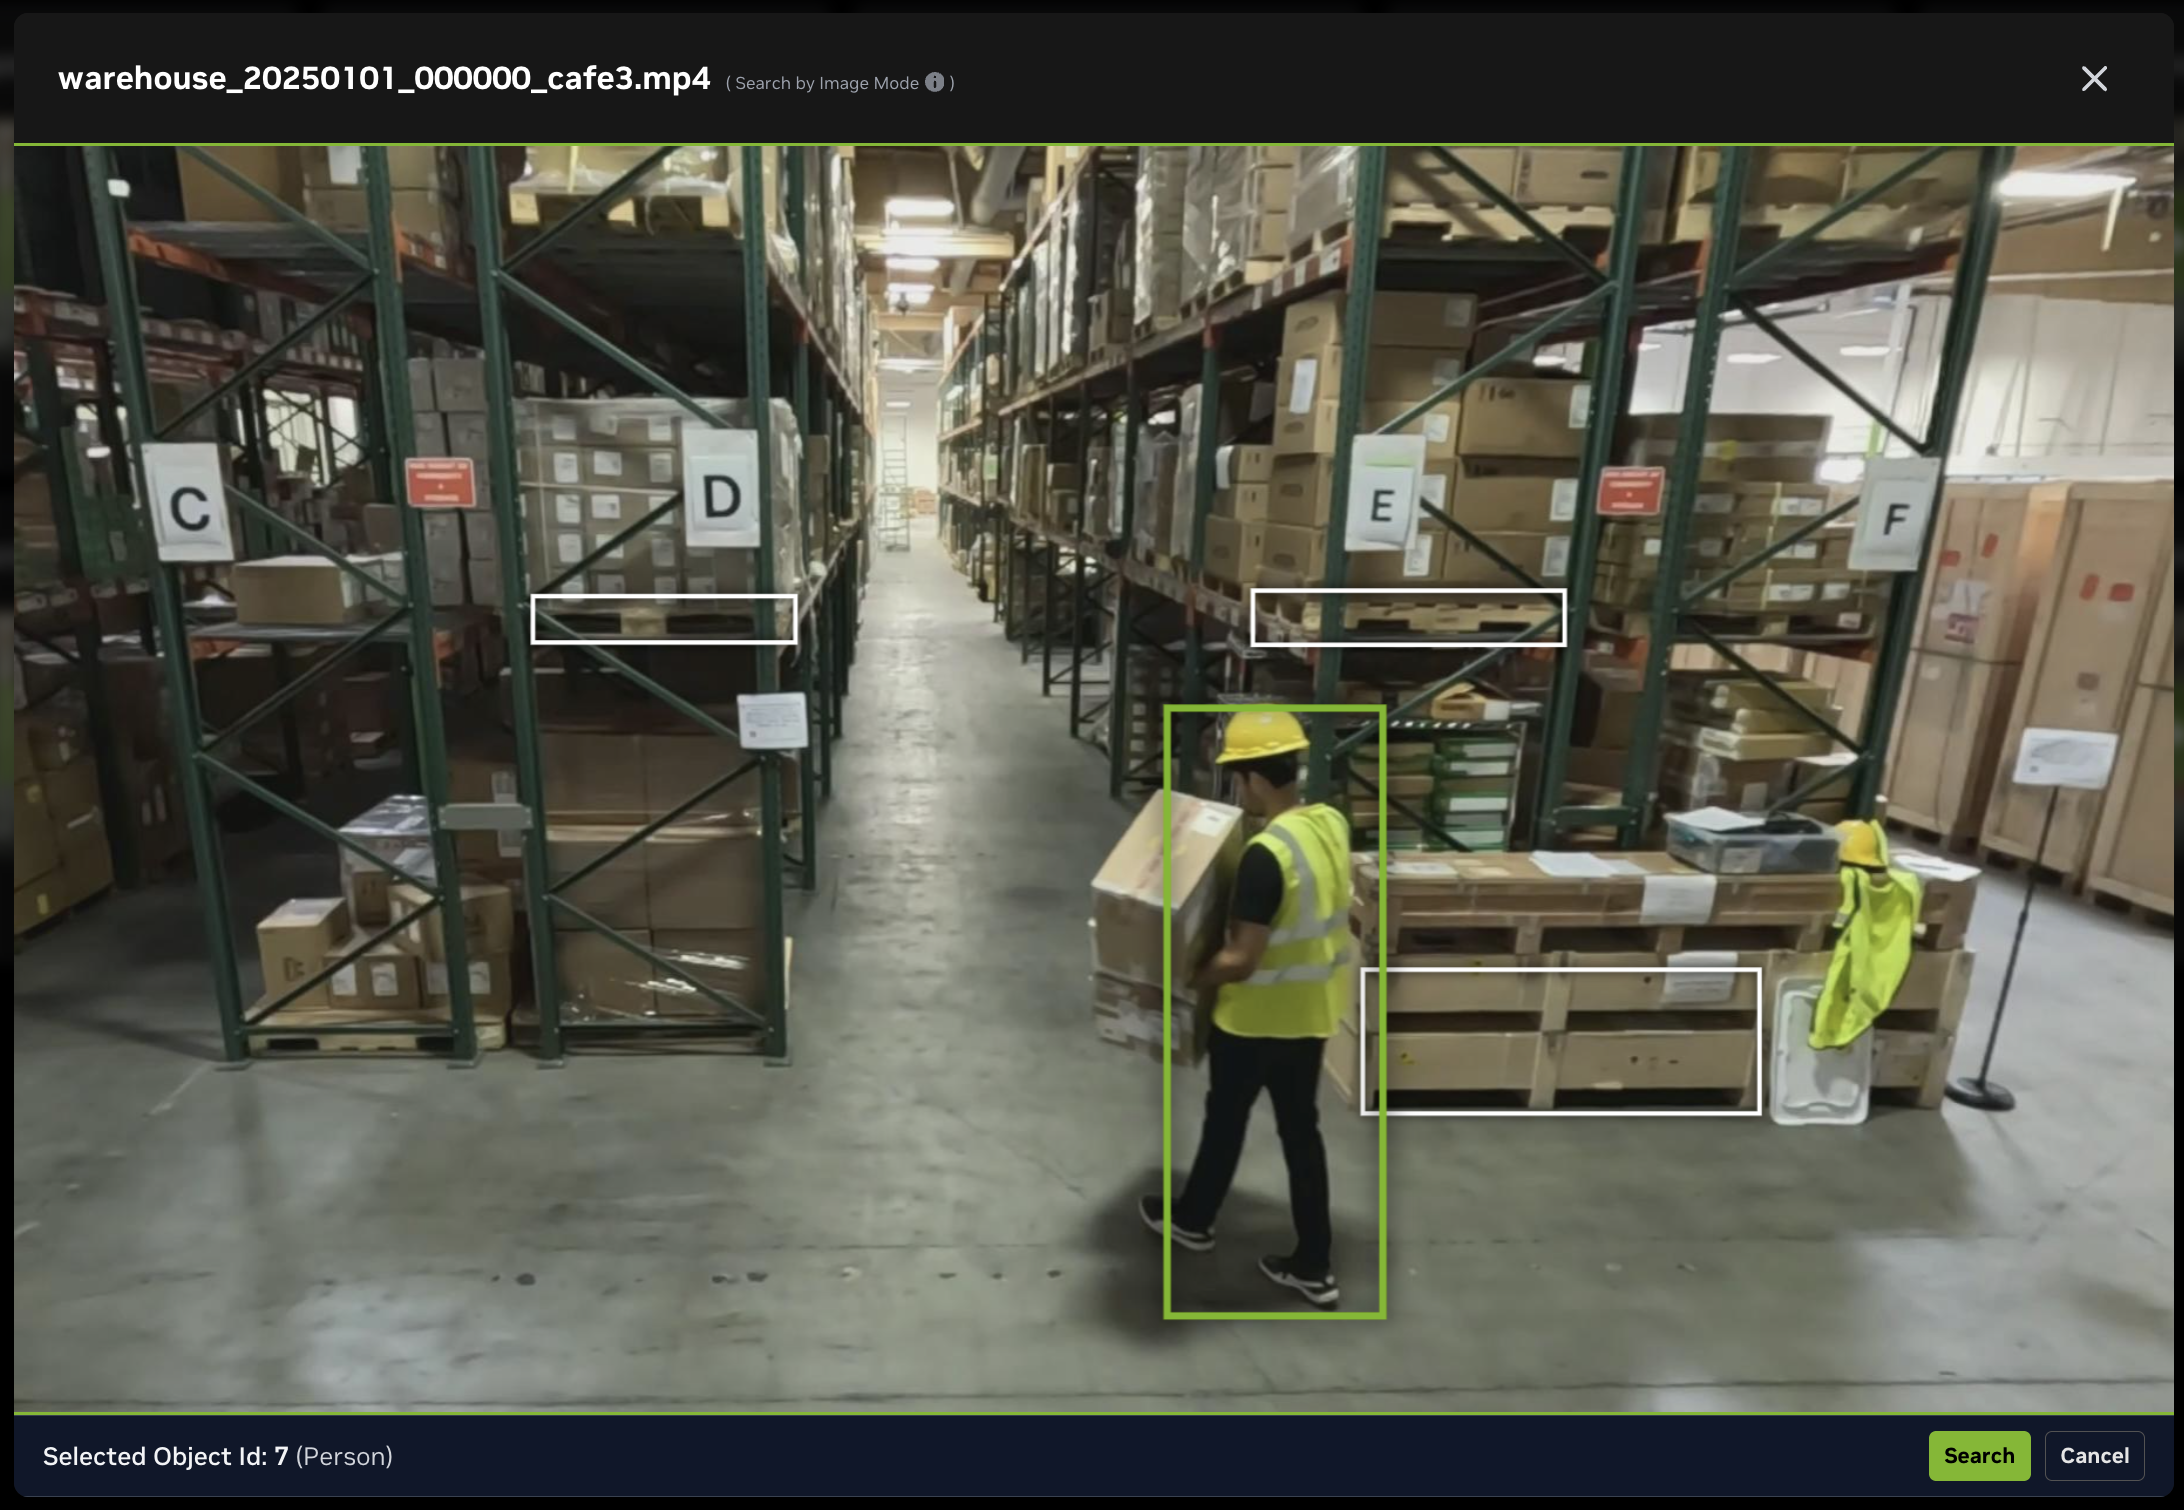
Search by Image Overlay:
When Search by Image mode is active, the video is replaced by a still frame with bounding boxes drawn around detected objects:
Element |
Description |
Frame Image |
The still frame captured at the paused timestamp, fetched from the VST |
Bounding Boxes (white) |
Detected objects in the frame. Hover to highlight; click to select |
Selected Box (green) |
The currently selected object for search. Click again to deselect |
Info Bar |
Displays the selected object ID, object type, and action buttons (Search / Cancel) |
Info Bar States:
No objects detected — Displays “No bounding boxes detected in this frame”
Objects available, none selected — Displays “Select one to search for similar object embeddings across views/cameras”
Object selected — Displays the object ID and type (e.g.,
Person,Pallet) with a “Search” button
Search Execution:
When you click “Search” after selecting an object, the system:
Sends a query to the Vision Agent:
Find similar objects matching object_id=<selected_id>Closes the video modal
Displays matching results in the search results grid, showing video clips where similar objects were detected across different cameras/streams
Tip
For best results, pause the video at a frame where the object of interest is clearly visible and the bounding box accurately covers the object.
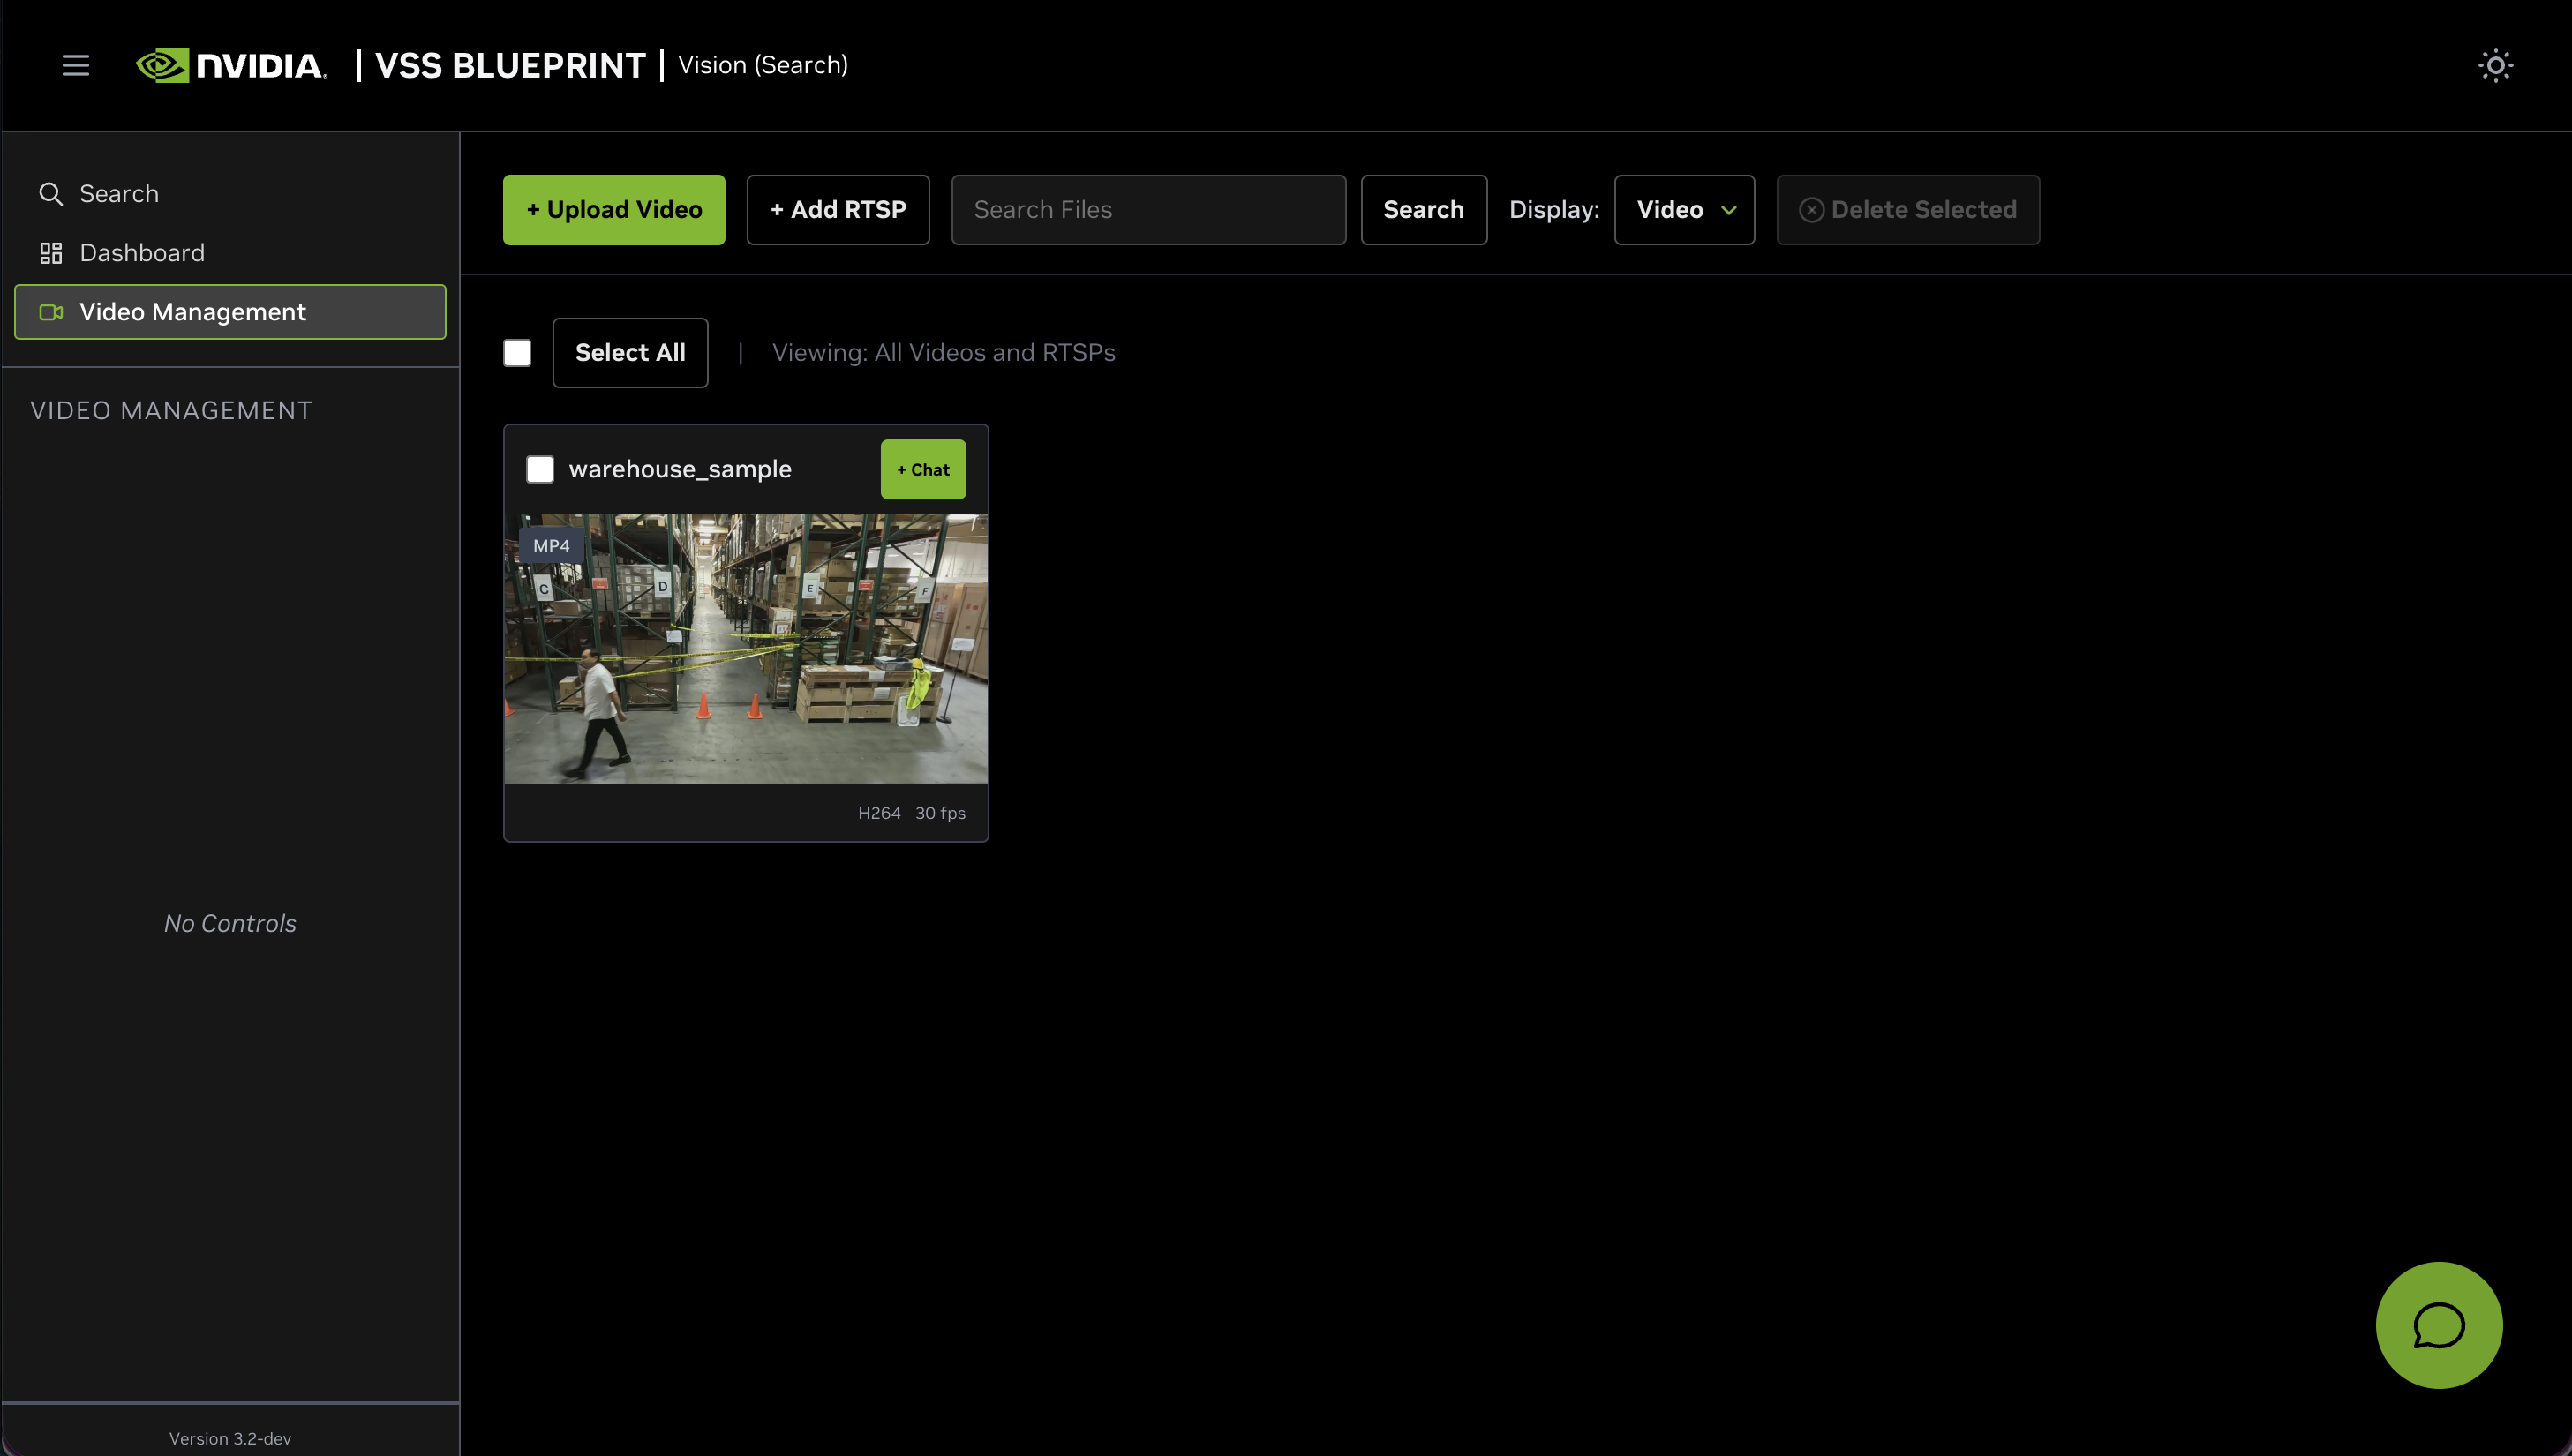
4. Video Management Tab#
Video Management Tab provides an interface for managing video streams, including uploaded video files and live RTSP camera feeds.
Key Features:
Upload video files (MP4, MKV formats)
Optional upload configuration fields (if configured via system settings)
Add live RTSP camera streams
Grid view of all streams with thumbnails
Search and filter streams by name and type
Bulk selection and deletion of streams
Real-time upload progress tracking
Stream metadata display (codec, framerate)
Main Sections:
This guide covers the primary interface components:
Toolbar - Search, filter, upload, and bulk operations
Streams Grid - Visual display of all video and RTSP streams
Video Upload - Upload files with optional configuration fields
RTSP Management - Add and manage live camera feeds
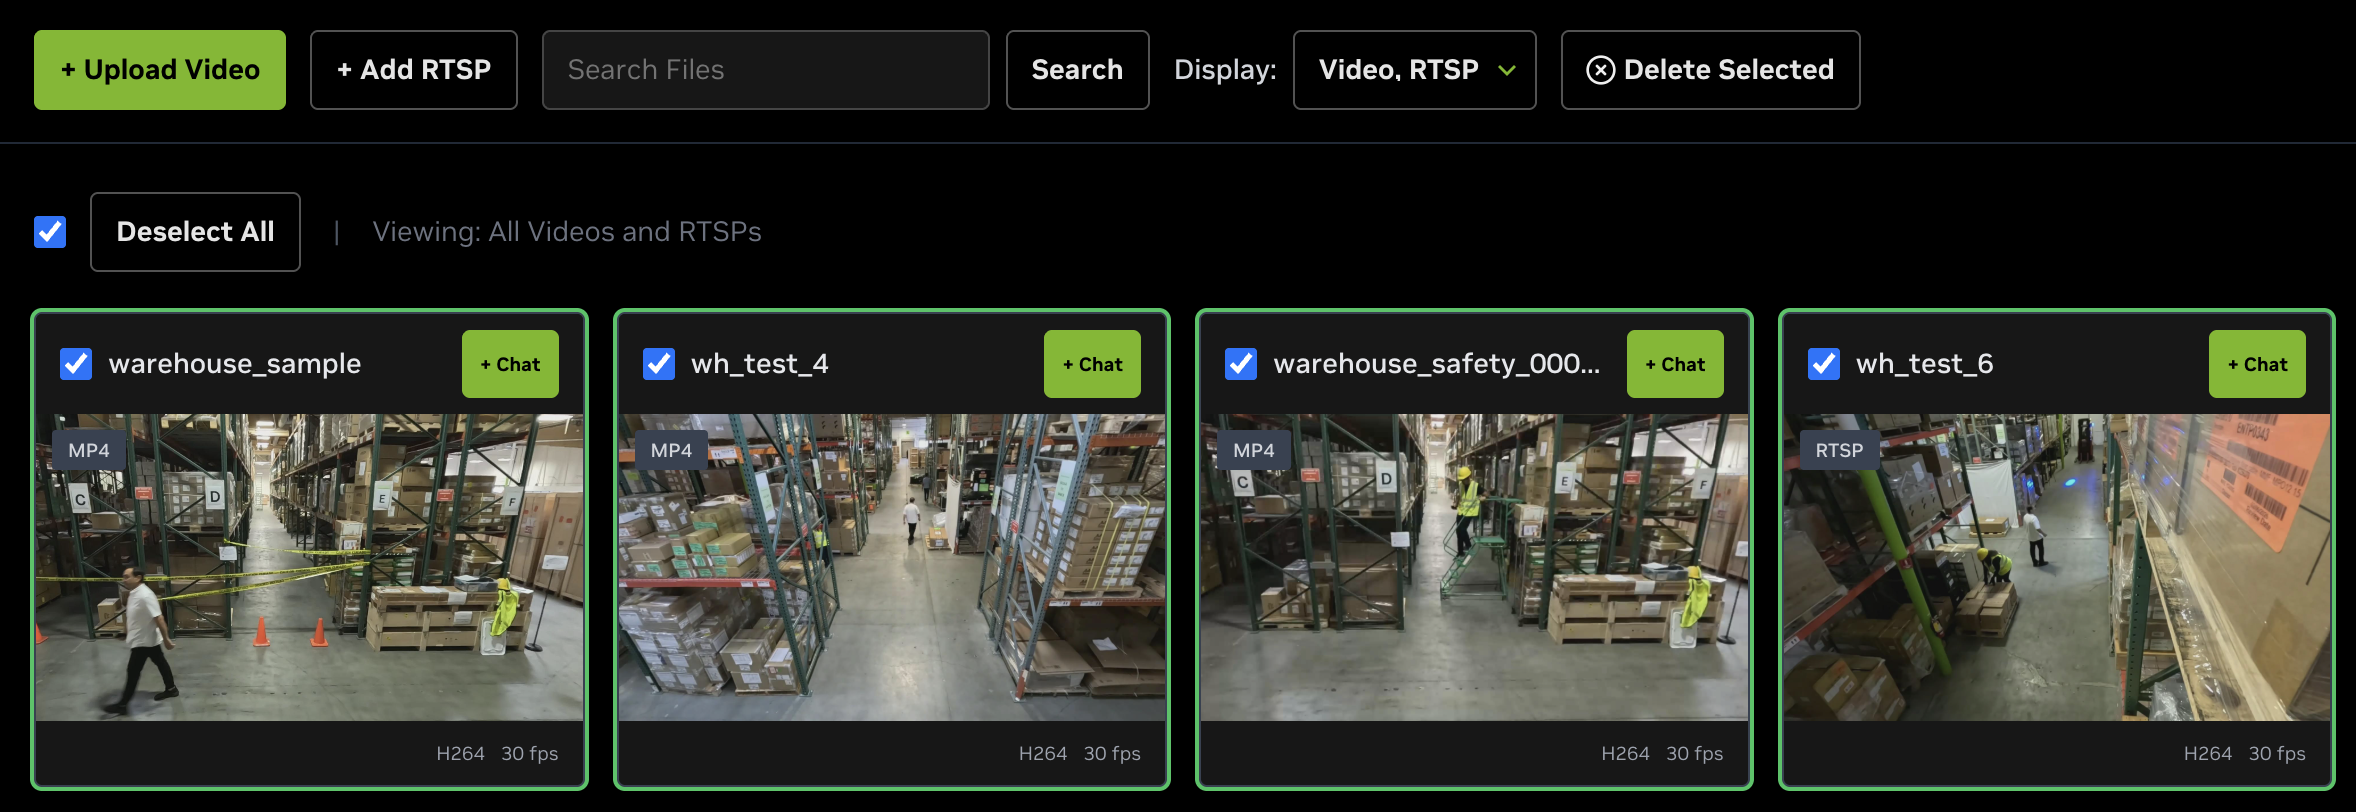
Toolbar Controls#

The toolbar at the top provides quick access to common operations:
Search Bar#

Type a search query to filter streams by name. Click the search button or press Enter to apply the filter.
Filter Toggles#
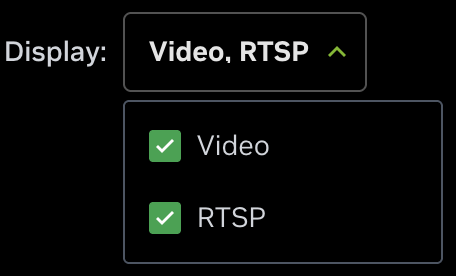
Toggle buttons to show/hide specific stream types:
Show Videos - Display uploaded video files
Show RTSPs - Display live RTSP camera streams
Both toggles are enabled by default. Disable either to filter the view.
Upload Video / Add RTSP Buttons#
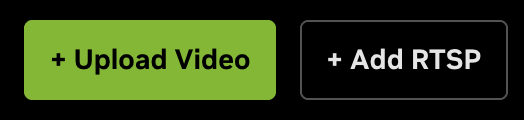
Upload Video - Opens the video upload dialog for uploading video files
Add RTSP - Opens the RTSP stream configuration dialog for adding live camera feeds
Note
These buttons may appear disabled (grayed out) if the deployment does not support the respective features. A disabled Upload Video button indicates that video file uploads are not enabled in the current deployment configuration. Similarly, a disabled Add RTSP button indicates that RTSP stream management is not supported in this deployment.
Streams Grid#
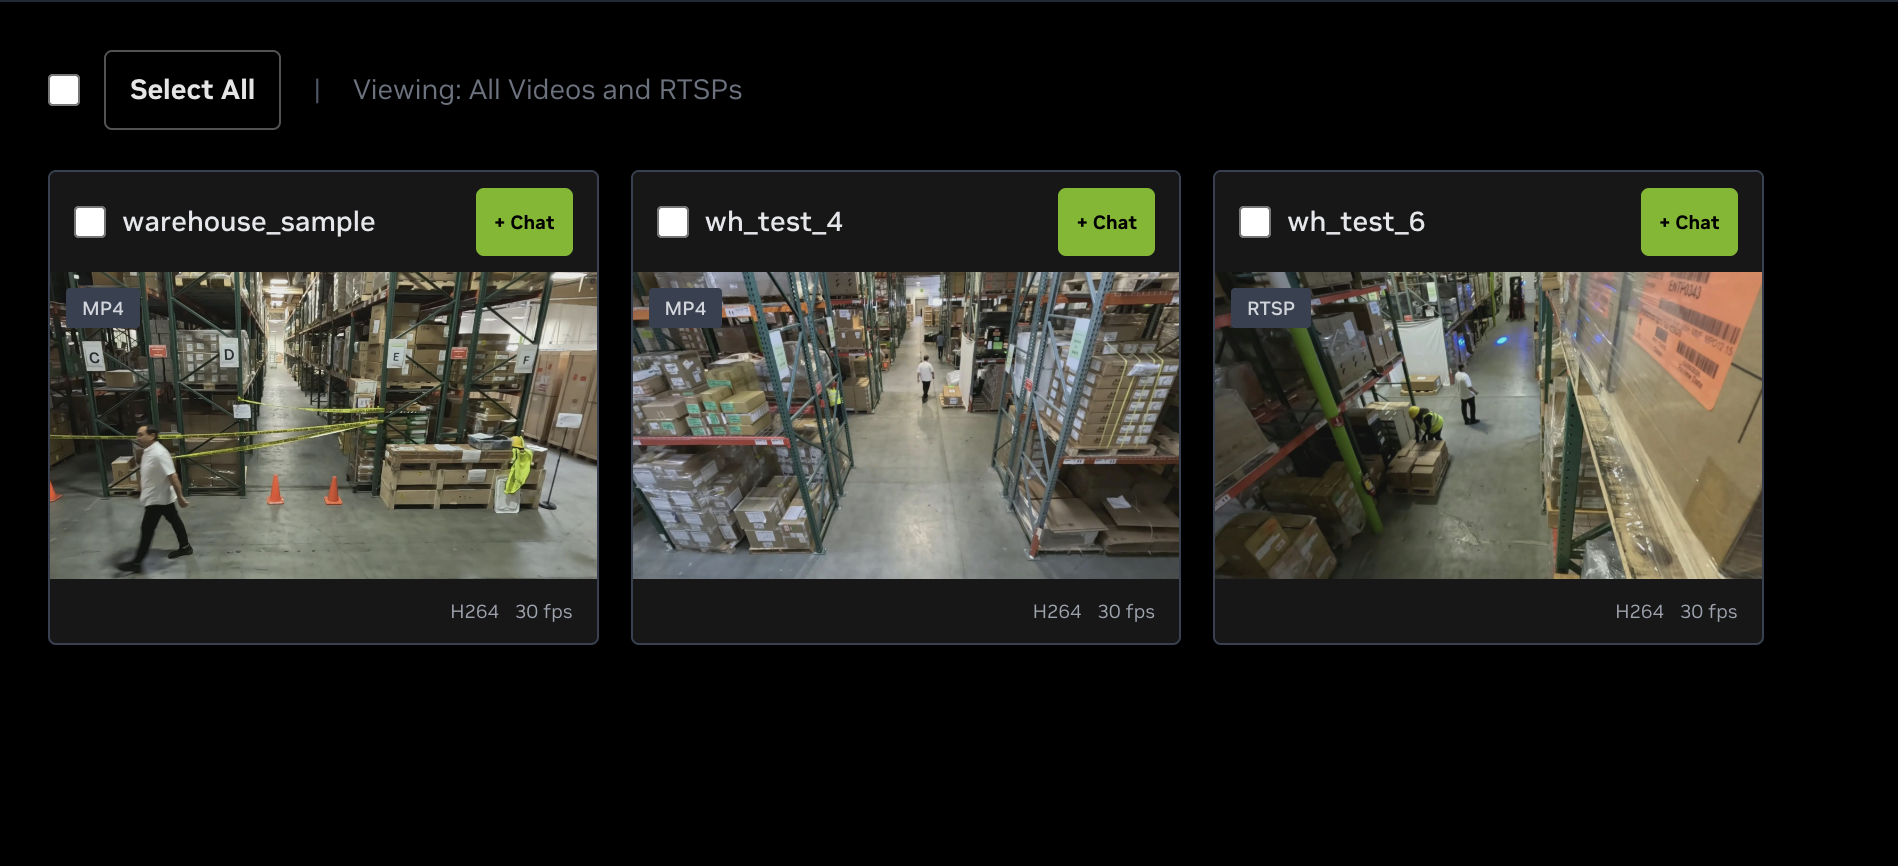
The main content area displays all streams as cards in a responsive grid layout.
Stream Card#
Each stream card displays:
Element |
Description |
Checkbox |
Select stream for bulk operations |
Stream Name |
Sensor or file name (displayed in header) |
Thumbnail |
Live preview for RTSP, last frame for uploaded videos |
Type Badge |
“RTSP” for live streams, file extension (e.g., “MP4”, “MKV”) for videos |
Copy Button |
Copy stream context to clipboard as JSON (contains |
Video Metadata |
Video codec (e.g., H264, H265) and framerate (e.g., 30 fps) |
Video Preview#
When you click on a stream card, a popup opens to play the video preview for that stream.
Empty State#
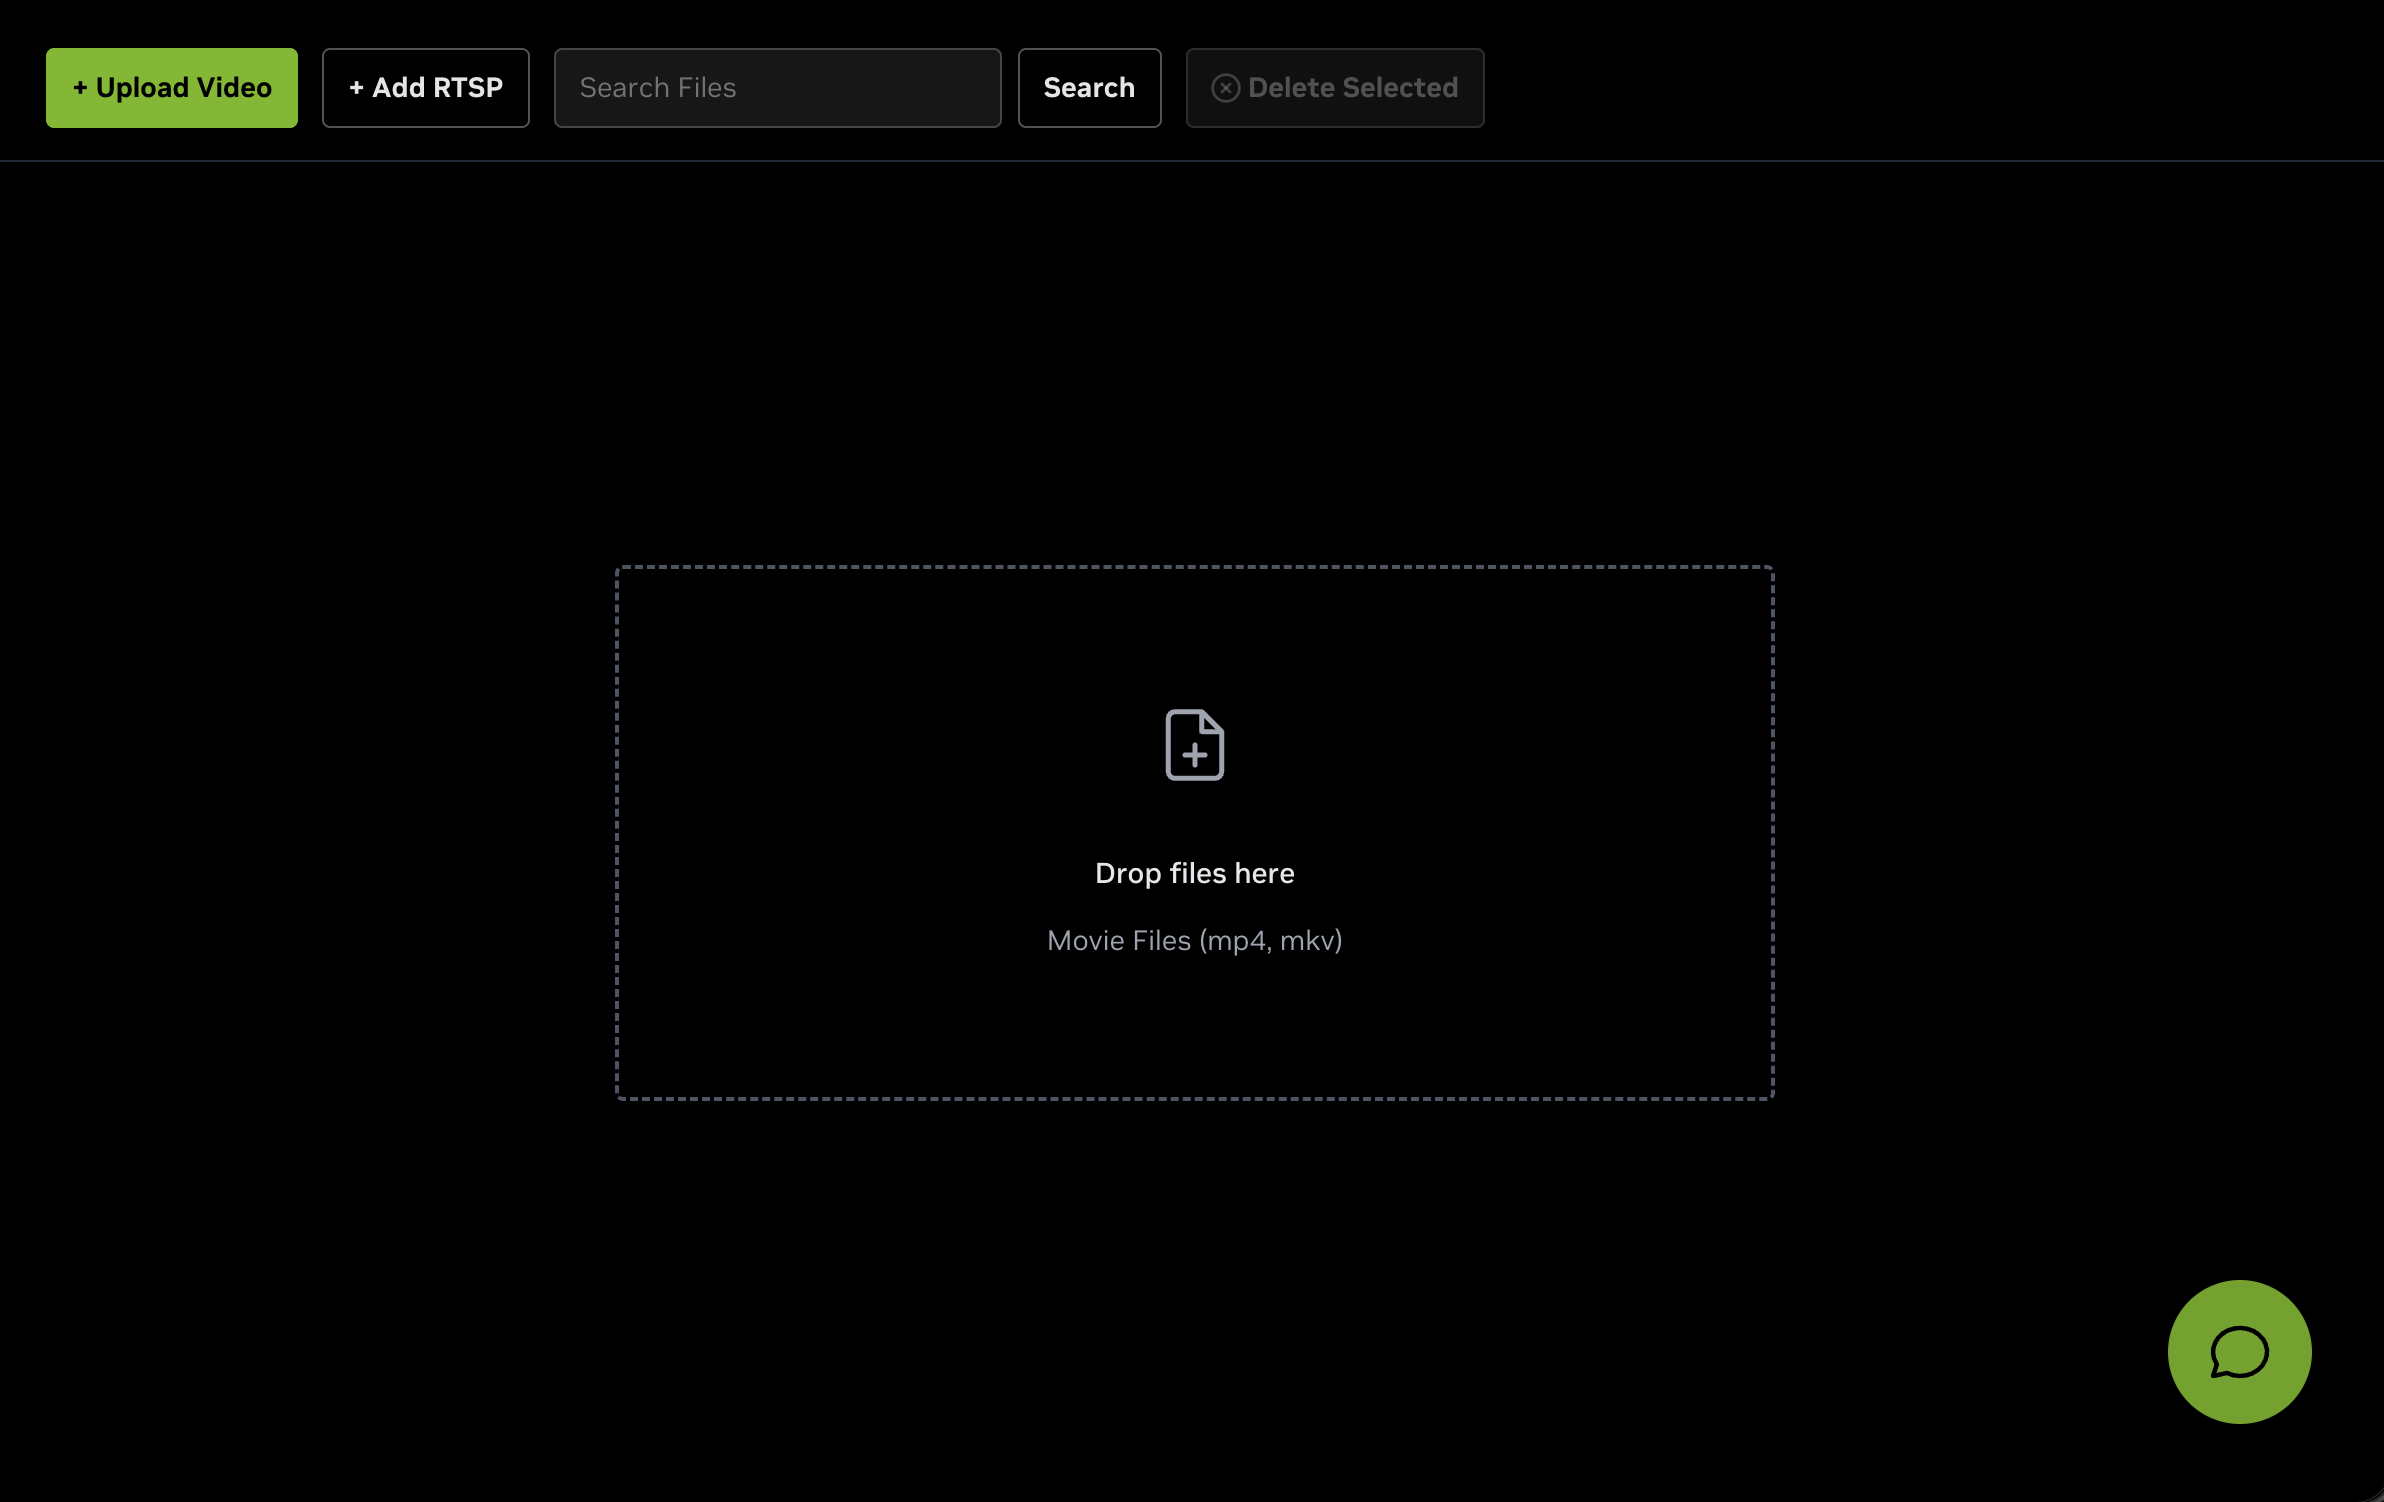
When no streams exist, an empty state is displayed with a button to upload your first video. Files can also be dragged and dropped into the empty state to upload them.
Upload Dialog#
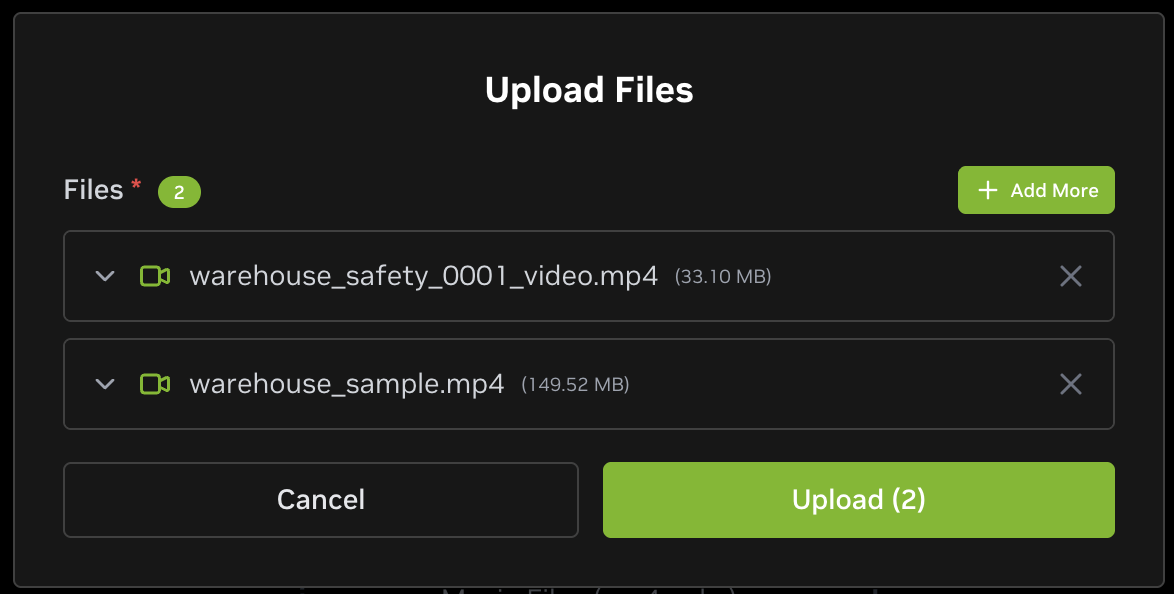
The upload dialog allows you to select video files and optionally configure them before uploading:
File Selection:
Click the dashed area or drag-and-drop files to select videos
Supported formats: MP4, MKV
Multiple files can be selected at once
Click “+ Add More” to add additional files after initial selection
File Configuration:
Each file in the upload list can be expanded (click the chevron icon) to configure optional fields if system-level configuration is enabled.
Note: Configuration fields are optional and only appear if NEXT_PUBLIC_CHAT_UPLOAD_FILE_CONFIG_TEMPLATE_JSON is configured. Common field types include boolean toggles, text inputs, number inputs, and select dropdowns. The available fields depend entirely on your system’s deployment configuration.
File Management:
Each file in the list shows the video icon, filename, file size in MB, expand/collapse button (chevron icon) to show/hide configuration fields, and remove button (X icon) to remove file from upload queue.
Click “Upload (N)” button to start uploading all files, or “Cancel” to close the dialog without uploading.
Upload Progress Panel#
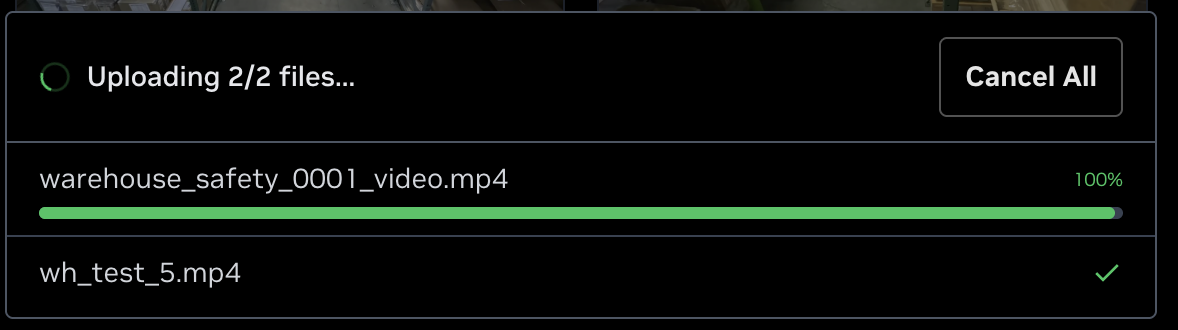
After confirming upload, a progress panel appears at the bottom of the screen.
Upload Status:
Each file displays one of the following statuses:
Status |
Description |
Pending |
File queued for upload |
Uploading |
Progress bar with percentage (0-100%) |
Success |
Upload completed successfully (green checkmark) |
Error |
Upload failed with error message |
Cancelled |
Upload was cancelled by user |
Progress Controls:
Cancel Uploads - Stop all pending and in-progress uploads
Close Panel - Dismiss the progress panel (only available when no uploads are in progress)
Note: The system uploads multiple files in parallel for faster processing. Successfully uploaded videos will appear in the streams grid automatically.
Adding RTSP Streams#
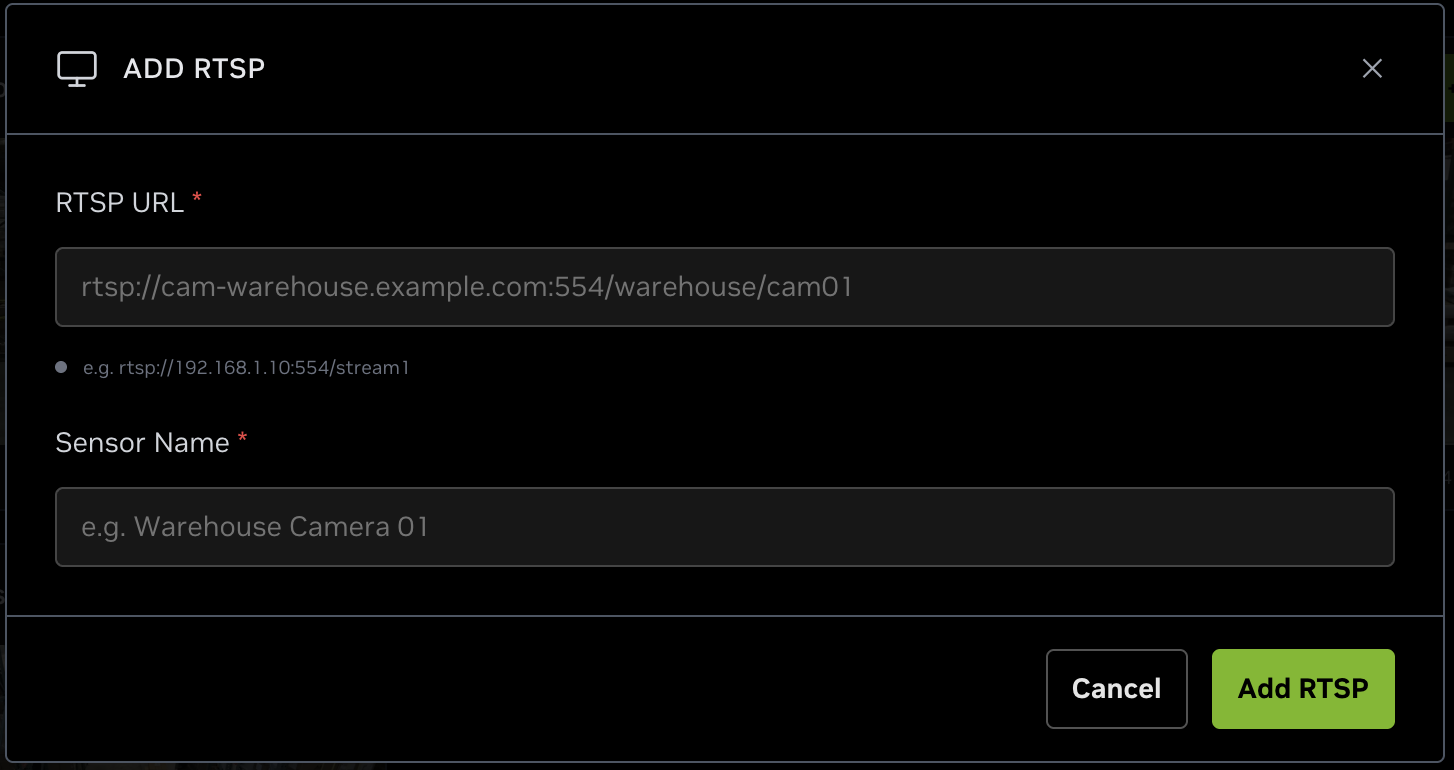
Click the “Add RTSP” button in the toolbar to add a live camera stream.
RTSP URL Field (Required):
Enter the RTSP stream URL in the format: rtsp://[username:password@]hostname:port/path
Examples:
rtsp://192.168.1.10:554/stream1rtsp://cam-warehouse.example.com:554/warehouse/cam01
The system will automatically extract a suggested sensor name from the URL path.
Sensor Name Field (Optional):
Enter a friendly name for the sensor (e.g., “Warehouse Camera 01”).
Auto-populated from RTSP URL path if not manually specified
Can be manually edited to provide a more descriptive name
Used for display in the streams grid
RTSP Validation:
The system validates RTSP URLs:
Must start with
rtsp://Connection is verified when “Add RTSP” button is clicked
Error messages displayed if URL is invalid or connection fails
Click “Add RTSP” to add the stream or “Cancel” to close the dialog.
Deleting Streams#
To delete streams:
Click the checkbox on one or more stream cards to select them
Click the “Delete Selected (N)” button in the toolbar
The selected streams will be deleted and the streams grid will be refreshed.
Warning: This action cannot be undone. Make sure you want to delete the selected streams before confirming.
Known Issues#
Overall Issues#
No known issues.
Global Chat Sidebar#
If the backend agent restarts, the UI doesn’t clear the outdated chat history.
Alerts Tab#
When a sensor is removed, its existing alerts may still appear in the alerts list, but the related thumbnails and videos are no longer accessible because the sensor data has been deleted.
Real-time alert rules created from the Manage Alerts sub-tab generate no alerts due to a bug w.r.t the parameters sent with the create request. Workaround: create the alert via the chat window first, then UI-created rules for that sensor work.
Dashboard Tab#
No known issues.
Search Tab#
The “Show top K Results” value should be kept below 100 for optimal search performance. Setting a higher value may result in slow responses or no results being returned.
When a live RTSP stream is removed directly from NVStreamer, the VSS Search UI may still display the stream as active.
Video Management Tab#
There is no way to rename a stream after uploading. This will be fixed in an upcoming update. Until then, to use a different name you must upload a new stream with the desired name.
When using Select All delete to remove a mix of RTSP streams and uploaded videos, the RTSP stream entry may stay visible (stale) after the first delete. The UI list is not refreshed automatically; a second Select All delete (or a manual UI refresh) is required to fully clear the RTSP entry.