Alert Verification Performance#
Overview#
The VSS Alert Bridge verification pipeline processes live RTSP streams through CV detection and analytics (RTVI-CV and video-analytics microservices) and a VLM stage to classify and confirm security alerts. Benchmarks measure end-to-end (E2E) latency, per-stage latency contribution, and verified alert throughput across the NVIDIA RTX PRO 6000 WE, DGX Spark, and AGX Thor platforms using RT-DETR with a local LLM, and the DGX H100 SXM using RT-DETR and Grounding DINO (GDINO) with local and remote VLM deployment modes.
Test Configuration#
Parameter |
Value |
|---|---|
VSS Release |
3.2 |
Platforms tested |
NVIDIA RTX PRO 6000 WE, DGX Spark, AGX Thor, DGX H100 SXM |
CV model |
RT-DETR (Resnet50) |
VLM deployment mode |
RTVI-VLM (‘ngc:nim/nvidia/cosmos-reason2-8b:hf-1208’) |
Stream concurrency |
1-60 concurrent RTSP streams (platform-dependent) |
Configured stream FPS |
10 |
Video resolution |
1920x1080 (1080p) |
OSL |
1 |
Test date |
May 2026 |
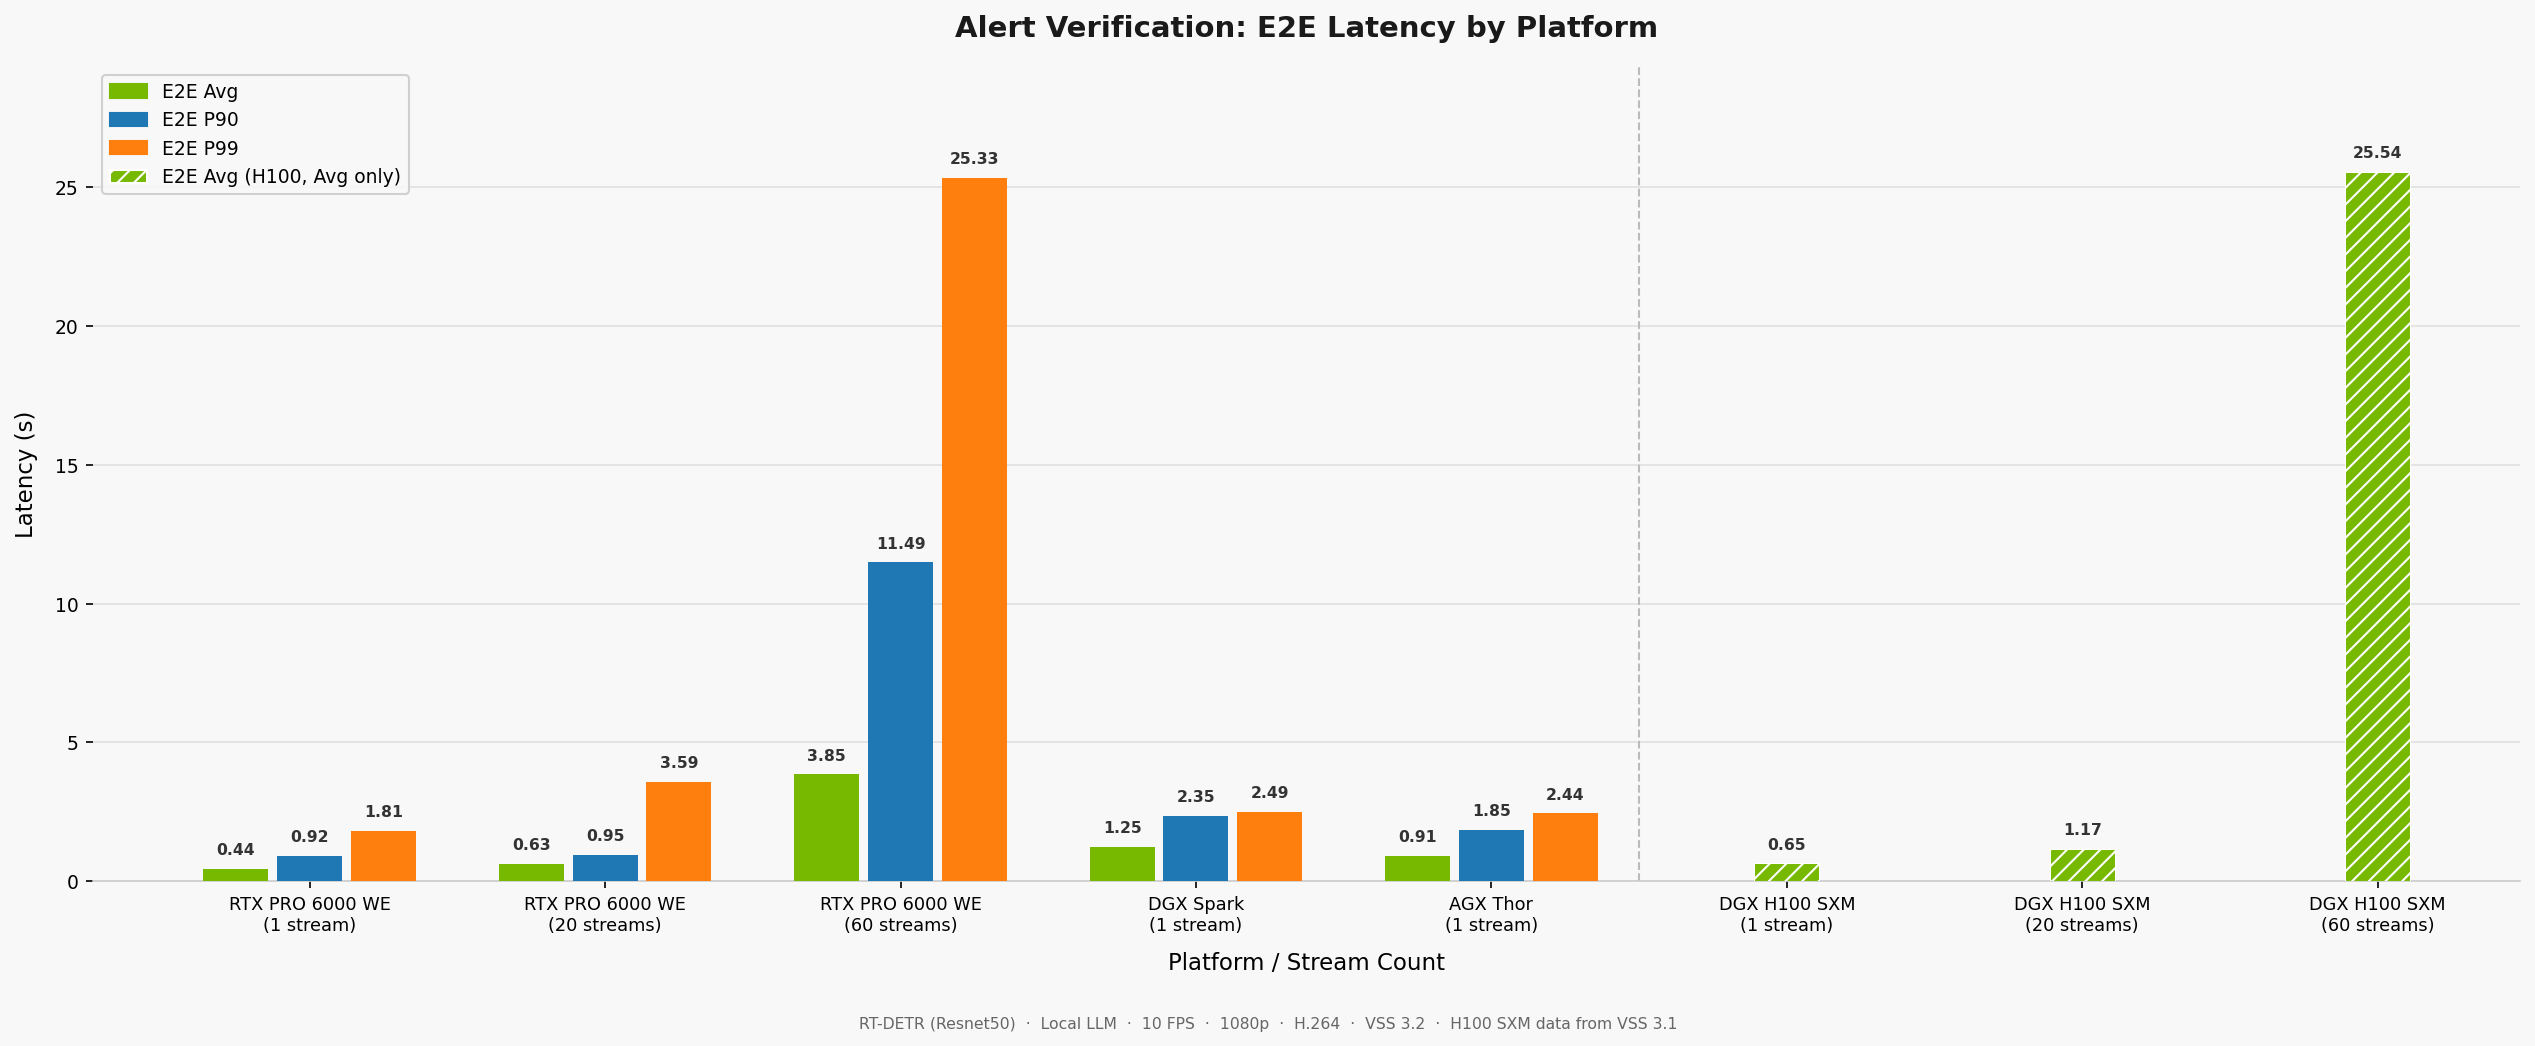
E2E latency (Avg, P90, P99) across platform and stream-count configurations. At 20 streams the RTX PRO 6000 WE delivers sub-second average latency; at 60 streams tail latency grows significantly due to GPU contention and Kafka backpressure. DGX Spark sustains sub-second latency at a single stream.#
Performance by Platform#
Streams |
E2E Avg (s) |
E2E P90 (s) |
E2E P99 (s) |
VLM P90 (s) |
Alerts MS Processing P90 (s) |
Verified/min/stream |
VLM Verifications/min |
|---|---|---|---|---|---|---|---|
1 |
0.44 |
0.92 |
1.81 |
0.45 |
0.01 |
4.60 |
6.6 |
20 |
0.63 |
0.95 |
3.59 |
0.76 |
0.01 |
3.34 |
100.6 |
60 |
3.85 |
11.49 |
25.33 |
2.83 |
2.22 |
3.75 |
337.3 |
Latency Stage Breakdown — 1 Stream
Stage |
Avg (s) |
P90 (s) |
|---|---|---|
End-to-End |
0.44 |
0.92 |
VLM Inference |
0.22 |
0.45 |
VST Fetch |
0.15 |
0.23 |
Alerts MS Processing |
0.01 |
0.01 |
Upstream (CV+Analytics) |
0.04 |
0.45 |
Video Length |
6.17 |
9.63 |
Latency Stage Breakdown — 20 Streams
Stage |
Avg (s) |
P90 (s) |
|---|---|---|
End-to-End |
0.63 |
0.95 |
VLM Inference |
0.36 |
0.76 |
VST Fetch |
0.17 |
0.23 |
Alerts MS Processing |
0.01 |
0.01 |
Upstream (CV+Analytics) |
0.07 |
0.45 |
Video Length |
6.00 |
9.62 |
Latency Stage Breakdown — 60 Streams
Stage |
Avg (s) |
P90 (s) |
|---|---|---|
End-to-End |
3.85 |
11.49 |
VLM Inference |
1.41 |
2.83 |
VST Fetch |
0.53 |
1.67 |
Alerts MS Processing |
0.48 |
2.22 |
Upstream (CV+Analytics) |
0.12 |
0.46 |
Video Length |
5.82 |
9.60 |
Note
Data for this platform was collected using VSS 3.1.
RT-DETR — Local LLM
Streams |
Alert Rate (alerts/min/stream) |
E2E Avg (s) |
VLM Avg (s) |
VST Avg (s) |
CV+BA Avg (s) |
Alerts MS Processing Avg (s) |
Events |
|---|---|---|---|---|---|---|---|
1 |
1.60 |
0.65 |
0.41 |
0.18 |
0.05 |
0.00 |
8 |
10 |
1.58 |
0.92 |
0.69 |
0.16 |
0.07 |
0.00 |
79 |
20 |
1.64 |
1.17 |
0.94 |
0.14 |
0.07 |
0.00 |
164 |
60 |
0.95 |
25.54 |
4.01 |
0.05 |
0.09 |
21.58 |
285 |
RT-DETR — Remote LLM
Streams |
Alert Rate (alerts/min/stream) |
E2E Avg (s) |
VLM Avg (s) |
VST Avg (s) |
CV+BA Avg (s) |
Alerts MS Processing Avg (s) |
Events |
|---|---|---|---|---|---|---|---|
20 |
0.75 |
0.88 |
0.66 |
0.11 |
0.10 |
0.00 |
75 |
40 |
0.74 |
38.22 |
4.71 |
0.03 |
0.08 |
32.88 |
149 |
60 |
0.77 |
26.99 |
4.13 |
0.04 |
0.09 |
22.60 |
232 |
Grounding DINO — Local LLM (shared model)
Streams |
Alert Rate (alerts/min/stream) |
E2E Avg (s) |
VLM Avg (s) |
VST Avg (s) |
CV+BA Avg (s) |
Alerts MS Processing Avg (s) |
Events |
|---|---|---|---|---|---|---|---|
1 |
0.40 |
0.65 |
0.48 |
0.07 |
0.09 |
0.00 |
2 |
10 |
0.62 |
1.19 |
0.96 |
0.10 |
0.11 |
0.00 |
31 |
20 |
2.72 |
2.60 |
0.43 |
0.03 |
2.13 |
0.00 |
272 |
40 |
N/A |
N/A |
N/A |
N/A |
N/A |
N/A |
0 |
60 (57) |
0.74 |
7.60 |
0.28 |
0.03 |
7.29 |
0.00 |
210 |
Grounding DINO — Remote LLM
Streams |
Alert Rate (alerts/min/stream) |
E2E Avg (s) |
VLM Avg (s) |
VST Avg (s) |
CV+BA Avg (s) |
Alerts MS Processing Avg (s) |
Events |
|---|---|---|---|---|---|---|---|
20 |
2.12 |
2.58 |
0.38 |
0.03 |
2.16 |
0.00 |
212 |
40 |
N/A |
N/A |
N/A |
N/A |
N/A |
N/A |
0 |
60 (47) |
0.39 |
7.90 |
0.26 |
0.03 |
7.59 |
0.00 |
92 |
Note
GDINO at 40 streams produced no events in both local and remote LLM modes. The 60-stream target auto-scaled to 57 streams (local) and 47 streams (remote) due to GPU resource saturation.
Note
The low-latency-mode flag was enabled in the perception configs for this run.
Streams |
E2E Avg (s) |
E2E P90 (s) |
E2E P99 (s) |
VLM P90 (s) |
Alerts MS Processing P90 (s) |
Verified/min/stream |
VLM Verifications/min |
|---|---|---|---|---|---|---|---|
1 |
1.25 |
2.35 |
2.49 |
1.76 |
0.01 |
4.90 |
6.7 |
Latency Stage Breakdown
Stage |
Avg (s) |
P90 (s) |
|---|---|---|
End-to-End |
1.25 |
2.35 |
VLM Inference |
1.00 |
1.76 |
VST Fetch |
0.18 |
0.23 |
Alerts MS Processing |
0.01 |
0.01 |
Upstream (CV+Analytics) |
0.02 |
0.45 |
Video Length |
6.11 |
9.61 |
Note
DGX Spark sustains single-stream alert verification at sub-second E2E latency. Multi-stream configurations have not been validated on this platform.
Note
The low-latency-mode flag was enabled in the perception configs for this run.
Streams |
E2E Avg (s) |
E2E P90 (s) |
E2E P99 (s) |
VLM P90 (s) |
Alerts MS Processing P90 (s) |
Verified/min/stream |
VLM Verifications/min |
|---|---|---|---|---|---|---|---|
1 |
0.91 |
1.85 |
2.44 |
0.95 |
0.01 |
3.73 |
6.2 |
Latency Stage Breakdown — 1 Stream
Stage |
Avg (s) |
P90 (s) |
|---|---|---|
End-to-End |
0.91 |
1.85 |
VLM Inference |
0.68 |
0.95 |
VST Fetch |
0.17 |
0.25 |
Alerts MS Processing |
0.01 |
0.01 |
Upstream (CV+Analytics) |
0.04 |
0.45 |
Video Length |
6.59 |
9.59 |
Note
All benchmarks use RT-DETR (Resnet50) at 1080p, H.264 input.