VSS Warehouse Blueprint - 2D Vision AI with Agents Profile#
Overview#
Introduction#
The VSS Warehouse Blueprint’s 2D Vision AI with Agents Profile is a comprehensive guide to building a 2D intelligent video analytics system. It provides a detailed overview of the system architecture, data flow, and key components.
Deployment Architecture#
Components and Interactions#
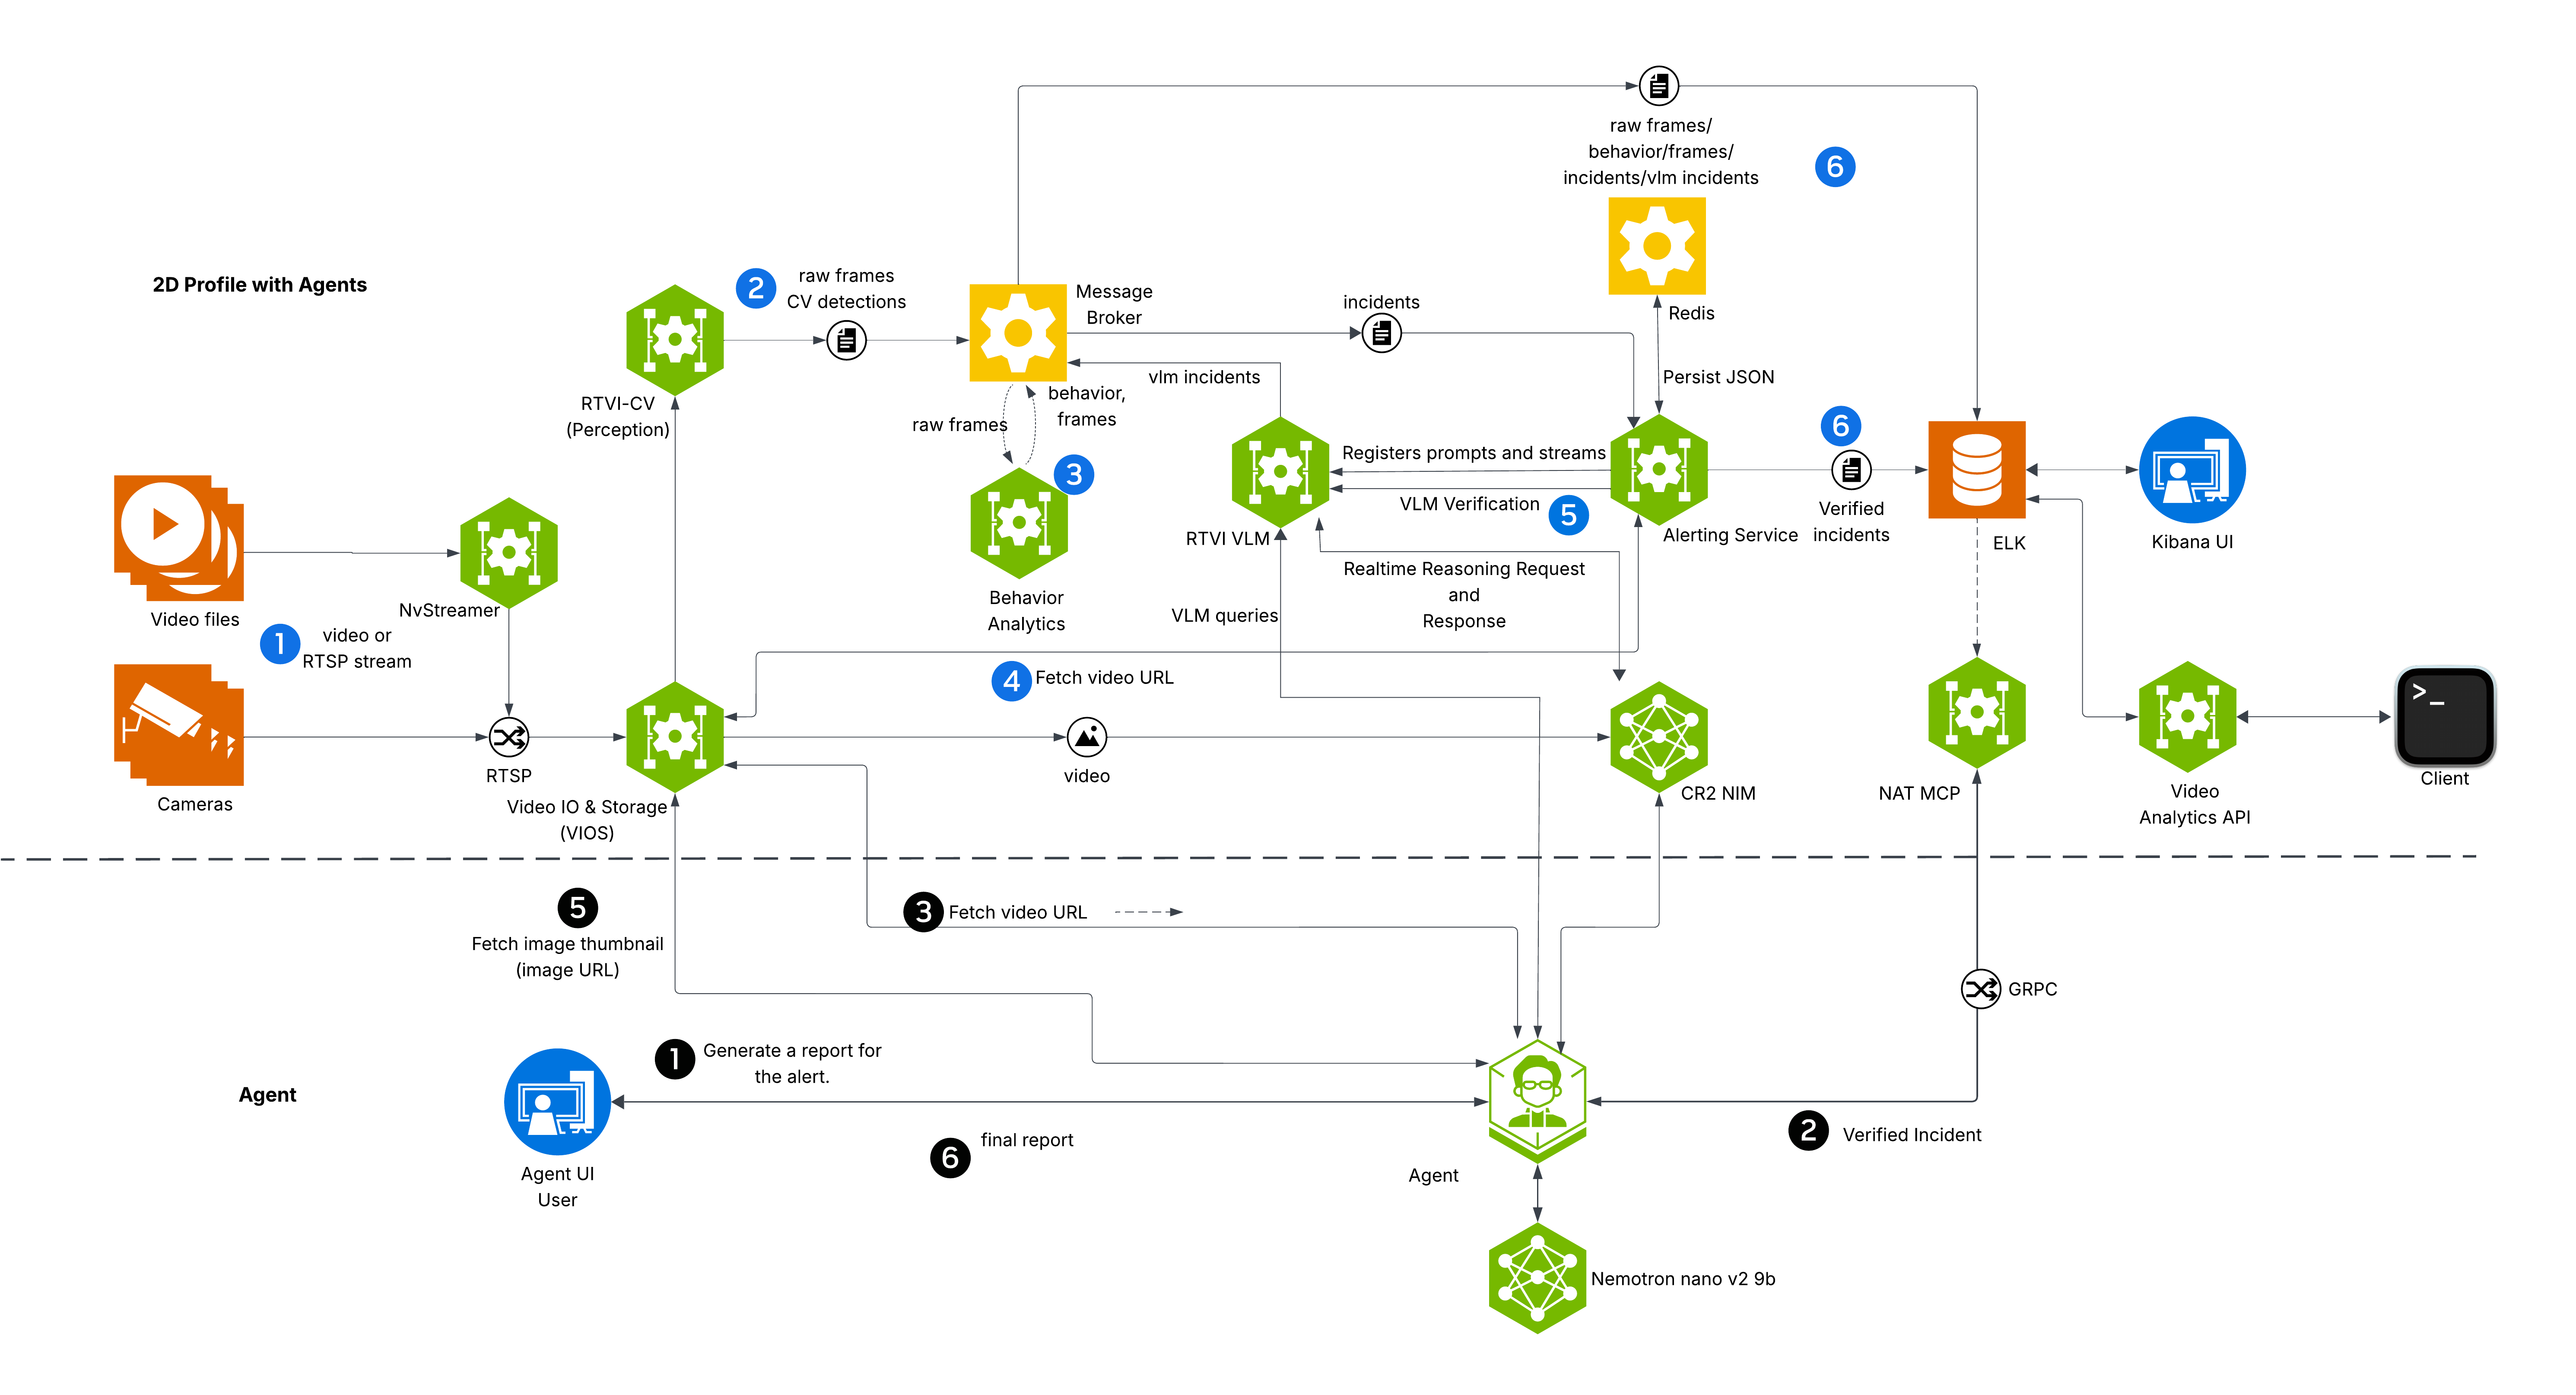
The diagram depicts VSS Warehouse 2D Vision AI with Agents Profile, emphasizing 2D single-camera detection, tracking, and behavior analytics for safety events and metrics. Below is a breakdown of the components and their interactions.
Input Source
Videos: Raw video data stored in a filesystem, serving as input for processing.
NvStreamer (link): A microservice that streams videos via RTSP (Real-Time Streaming Protocol) to the VIOS (Video IO & Storage). NvStreamer can be swapped with real-world cameras.
Video IO & Storage (VIOS) (link):
VIOS ingests video streams from NvStreamer via RTSP.
It records the streams and forwards them (via RTSP) to the DeepStream microservice for further processing.
DeepStream (link):
DeepStream processes RTSP streams for 2D single-camera detection and tracking, utilizing the RT-DETR (Real-Time Detection Transformer) model (link) to generate precise 2D bounding boxes for diverse objects including people, humanoid robots, autonomous vehicles, and warehouse equipment.
RT-DETR features a ResNet-50 backbone, pretrained on warehouse scene datasets for accurate 2D object detection in industrial environments.
It sends frame data, including detected and tracked object IDs, in Protobuf format to the Kafka messaging system via the
mdx-rawtopic.
Kafka (Messaging System) (link):
Kafka serves as the central hub for data distribution, using Protobuf for all data exchanges.
It also functions as a control bus, managing notifications (in JSON, via
mdx-notification) for calibration updates, such as new ROI or tripwire definitions.
Behavior Analytics (link):
This microservice consumes
mdx-rawdata (Protobuf) from Kafka.It processes the data to generate behavior analytics, safety insights, and metrics (ROI occupancy, tripwire crossings, proximity detections).
The resulting data, in Protobuf format, is sent back to Kafka (
mdx-behavior,mdx-events,mdx-incidents) for indexing into Elasticsearch.Candidate incidents (e.g., proximity violations) are forwarded to the Alerting Service for VLM-based verification.
RTVI VLM (Real-Time Vision-Language Model) (link):
A real-time inference microservice that processes video through a Vision-Language Model (VLM).
Chunks live RTSP streams or stored video clips into short segments and sends them to the VLM NIM for analysis.
Serves both the Alert Verification workflow (re-evaluating candidate events) and the Real-Time Alerts workflow (continuous always-on monitoring).
Alerting Service (link):
Operates in two modes:
Alert Verification: Consumes candidate events from Behavior Analytics (e.g.,
proximity violationonmdx-incidents), fetches the corresponding video clip from VIOS, sends it with a category-specific prompt to the VLM via RTVI VLM, and writes a verdict (confirmed/rejected/unverified) to Elasticsearch and Kafka.Real-Time Alerts: Applies always-on rules (PPE, Load Quality, Pathway Obstruction, Spillover) to live RTSP streams via RTVI VLM, emitting an alert whenever the VLM classifies a chunk as a violation.
Alert type configurations are stored in Redis (RedisJSON) and can be updated at runtime.
For the full microservice reference, see Alerts Microservice.
LLM and VLM NIMs:
VLM NIM (e.g., NVIDIA Cosmos Reason 2 8B): The vision-language model backend that powers alert verification, real-time alerts, and video understanding for the agent. Receives video frames plus prompts and returns structured predictions.
LLM NIM (e.g., NVIDIA Nemotron Nano 9B v2): The language model that powers the agent’s reasoning, query routing, and report generation.
Storage
Redis (link): Stores alert type configurations (RedisJSON), sensor data router state, and serves as an optional message broker.
ELK (Elasticsearch, Logstash, Kibana) (link): Logstash retrieves raw frames, behavior, incidents, and VLM alert outputs from Kafka, converts Protobuf to JSON, stores the data in Elasticsearch, and supports querying and visualization.
Visualization
External Interfaces
Agents (link):
VSS Agent: An LLM-powered orchestration agent that interprets natural language queries, plans multi-step workflows, and invokes MCP tools. Capabilities include:
Querying warehouse safety incidents and occupancy data
Starting and stopping real-time VLM alert rules on specific cameras
Generating structured incident reports using VLM video analysis
Retrieving live camera snapshots and video clips
Agentic Reference UI (link): A browser-based interface with Chat, Alerts, and Dashboard modes for interacting with the agent system.
Key Technologies#
Microservices: Components like NvStreamer, VIOS, DeepStream, Behavior Analytics, RTVI VLM, and the Alerting Service are modular, independently deployable microservices.
RTSP: Facilitates real-time video streaming between cameras, NvStreamer, VIOS, and RTVI VLM.
Vision-Language Models (VLMs): NVIDIA Cosmos Reason 2 enables multi-step visual reasoning for alert verification, real-time anomaly detection, and video understanding.
Large Language Models (LLMs): NVIDIA Nemotron Nano 9B v2 powers agent reasoning, query interpretation, and report generation.
MCP (Model Context Protocol): A standardized tool interface that exposes microservice capabilities (analytics queries, alert management, video storage) to the LLM-powered agent.
Protobuf: Ensures efficient, compact data exchange across the CV pipeline.
Kafka: Manages data distribution and control messaging across all microservices.
Redis: Stores alert configurations (RedisJSON) and provides optional message streaming.
ELK Stack: Supports storage, logging, and visualization of events, incidents, and alert verdicts.
JSON: Used for notifications, calibration data, and VLM alert outputs.
Setup and Configuration#
For more information on set up and configuration, see the Quickstart Guide.
Testing and Validation#
Kibana UI#
Note
In the new Kibana UI (versions 8.0 and later), “Index Patterns” have been renamed to “Data Views”.
Check for Events, Frames and Behavior Data Views in Kibana
Launch Chrome browser
In the address bar enter
http://<IP_address>:7777/kibana
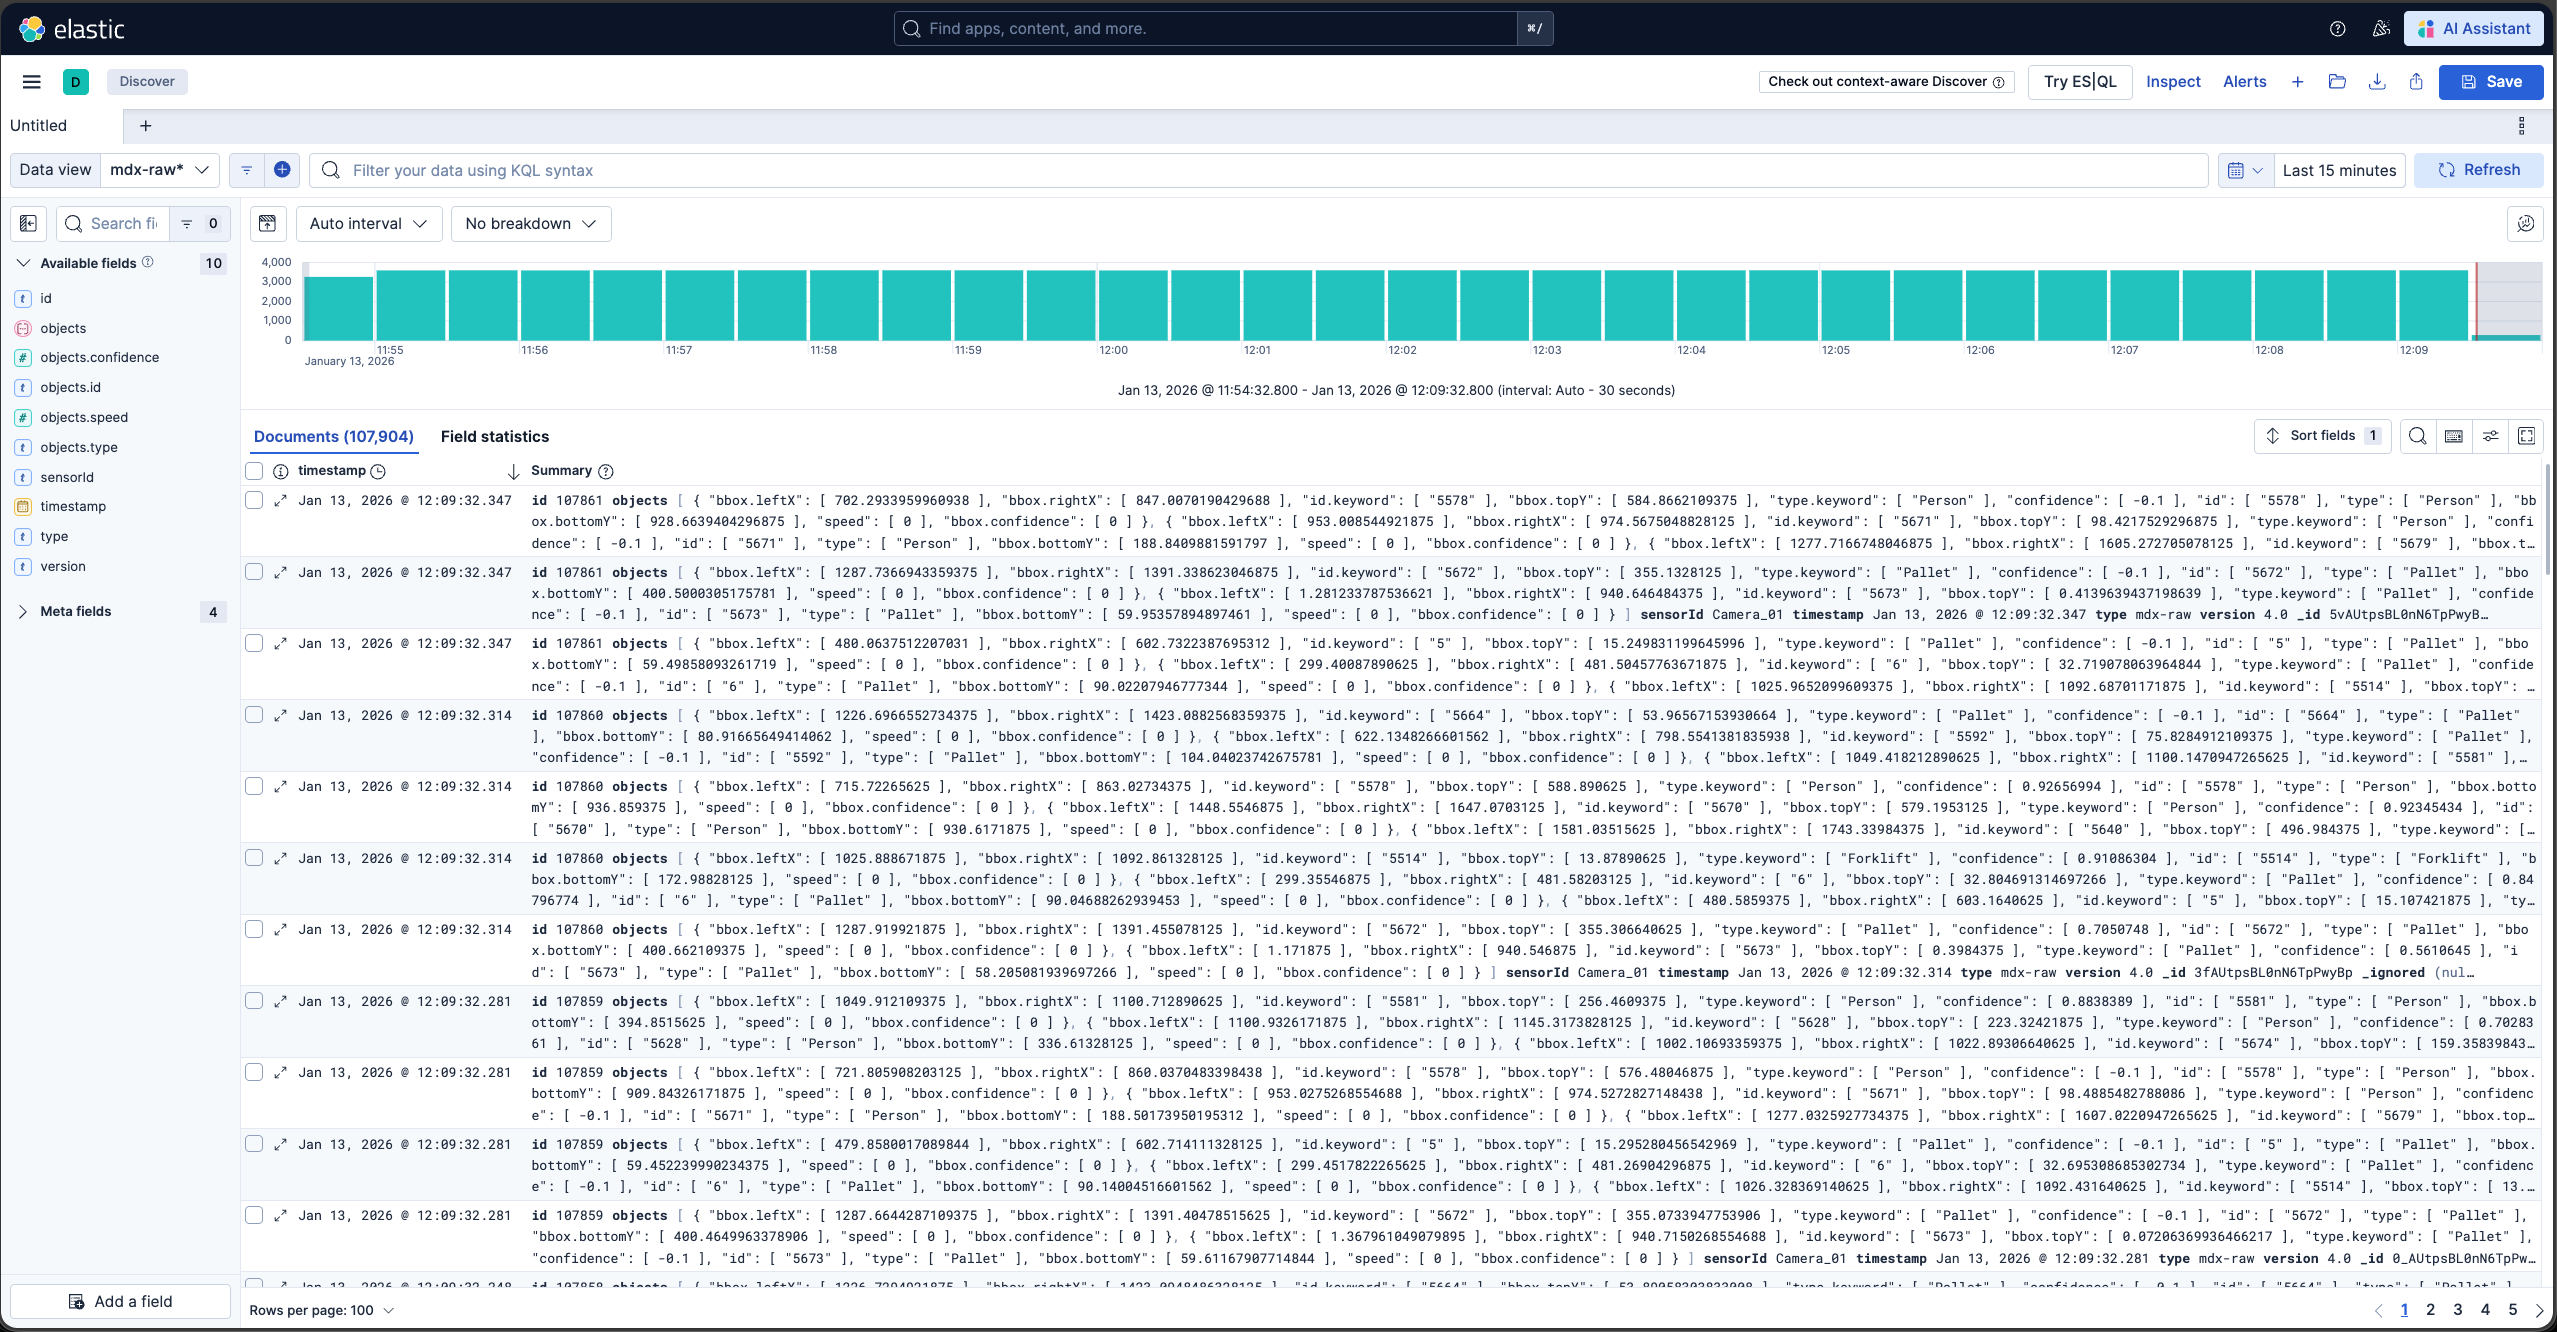
In the user interface, navigate to the Management -> Stack Management section and select Data Views under Kibana. If the data views are not visible, create new data view (via “Create data view” button on the top right corner) for mdx-raw, mdx-frames and mdx-behavior.
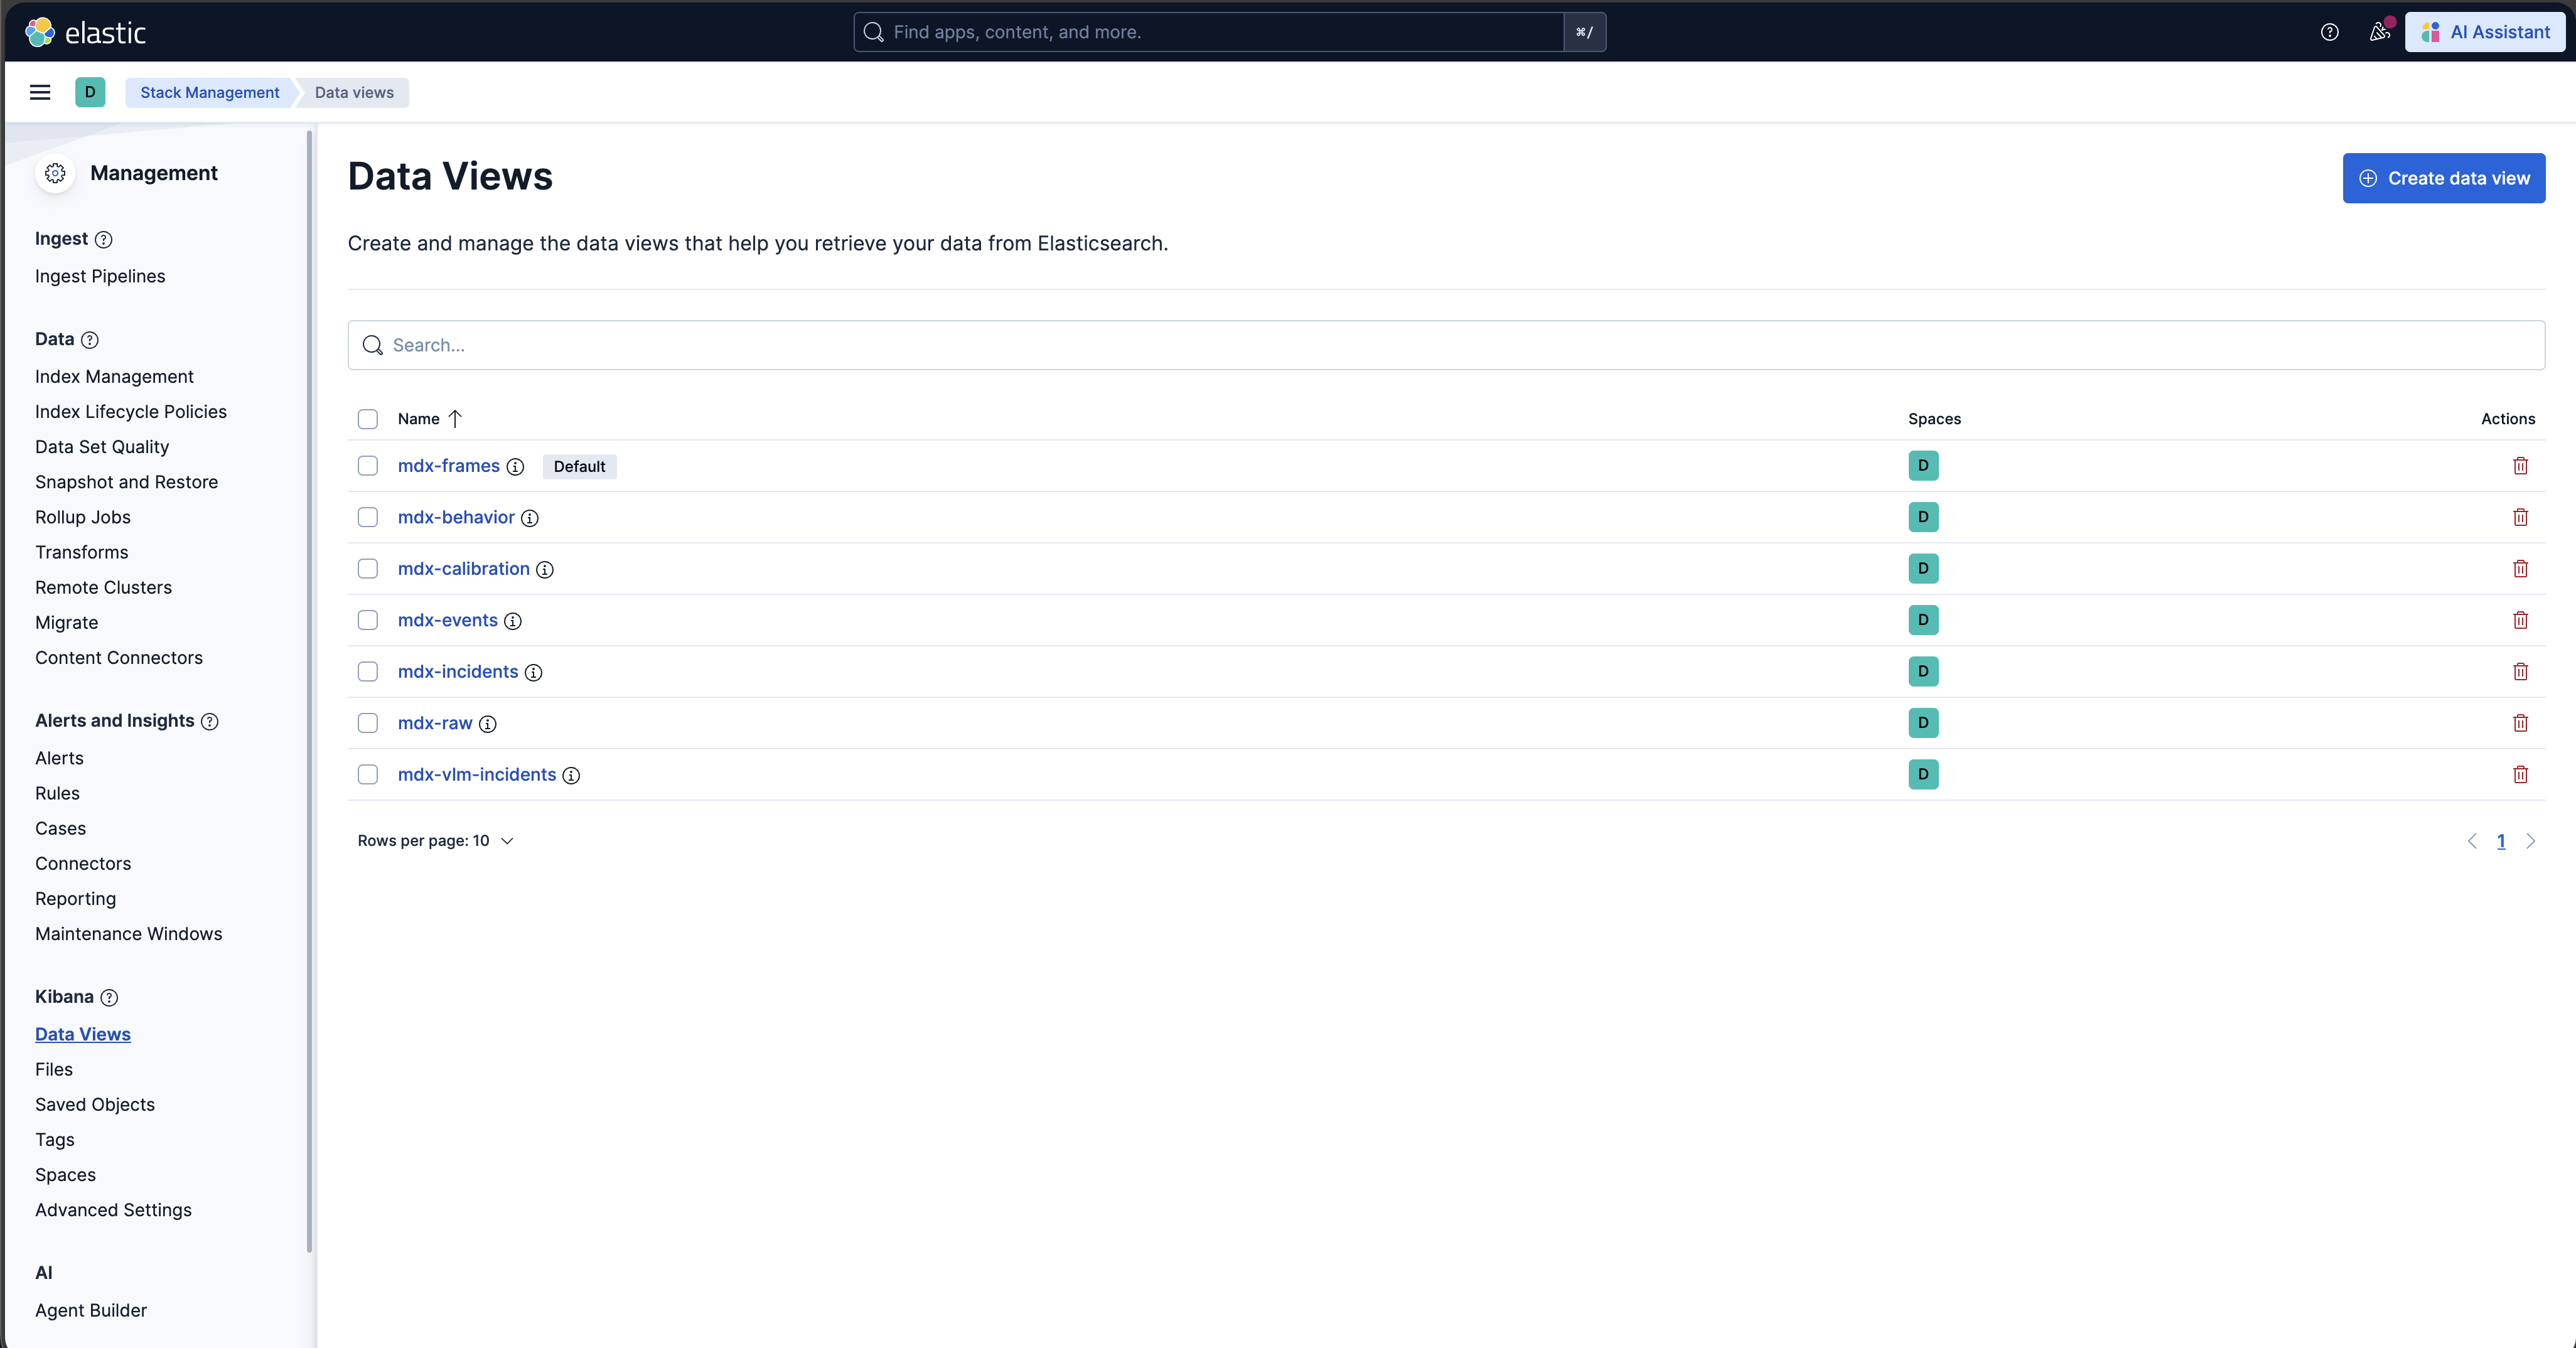
Browse the Kibana UI, discover the data views and visualize the data.
VIOS UI#
Please note: At this point the web-based application is only available for Chrome browser running on Linux, Windows or MacOS, details can be found in VIOS docs.
Launch Chrome browser
In the address bar enter
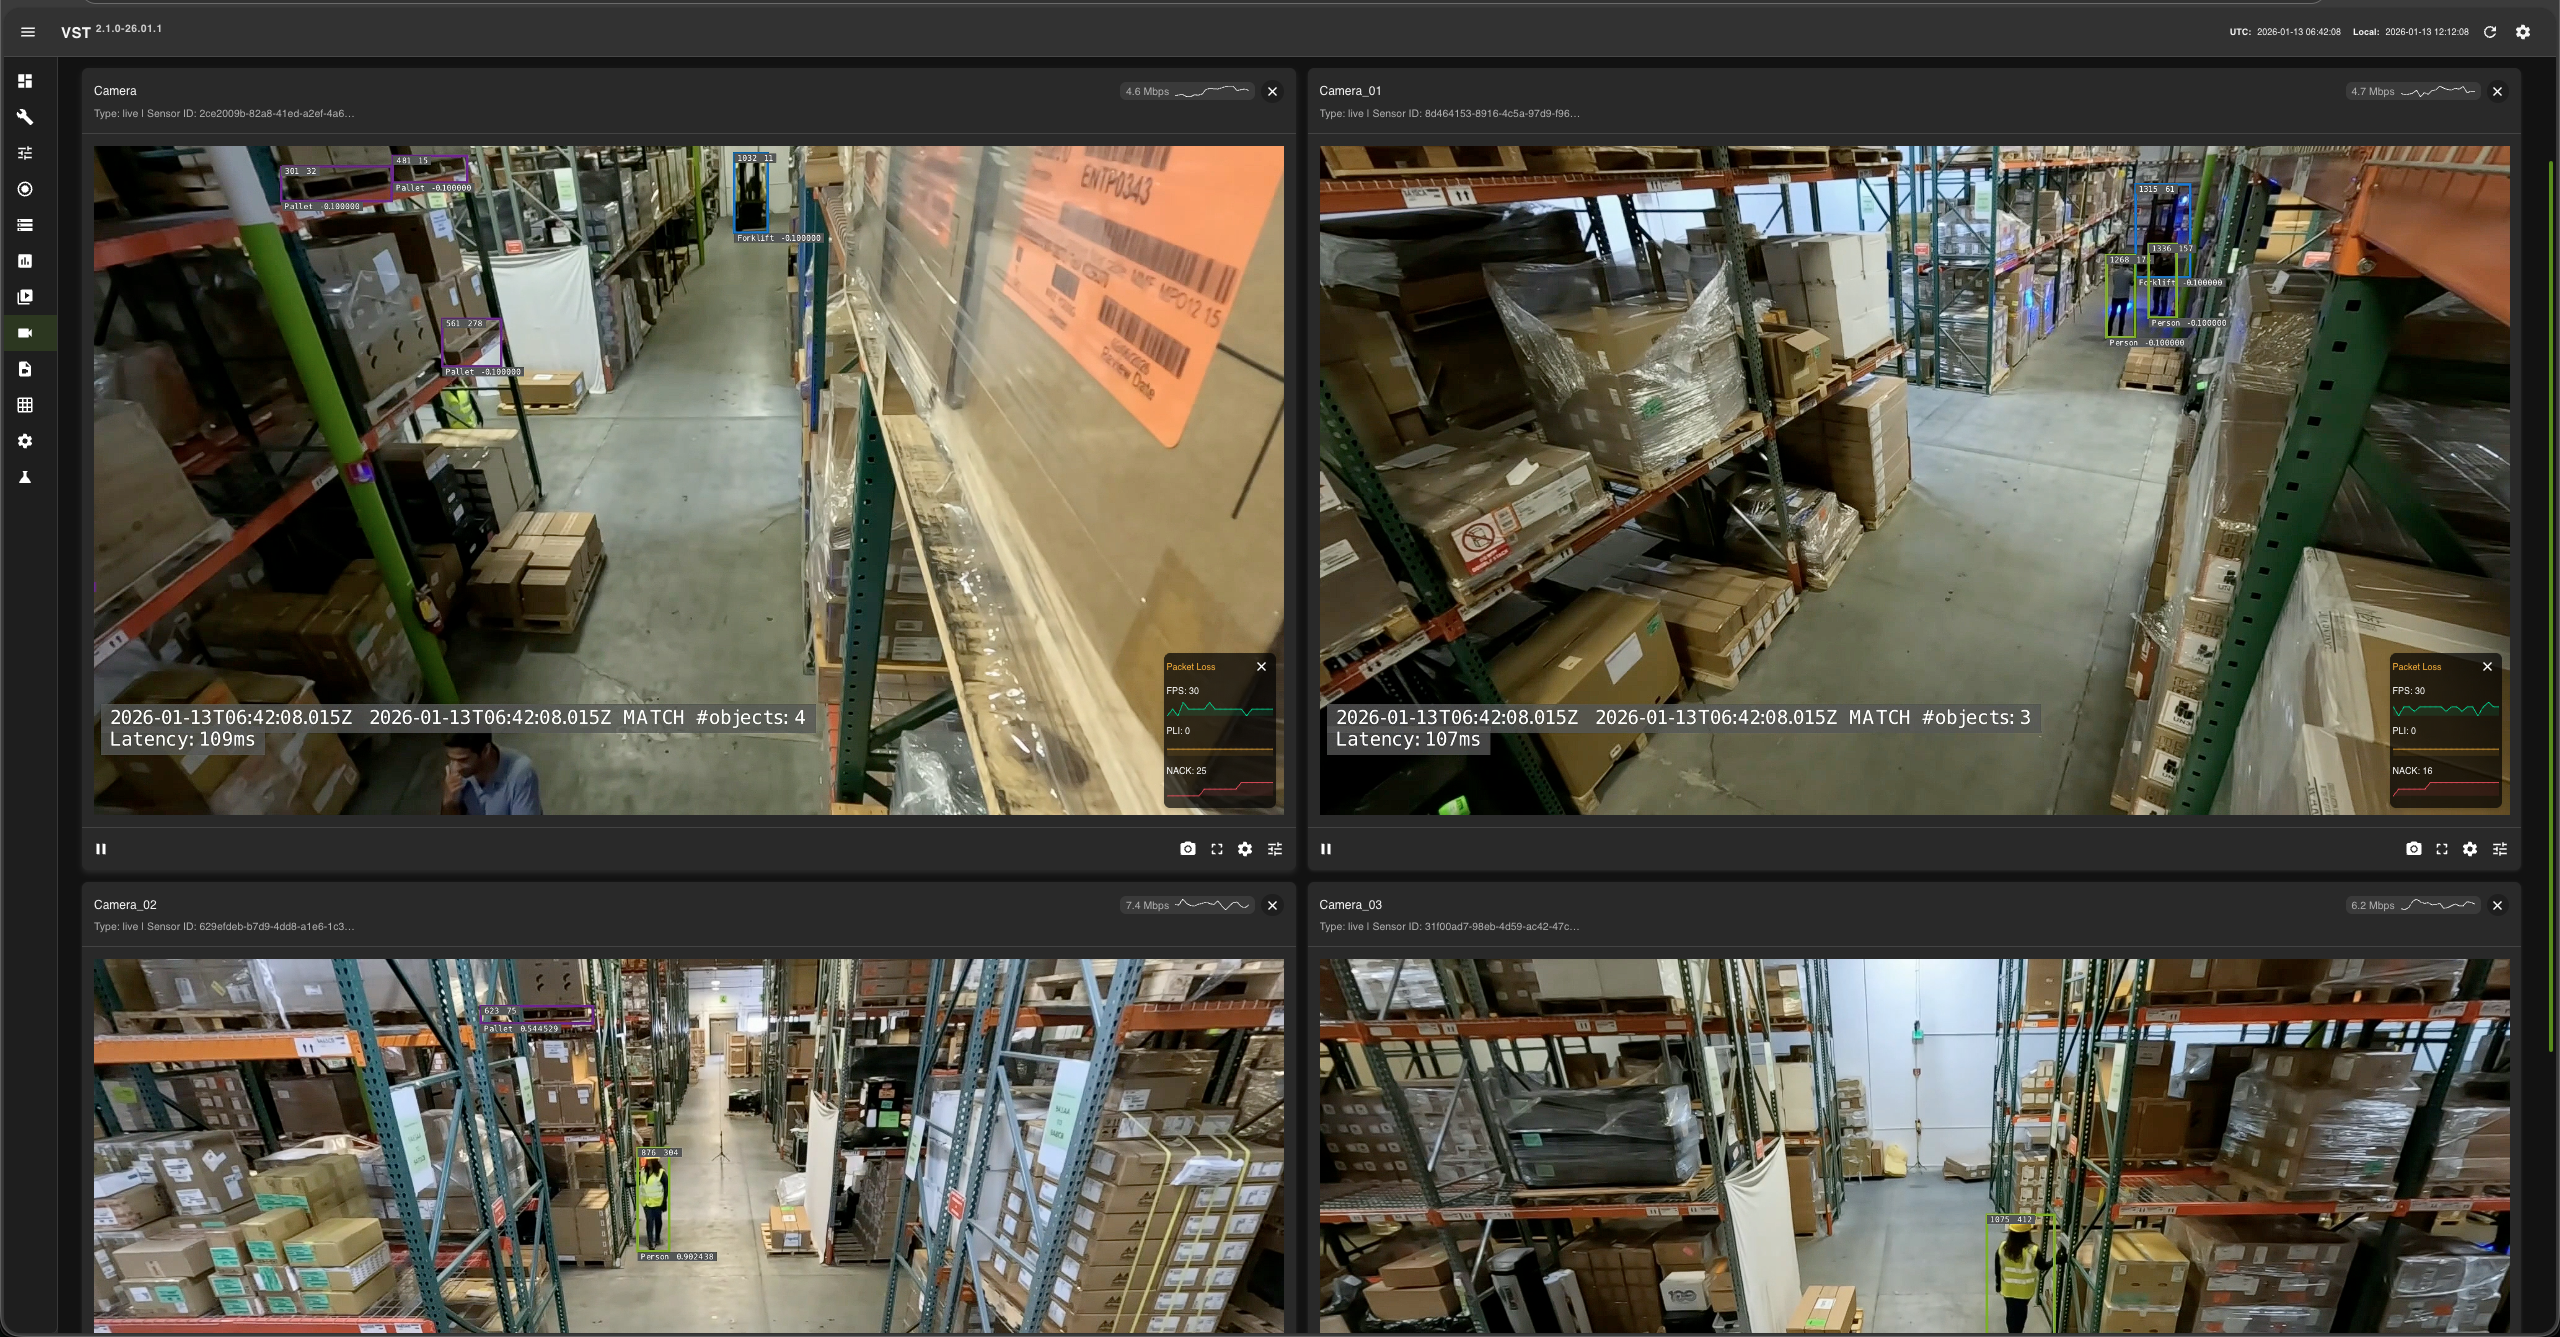
http://<IP_address>:30888/vst/
Configure and View
Reference Agentic UI#
The browser-based interface supports Chat, Alerts, and Dashboard modes. Details can be found in Reference Agentic UI.
Launch Chrome browser
In the address bar enter
http://<IP_address>:7777
Configure and View
Events and Incidents#
Events#
The 2D Vision AI with Agents Profile runs the same Behavior Analytics 2D pipeline as the 2D Vision AI Profile, processing live camera feeds, detecting and tracking objects, and generating events based on configurable logic.
Two types of events are supported:
ROI Events: Triggered when objects enter or exit a predefined region of interest (ROI).
Tripwire Events: Triggered when objects cross a predefined tripwire.
Each event type is associated with a specific logic and configuration. For more details, see Event Detection.
All event data is stored in Elasticsearch, and can be queried and visualized in Kibana, the VIOS UI, and through the agent.
Incidents#
In addition to instantaneous events, the profile detects violations in each enhanced frame and tracks them over time. When a violation persists beyond its configured threshold, it is promoted to a confirmed incident. The following incident types are generated:
Proximity Violation: Objects come too close to each other (for example, a person near moving equipment).
Restricted Area Violation: Objects enter a prohibited zone (ROI).
Confined Area Violation: Objects leave a designated safe zone.
Incident timing (threshold and expiration window) is configurable per type. For the violation-to-incident framework, configuration parameters, and enhanced-frame data, see Incident Generation.
Use Cases#
ROI events, tripwire events, and the proximity, restricted-area, and confined-area incidents provide the foundation for safety monitoring and operational intelligence in warehouse environments. With the agent, operators can query this data in natural language—surfacing ROI occupancy counts, tripwire crossings, recent violations, and incident histories—on top of the real-time situational awareness the 2D pipeline provides.
Latency Measurements#
Platform |
#Streams |
FPS |
Interval |
(NvStreamer + VIOS + DeepStream) latency |
Behavior-analytics latency |
Analytics E2E latency |
RTVI-VLM latency |
|---|---|---|---|---|---|---|---|
RTX 6000 PRO SE |
4 |
30 |
1 |
43 ms |
33 ms |
76 ms |
22.607s |
Note
The measured latencies vary with several factors, each affecting a different stage of the pipeline:
(NvStreamer + VIOS + DeepStream / RTVI-CV) latency is driven by the GPU hardware.
Behavior-analytics latency scales mainly with the number of objects in a scene and the number of configured ROIs and tripwires.
Analytics E2E latency is the sum of the above two latencies.
RTVI-VLM latency grows with the number of enabled real-time alert rules and with each rule’s parameters; see Real-Time Alerts for configuration details.
Customization#
The Blueprint supports several levels of customization:
Data Level: Add, remove, or replace cameras while maintaining the existing workflow
Model Level: Fine-tune perception models or integrate different LLM models to better suit your use cases
Application Level: Build new microservices or applications using the provided APIs and components
Microservice Level: Modify existing microservices from source code to extend functionality
Adding New Cameras or Custom Datasets#
Step 1: Prepare video sources#
Choose one of the following options to provide video sources for the 2D profile with agents:
Using recorded videos
Use this option to run the VSS with local video files instead of live camera feeds. Place your videos in the
videosdirectory under the path configured byVSS_DATA_DIRin$VSS_APPS_DIR/industry-profiles/warehouse-operations/.env.Using live RTSP streams
Use this option when you want to use live RTSP endpoints. Define each camera in
$VSS_APPS_DIR/industry-profiles/warehouse-operations/camera_configs/camera_info.jsonso the VSS Configurator can read the camera list and generate the required configuration. The following steps apply when using live RTSP streams.Create a Sensor Info File (
camera_info.json):
{
  "sensors": [
    {
      "camera_name": "camera-01",
      "rtsp_url": "rtsp://<IP_address:port>/stream1",
      "group_id": "<group_id_1>",
      "region": "<region_1>"
    },
    {
      "camera_name": "camera-02",
      "rtsp_url": "rtsp://<IP_address:port>/stream1"
    }
  ]
}
The
camera_namevalue should be unique for each camera, andrtsp_urlshould point to the camera stream. Thegroup_idandregionfields are optional and can be used to group cameras or describe their location.Required fields:
camera_name,rtsp_urlOptional fields:
group_id,regionConfigure VSS Configurator environment variables: Set the following in
$VSS_APPS_DIR/industry-profiles/warehouse-operations/.env:
SENSOR_INFO_SOURCE=file
SENSOR_FILE_PATH=<path_to_camera_info.json>
Step 2: Configure number of streams#
Configuring Number of Streams
Number of streams to be processed can be configured in two ways:
Static Configuration: Set the
NUM_STREAMSenvironment variable to specify the desired number of streams for video dataset or RTSP streams.NUM_STREAMS=4
The configured number of streams should be less than or equal to the maximum streams supported by your hardware profile and deployment mode. VSS Configurator can be used to automatically cap the stream count using the formula:
final_stream_count = min(NUM_STREAMS, max_streams_supported). For more details, refer to the How to Count Files Dynamically (Prerequisites) section in VSS Configurator Documentation.Dynamic Configuration: Use the VSS Configurator’s prerequisite operations to automatically count the number of video files in the recorded videos directory and use that count for configuration updates.
Note
Dynamic Configuration cannot be used for live RTSP streams.
Example: Automatically determine stream count from video files in the dataset directory:
# In blueprint_config.yml
commons:
  # Step 1: Count video files BEFORE variable processing
  prerequisites:
    2d:
      - operation_type: "file_management"
        target_directories:
          - "${VSS_DATA_DIR}/videos/warehouse-2d-app"
        file_management:
          action: "file_count"
          parameters:
            pattern: "*.mp4"
          output_variable: "available_video_count"  # Stores count (e.g., 6)

  # Step 2: Use the count to compute final stream count
  variables:
    2d:
      # Cap to minimum of: available videos, GPU limit
      - final_stream_count: "min(${available_video_count}, ${max_streams_supported})"

  # Step 3: Use computed variable in config file updates
  file_operations:
    2d:
      - operation_type: "text_config_update"
        target_file: "${DS_CONFIG_DIR}/ds-main-config.txt"
        updates:
          max-batch-size: ${final_stream_count}
          batch-size: ${final_stream_count}
How it works: If your dataset directory has 6 video files and the GPU supports a maximum of 4 streams, the configurator computes:
final_stream_count = min(6, 4) = 4. For more details, refer to the How to Count Files Dynamically (Prerequisites) section in VSS Configurator Documentation.
When using a custom recorded-video dataset, NUM_STREAMS depends on the number of video files available in that dataset. Make sure NUM_STREAMS is less than or equal to the number of videos you want to process.
To use a custom dataset:
Set
SAMPLE_VIDEO_DATASETin$VSS_APPS_DIR/industry-profiles/warehouse-operations/.envto the name of your dataset.Place the video files in
$VSS_DATA_DIR/videos/$SAMPLE_VIDEO_DATASET/.Add the image metadata, calibration, and floor map files under
$VSS_APPS_DIR/industry-profiles/warehouse-operations/warehouse-2d-app/calibration/sample-data/${SAMPLE_VIDEO_DATASET}. You can refer to sample datasets provided in the repository for the expected file structure and sample contents.
Note
Refer to RT-DETR Real-Time Performance for more details on the max streams supported for a particular GPU. If GPU is not found in list, then increase the streams gradually to find the optimal number of streams that can be used
Step 3: Deploy and generate new calibration#
Deploy the auto-calibration profile (bp_wh_auto_calib_2d) to generate a new calibration against live RTSP streams served by nvstreamer, using the warehouse dataset and VST stack. For steps to generate calibration, see VSS Auto Calibration quickstart. Once the calibration is generated, store it, bring the Docker Compose stack down, and update the calibration file at $VSS_APPS_DIR/industry-profiles/warehouse-operations/warehouse-2d-app/calibration/sample-data/${SAMPLE_VIDEO_DATASET}/calibration.json.
Note
Maintain a single
calibration.jsonfile per deployment.The calibration file exported from the AMC UI may include
groupandregionblocks under each entry insensors[]. These are used only by the 3D and MV3DT profiles and are not needed by the 2D profile with Agents. Remove thegroupandregionblocks from each sensor entry before importing the file.Add new camera information following the schema defined in Calibration Schema.
The
imageMetadatafile needs to be generated manually.Manually add any other attributes that are missing from the generated calibration file but are required for your use case.
Auto Calibration requires time-synchronized videos as input. For RTSP cameras, record videos from the RTSP source (e.g. using ffmpeg or similar tools), manually trim the videos to time-synchronize them if needed, then provide them to Auto Calibration.
Step 4: Redeploy the stack to apply the new calibration#
To redeploy the stack to apply the new calibration, follow the Quickstart Guide.
Model Customization#
Perception Model Fine-tuning#
The Blueprint uses RT-DETR (Real-Time Detection Transformer) as its primary perception model. RT-DETR features a ResNet-50 backbone and is pretrained on warehouse scene datasets for precise 2D object detection in industrial environments. For details, see: 2D Single Camera Detection and Tracking.
For fine-tuning the RT-DETR model via TAO Toolkit on custom datasets, refer to: RT-DETR (TAO fine-tuning).
LLM Integration#
Integrate different LLM services or locally deployed models in the agent.
Application Customization#
The Blueprint uses a modular microservices architecture with the following communication channels:
Kafka message broker
Elasticsearch database
REST APIs
Users can build their own microservices by consuming data from the above channels.
For complete API documentation, see API Reference Page.
A deployed 2D Vision AI with Agents Profile can also be driven from a coding agent (Claude Code or Codex) using Agent Skills. Skills such as vss-deploy-profile, vss-deploy-detection-tracking-2d, vss-query-analytics, vss-setup-behavior-analytics, and vss-manage-video-io-storage cover deployment, operation, and analytics queries against this profile through natural language.
Available Service Ports#
The following ports are used during deployment, and users can leverage them for any potential integration:
Service |
Port |
|---|---|
Kafka |
9092 |
Elasticsearch |
9200 |
Kibana |
7777/kibana |
NvStreamer |
31000 |
VIOS |
30888/vst |
VSS Video Analytics API |
8081 |
Reference Agentic UI |
7777 |
VSS Agent |
8000 |
Video Analytics MCP Server |
9901 |
Nemotron (LLM NIM) |
30081 |
RTVI VLM |
8018 |
Alert Bridge |
9080 |
Phoenix UI |
7777/phoenix |
Analytics Microservices Customization (Advanced)#
For detailed information about customizing specific analytics microservices, refer to:
Alert Microservices Customization (Advanced)#
For detailed information about customizing specific alert microservices, refer to:
Alerting Service — alert use cases (Near Miss, Load Quality, Pathway Obstruction, Spillover, PPE), Alert Bridge output formats, and prompt-tuning workflow.
RTVI VLM for Alert Verification and Real-Time Alerts — the two operating modes that drive RTVI VLM. Alert Verification re-evaluates upstream candidate events (
nv.Incident/nv.Behavior) with per-alert-type prompts inalert_type_config.json; Real-Time Alerts run continuous always-on rules fromrealtime-config.ymlagainst live RTSP streams.Alert Bridge — supported VLM response formats (Cosmos Reason, JSON, custom parsers) and verdict vocabulary.
Hardware Config Customization#
The 2D Warehouse Blueprint requires several configuration files to be properly tuned based on your GPU hardware and deployment requirements. When changing hardware (e.g., switching from H100 to L4 GPU) or adjusting the number of video streams, multiple configuration files must be updated to ensure optimal performance and prevent GPU overload.
Configuration Files Requiring Hardware-Based Updates#
The following table lists the configuration files that typically require updates when hardware changes:
Configuration File |
Parameters to Update |
Why Update is Needed |
|---|---|---|
|
|
Batch sizes must match stream count for optimal GPU utilization; message broker entries select between Kafka and Redis |
|
Broker connection settings |
DeepStream message broker config selected based on |
|
|
Sync file count must align with stream count |
|
|
Device limits must match GPU capacity; message broker consumer must match |
There are two approaches to customize these configuration files:
Approach 1: Manual Configuration#
Manually update all required configuration files before deploying the blueprint. This is time consuming, error prone and often not suitable for production deployments.
# Update DeepStream main config
vi <PATH_TO_DS_CONFIG_DIR>/ds-main-config.txt
# Set: num-source-bins=0, max-batch-size=<stream_count>, batch-size=<stream_count>
# Set msg-broker-config to ds-kafka-config.txt or ds-redis-config.txt depending on STREAM_TYPE

# Update DeepStream message broker config (Kafka or Redis variant, selected by STREAM_TYPE)
vi <PATH_TO_DS_CONFIG_DIR>/ds-kafka-config.txt    # for STREAM_TYPE=kafka
vi <PATH_TO_DS_CONFIG_DIR>/ds-redis-config.txt    # for STREAM_TYPE=redis

# Update NvStreamer config
vi <PATH_TO_NVSTREAMER_CONFIG_DIR>/vst-config.json
# Set: "nv_streamer_sync_file_count": <stream_count>

# Update VIOS (VST) config
vi <PATH_TO_VST_CONFIG_DIR>/vst_config.json
# Set: "onvif.max_devices_supported": <max_streams>, "data.always_recording": true,
#      "notifications.use_message_broker_consumer": "<STREAM_TYPE>"
Approach 2: Automatic Config Management using VSS Configurator#
The VSS Configurator provides a declarative approach to automatically update all required configuration files based on your hardware profile and deployment mode. This is the recommended approach for production deployments and simplifies the configuration management process.
To enable the VSS Configurator, in VSS Configurator’s environment variables you must set:
ENABLE_PROFILE_CONFIGURATOR=true
By default, the VSS Configurator is disabled (ENABLE_PROFILE_CONFIGURATOR=false).
When enabled, it runs before the Blueprint Deployment starts and adjusts configuration files based on the hardware profile and deployment mode as defined in the HARDWARE_PROFILE and MODE environment variables.
The VSS Configurator provides a comprehensive set of features for automated profile configuration management:
Feature |
Description |
|---|---|
Configuration File Updates |
Automatically update configuration files in multiple formats:
|
Environment Variable Validation |
Validate environment variables before deployment to catch configuration errors early:
|
Prerequisite Operations |
Run operations before variable processing to dynamically determine values:
|
Variable Computations |
Create computed variables for intermediate calculations and condition checking. Use case: Automatically cap stream count to GPU limits using
|
Execution Order: Prerequisite Operations → Environment Variable Validation → Variable Computations → Configuration File Updates
For detailed information on how to create custom hardware profiles and advanced configuration options, refer to the Profile Configuration Manager section in VSS Configurator Documentation.