Observe Workflows#
The NeMo Agent Toolkit uses a flexible, plugin-based observability system that provides comprehensive support for configuring logging, tracing, and metrics for workflows. Users can configure multiple telemetry exporters simultaneously from the available options or create custom integrations. The observability system:
Uses an event-driven architecture with
IntermediateStepManagerpublishing workflow events to a reactive streamSupports multiple concurrent telemetry exporters processing events asynchronously
Provides built-in exporters for popular observability platforms (LangSmith, Phoenix, Arize AX, Langfuse, Weave, etc.)
Enables custom telemetry exporter development for any observability service
These features enable developers to test their workflows locally and integrate observability seamlessly with their preferred monitoring stack.
Installation#
The core observability features (console and file logging) are included by default. For advanced telemetry features like OpenTelemetry and Phoenix tracing, you need to install the optional telemetry extras.
If you have already installed the NeMo Agent Toolkit from source, you can install package extras with the following commands, depending on whether you installed the NeMo Agent Toolkit from source or from a package.
# Install specific telemetry extras
uv pip install -e ".[data-flywheel]"
uv pip install -e ".[opentelemetry]"
uv pip install -e ".[phoenix]"
uv pip install -e ".[weave]"
# Install specific telemetry extras
uv pip install "nvidia-nat[data-flywheel]"
uv pip install "nvidia-nat[opentelemetry]"
uv pip install "nvidia-nat[phoenix]"
uv pip install "nvidia-nat[weave]"
Available Tracing Exporters#
The following table lists each exporter with its supported features and configuration guide:
Provider |
Integration Documentation |
Supported Features |
|---|---|---|
Logging, Tracing |
||
Logging, Tracing |
||
Logging, Tracing |
||
Logging, Tracing |
||
Refer to the |
Logging, Tracing |
|
Logging, Tracing, Evaluation Metrics |
||
Logging, Tracing |
||
Refer to the |
Logging, Tracing |
|
Logging, Tracing |
||
Logging, Tracing, W&B Weave Redaction, Evaluation Metrics |
Additional options:
File Export - Built-in file-based tracing for local development and debugging
Custom Exporters - Refer to Adding Telemetry Exporters for creating custom integrations
For complete configuration examples and setup instructions, check the examples/observability/ directory.
Configurable Components#
The flexible observability system is configured using the general.telemetry section in the workflow configuration file. This section contains two subsections: logging and tracing, and each subsection can contain multiple telemetry exporters running simultaneously.
For a complete list of logging and tracing plugins and corresponding configuration settings use the following CLI commands.
# For all registered logging plugins
nat info components -t logging

# For all registered tracing plugins
nat info components -t tracing
Illustrated below is a sample configuration file demonstrating multiple exporters configured to run concurrently.
general:
  telemetry:
    logging:
      console:
        _type: console
        level: WARN
      file:
        _type: file
        path: ./.tmp/workflow.log
        level: DEBUG
    tracing:
      # Multiple exporters can run simultaneously
      phoenix:
        _type: phoenix
        # ... configuration fields
      weave:
        _type: weave
        # ... configuration fields
      file_backup:
        _type: file
        # ... configuration fields
Logging Configuration#
The logging section contains one or more logging providers. Each provider has a _type and optional configuration fields. The following logging providers are supported by default:
console: Writes logs to the console.file: Writes logs to a file.
Available log levels:
DEBUG: Detailed information for debugging.INFO: General information about the workflow.WARNING: Potential issues that should be addressed.ERROR: Issues that affect the workflow from running correctly.CRITICAL: Severe issues that prevent the workflow from continuing to run.
If a log level is specified, all logs at or above that level will be logged. For example, if the log level is set to WARNING, all logs at or above that level will be logged. If the log level is set to ERROR, all logs at or above that level will be logged.
Tracing Configuration#
The tracing section contains one or more tracing providers. Each provider has a _type and optional configuration fields. The observability system supports multiple concurrent exporters.
NeMo Agent Toolkit Observability Components#
The NeMo Agent Toolkit observability system uses a generic, plugin-based architecture built on the Subject-Observer pattern. The system consists of several key components working together to provide comprehensive workflow monitoring:
Event Stream Architecture#
IntermediateStepManager: Publishes workflow events (IntermediateStepobjects) to a reactive event stream, tracking function execution boundaries, LLM calls, tool usage, and intermediate operations.Event Stream: A reactive stream that broadcasts
IntermediateStepevents to all subscribed telemetry exporters, enabling real-time observability.Asynchronous Processing: All telemetry exporters process events asynchronously in background tasks, keeping observability “off the hot path” for optimal performance.
Telemetry Exporter Types#
The system supports multiple exporter types, each optimized for different use cases:
Raw Exporters: Process
IntermediateStepevents directly for simple logging, file output, or custom event processing.Span Exporters: Convert events into spans with lifecycle management, ideal for distributed tracing and span-based observability services.
OpenTelemetry Exporters: Specialized exporters for OTLP-compatible services with pre-built integrations for popular observability platforms.
Advanced Custom Exporters: Support complex business logic, stateful processing, and enterprise reliability patterns with circuit breakers and dead letter queues.
Processing Pipeline System#
Each exporter can optionally include a processing pipeline that transforms, filters, batches, or aggregates data before export:
Processors: Modular components for data transformation, filtering, batching, and format conversion.
Pipeline Composition: Chain multiple processors together for complex data processing workflows.
Type Safety: Generic type system ensures compile-time safety for data transformations through the pipeline.
Integration Components#
nat.plugins.profiler.decorators: Decorators that wrap workflow and LLM framework context managers to inject usage-collection callbacks.callbacks: Callback handlers that track usage statistics (tokens, time, inputs/outputs) and push them to the event stream. Supports LangChain/LangGraph, LLama Index, CrewAI, Semantic Kernel, and Google ADK frameworks.
Registering a New Telemetry Provider as a Plugin#
For complete information about developing and integrating custom telemetry exporters, including detailed examples, best practices, and advanced configuration options, Refer to Adding Telemetry Exporters.
Provider Integration Guides#
NVIDIA NeMo Agent Toolkit: Observing a Workflow with Arize AX
This guide shows how to send OpenTelemetry traces from NeMo Agent Toolkit to Arize AX using the built-in arize_ax exporter (nvidia-nat[opentelemetry]). For field reference and custom OTLP endpoints, see Adding Telemetry Exporters — Arize AX.
Step 1: Arize space and API key
In the Arize AX UI, open your space and create or select a project for trace ingestion. You need the space ID and an API key with permission to send OTLP data. Official OTLP details: OpenTelemetry with Arize OTel.
Step 2: Configure the environment
export ARIZE_SPACE_ID="<your-space-id>"
export ARIZE_API_KEY="<your-api-key>"
# Optional: overrides the default in config-arize-ax.yml (${ARIZE_PROJECT_NAME:-simple_calculator})
export ARIZE_PROJECT_NAME="simple_calculator"
For EU data residency, set use_eu_region: true under general.telemetry.tracing.arize_ax in your config (see the example file below).
Step 3: Install the OpenTelemetry extra
uv pip install -e ".[opentelemetry]"
# or, from PyPI: uv pip install "nvidia-nat[opentelemetry]"
Step 4: Run the simple calculator observability example
From the root of the NeMo Agent Toolkit repository:
uv pip install -e examples/observability/simple_calculator_observability/

nat run --config_file examples/observability/simple_calculator_observability/configs/config-arize-ax.yml --input "What is 2 * 4?"
You should see a log line such as Started exporter 'arize_ax'. Open the Arize project matching ARIZE_PROJECT_NAME to view traces.
Example config:
examples/observability/simple_calculator_observability/configs/config-arize-ax.yml
Observing a Workflow with NVIDIA Data Flywheel
This guide provides a step-by-step process to enable observability in a NVIDIA NeMo Agent Toolkit workflow that exports runtime traces to an Elasticsearch instance that is part of the NVIDIA Data Flywheel Blueprint. The Data Flywheel Blueprint can then leverage the traces to fine-tune and evaluate smaller models which can be deployed to replace the original model to reduce latency.
The Data Flywheel integration supports LangChain/LangGraph-based workflows with nim and openai LLM providers and can be enabled with just a few lines of configuration.
Supported Framework and Provider Combinations
The Data Flywheel integration currently supports LangChain (as used in LangChain pipelines and LangGraphs) with the following LLM providers:
_type: openai- OpenAI provider_type: nim- NVIDIA NIM provider
The integration captures LLM_START events for completions and tool calls when using these specific combinations. Other framework and provider combinations are not currently supported.
Step 1: Prerequisites
Before using the Data Flywheel integration, ensure you have:
NVIDIA Data Flywheel Blueprint deployed and configured
Valid Elasticsearch credentials (username and password)
Step 2: Install the Data Flywheel Plugin
To install the Data Flywheel plugin, run the following:
uv pip install -e ".[data-flywheel]"
Step 3: Modify Workflow Configuration
Update your workflow configuration file to include the Data Flywheel telemetry settings:
general:
  telemetry:
    tracing:
      data_flywheel:
        _type: data_flywheel_elasticsearch
        client_id: my_nat_app
        index: flywheel
        endpoint: ${ELASTICSEARCH_ENDPOINT}
        username: elastic
        password: elastic
        batch_size: 10
This configuration enables exporting trace data to NVIDIA Data Flywheel via Elasticsearch.
Configuration Parameters
The Data Flywheel integration supports the following core configuration parameters:
Parameter |
Description |
Required |
Example |
|---|---|---|---|
|
Identifier for your application to distinguish traces between deployments |
Yes |
|
|
Elasticsearch index name where traces will be stored |
Yes |
|
|
Elasticsearch endpoint URL |
Yes |
|
|
Elasticsearch username for authentication |
No |
|
|
Elasticsearch password for authentication |
No |
|
|
Size of batch to accumulate before exporting |
No |
|
Step 4: Run Your Workflow
Run your workflow using the updated configuration file:
nat run --config_file config-data-flywheel.yml --input "Your workflow input here"
Step 5: Monitor Trace Export
As your workflow runs, traces will be automatically exported to Elasticsearch in batches. You can monitor the export process through the NeMo Agent Toolkit logs, which will show information about successful exports and any errors.
Step 6: Access Data in Data Flywheel
Once traces are exported to Elasticsearch, they become available in the NVIDIA Data Flywheel system for:
LLM distillation and optimization
Performance analysis and monitoring
Training smaller, more efficient models
Runtime optimization insights
Advanced Configuration
Workload Scoping
The Data Flywheel integration uses workload identifiers to organize traces for targeted model optimization. Understanding how to scope your workloads correctly is crucial for effective LLM distillation.
Default Scoping Behavior
By default, each trace receives a Data Flywheel workload_id that maps to the parent NeMo Agent Toolkit registered function. The combination of client_id and workload_id is used by Data Flywheel to select data as the basis for training jobs.
Custom Scoping with @track_unregistered_function
For fine-grained optimization, you can create custom workload scopes using the @track_unregistered_function decorator. This is useful when a single registered function contains multiple LLM invocations that would benefit from separate model optimizations.
from nat.plugins.profiler.decorators.function_tracking import track_unregistered_function

@track_unregistered_function(name="document_summarizer", metadata={"task_type": "summarization"})
def summarize_document(document: str) -> str:
    return llm_client.complete(f"Summarize: {document}")

@track_unregistered_function(name="question_answerer")
def answer_question(context: str, question: str) -> str:
    return llm_client.complete(f"Context: {context}\nQuestion: {question}")
The decorator supports:
name: Customworkload_id(optional, defaults to function name)metadata: Additional context for traces (optional)
Resources
For more information about NVIDIA Data Flywheel:
Observing a Workflow with Dynatrace
This guide shows how to stream OpenTelemetry (OTel) traces from your NVIDIA NeMo Agent Toolkit workflows to the OpenTelemetry Protocol (OTLP) ingest API, which in turn provides the ability to have full visibility into the performance of LLMs and agent interactions.
In this guide, you will learn how to:
Deploy a Dynatrace OpenTelemetry Collector with a configuration that exports traces into Dynatrace
Configure your workflow (YAML) or Python script to send traces to the OTel collector.
Run the workflow and view traces within Dynatrace
Step 1: Dynatrace Account
You will need access to your Dynatrace environment. If you don’t have one you can sign up to get one at https://www.dynatrace.com/signup/.
Step 2: Dynatrace API Token
Dynatrace APIs use token based authentication. To generate an access token:
Go to Access tokens.
Select Generate new token.
Enter a name for your token.
Select these required scopes for the OTLP API:
openTelemetryTrace.ingestmetrics.ingestlogs.ingest
Select Generate token.
Copy the generated token to the clipboard. Store the token in a password manager for future use and for the configuration below.
Step 3: Configure OTel Collector
Configure an OTel Collector configuration file using an otlphttp exporter to the Dynatrace OTLP API as shown in the example below. Refer to the Dynatrace documentation as required.
receivers:
  otlp:
    protocols:
      grpc:
        endpoint: 0.0.0.0:4317
      http:
        endpoint: 0.0.0.0:4318
processors:
  cumulativetodelta:
exporters:
  otlphttp:
    endpoint: "https://<YOUR-DYNATRACE-ENVIRONMENT>.live.dynatrace.com/api/v2/otlp"
    headers:
      Authorization: "Api-Token <YOUR-DYNATRACE-TOKEN>"
service:
  pipelines:
    traces:
      receivers: [otlp]
      processors: []
      exporters: [otlphttp]
    metrics:
      receivers: [otlp]
      processors: [cumulativetodelta]
      exporters: [otlphttp]
    logs:
      receivers: [otlp]
      processors: []
      exporters: [otlphttp]
Step 4: Install and run your configured OTel Collector
There are many ways to deploy an OTel Collector but for this example, an OTel Collector is created using Docker with the configuration from the previous step into a file named otelcollectorconfig.yaml with the Dynatrace distribution of the OpenTelemetry Collector.
docker run -d -v "$(pwd)"/otelcollectorconfig.yaml:/etc/otelcol/config.yaml \
-p 4318:4318 \
dynatrace/dynatrace-otel-collector:latest
Once running, the collector endpoint is: http://localhost:4318.
Step 5: Install the NeMo Agent Toolkit OpenTelemetry Subpackages
# Install specific telemetry extras required for Dynatrace
uv pip install -e ".[opentelemetry]"
Step 6: Modify NeMo Agent Toolkit Workflow Configuration
Update your workflow configuration file to include the telemetry settings.
Example configuration:
general:
  telemetry:
    tracing:
      otelcollector:
        _type: otelcollector
        # The endpoint where you have deployed the otel collector
        endpoint: http://localhost:4318/v1/traces
        project: your_project_name
Step 7: Run the workflow
From the root directory of the NeMo Agent Toolkit library, install dependencies and run the pre-configured simple_web_query example.
Example:
# Install the workflow and plugins
uv pip install -e examples/getting_started/simple_web_query

# Run the workflow with OTel+Dynatrace telemetry settings
nat run --config_file examples/getting_started/simple_web_query/configs/config.yml --input "What is LangSmith?"
As the workflow runs, telemetry data will start showing up in Dynatrace.
Step 8: View spans
View the exported traces within the Dynatrace Distributed Tracing App as shown below.
Observing a Workflow with Galileo
This guide provides a step-by-step process to enable observability in a NeMo Agent Toolkit workflow using Galileo for tracing. By the end of this guide, you will have:
Configured telemetry in your workflow.
Ability to view traces in the Galileo platform.
Step 1: Sign up for Galileo
Visit https://app.galileo.ai/ to create your account or sign in.
Step 2: Create a Project and Log Stream
After logging in:
Create a new Logging project (or reuse an existing one).
Inside the project create (or locate) the Log Stream you will write to.
Step 3: Generate API Key
Go to Settings → API Keys to generate a new API key and copy it.
You will need the following values:
Galileo-API-Keyproject(project name)logstream(log-stream name)
Step 4: Configure Your Environment
Set the following environment variables in your terminal
export GALILEO_API_KEY=<your_api_key>
Step 5: Install the OpenTelemetry Subpackage
uv pip install ".[opentelemetry]"
Step 6: Modify Workflow Configuration
Update your workflow configuration file to include the telemetry settings.
Example configuration:
general:
  telemetry:
    logging:
      console:
        _type: console
        level: WARN
    tracing:
      galileo:
        _type: galileo
        # Cloud endpoint – change if you are using an on-prem cluster.
        endpoint: https://app.galileo.ai/api/galileo/otel/traces
        project: simple_calculator
        logstream: default
        api_key: ${GALILEO_API_KEY}
Step 7: Run Your Workflow
From the root directory of the NeMo Agent Toolkit library, install dependencies and run the pre-configured simple_calculator_observability example.
Example:
# Install the workflow and plugins
uv pip install -e examples/observability/simple_calculator_observability/

# Run the workflow with Galileo telemetry settings
# Note, you may have to update configuration settings based on your Galileo account
nat run --config_file examples/observability/simple_calculator_observability/configs/config-galileo.yml --input "What is 1*2?"
As the workflow runs, telemetry data will start showing up in Galileo.
Step 8: View Traces Data in Galileo
Open your browser and navigate to https://app.galileo.ai/.
Select your project and navigate to View all logs.
Inspect function execution details, latency, total tokens, request timelines and other info within individual traces.
New traces should appear within a few seconds.
For additional help, see the Galileo OpenTelemetry integration docs.
Observing a Workflow with LangSmith
This guide provides a step-by-step process to enable observability in a NeMo Agent Toolkit workflow using LangSmith for tracing. By the end of this guide, you will have:
Configured telemetry to send OTel traces to LangSmith.
Ability to view workflow traces in the LangSmith UI.
Understanding of how evaluation and optimization results are tracked as structured experiments.
Prerequisites
An account on LangSmith is required. You can create an account at LangSmith.
Set your API key as an environment variable:
export LANGSMITH_API_KEY=<your-langsmith-api-key>
Step 1: Install the LangChain Subpackage
Install the LangChain dependencies (which include LangSmith) to enable tracing capabilities:
uv pip install -e '.[langchain]'
Step 2: Modify Workflow Configuration
Update your workflow configuration file to include the telemetry settings.
Example configuration:
general:
  telemetry:
    tracing:
      langsmith:
        _type: langsmith
        project: default
This setup enables tracing through LangSmith, with traces grouped into the default project.
The following optional fields can also be set under langsmith:
endpoint: The OTLP endpoint URL (see note below for custom deployments).workspace_id: Your LangSmith workspace ID. Falls back to theLANGSMITH_WORKSPACE_IDenvironment variable if not set, and undefined if neither is provided. This is needed if your LangSmith API key has access to multiple workspaces.resource_attributes: A dictionary of key-value pairs to attach as resource attributes on exported spans.
Note
If you are using a custom deployment of LangSmith, you will need to set the endpoint field under langsmith. The official LangSmith service at api.smith.langchain.com has routing that maps /otel/v1/traces to its OTLP ingestion API directly. Custom deployments typically don’t have this routing, so you need to specify the full path: https://<your-langsmith-endpoint>/api/v1/otel/v1/traces. For example:
general:
  telemetry:
    tracing:
      langsmith:
        _type: langsmith
        project: default
        endpoint: https://<your-langsmith-endpoint>/api/v1/otel/v1/traces
Step 3: Run Your Workflow
From the root directory of the NeMo Agent Toolkit library, install dependencies and run the pre-configured simple_calculator_observability example.
Example:
# Install the workflow and plugins
uv pip install -e examples/observability/simple_calculator_observability/
# Run the workflow with LangSmith telemetry settings
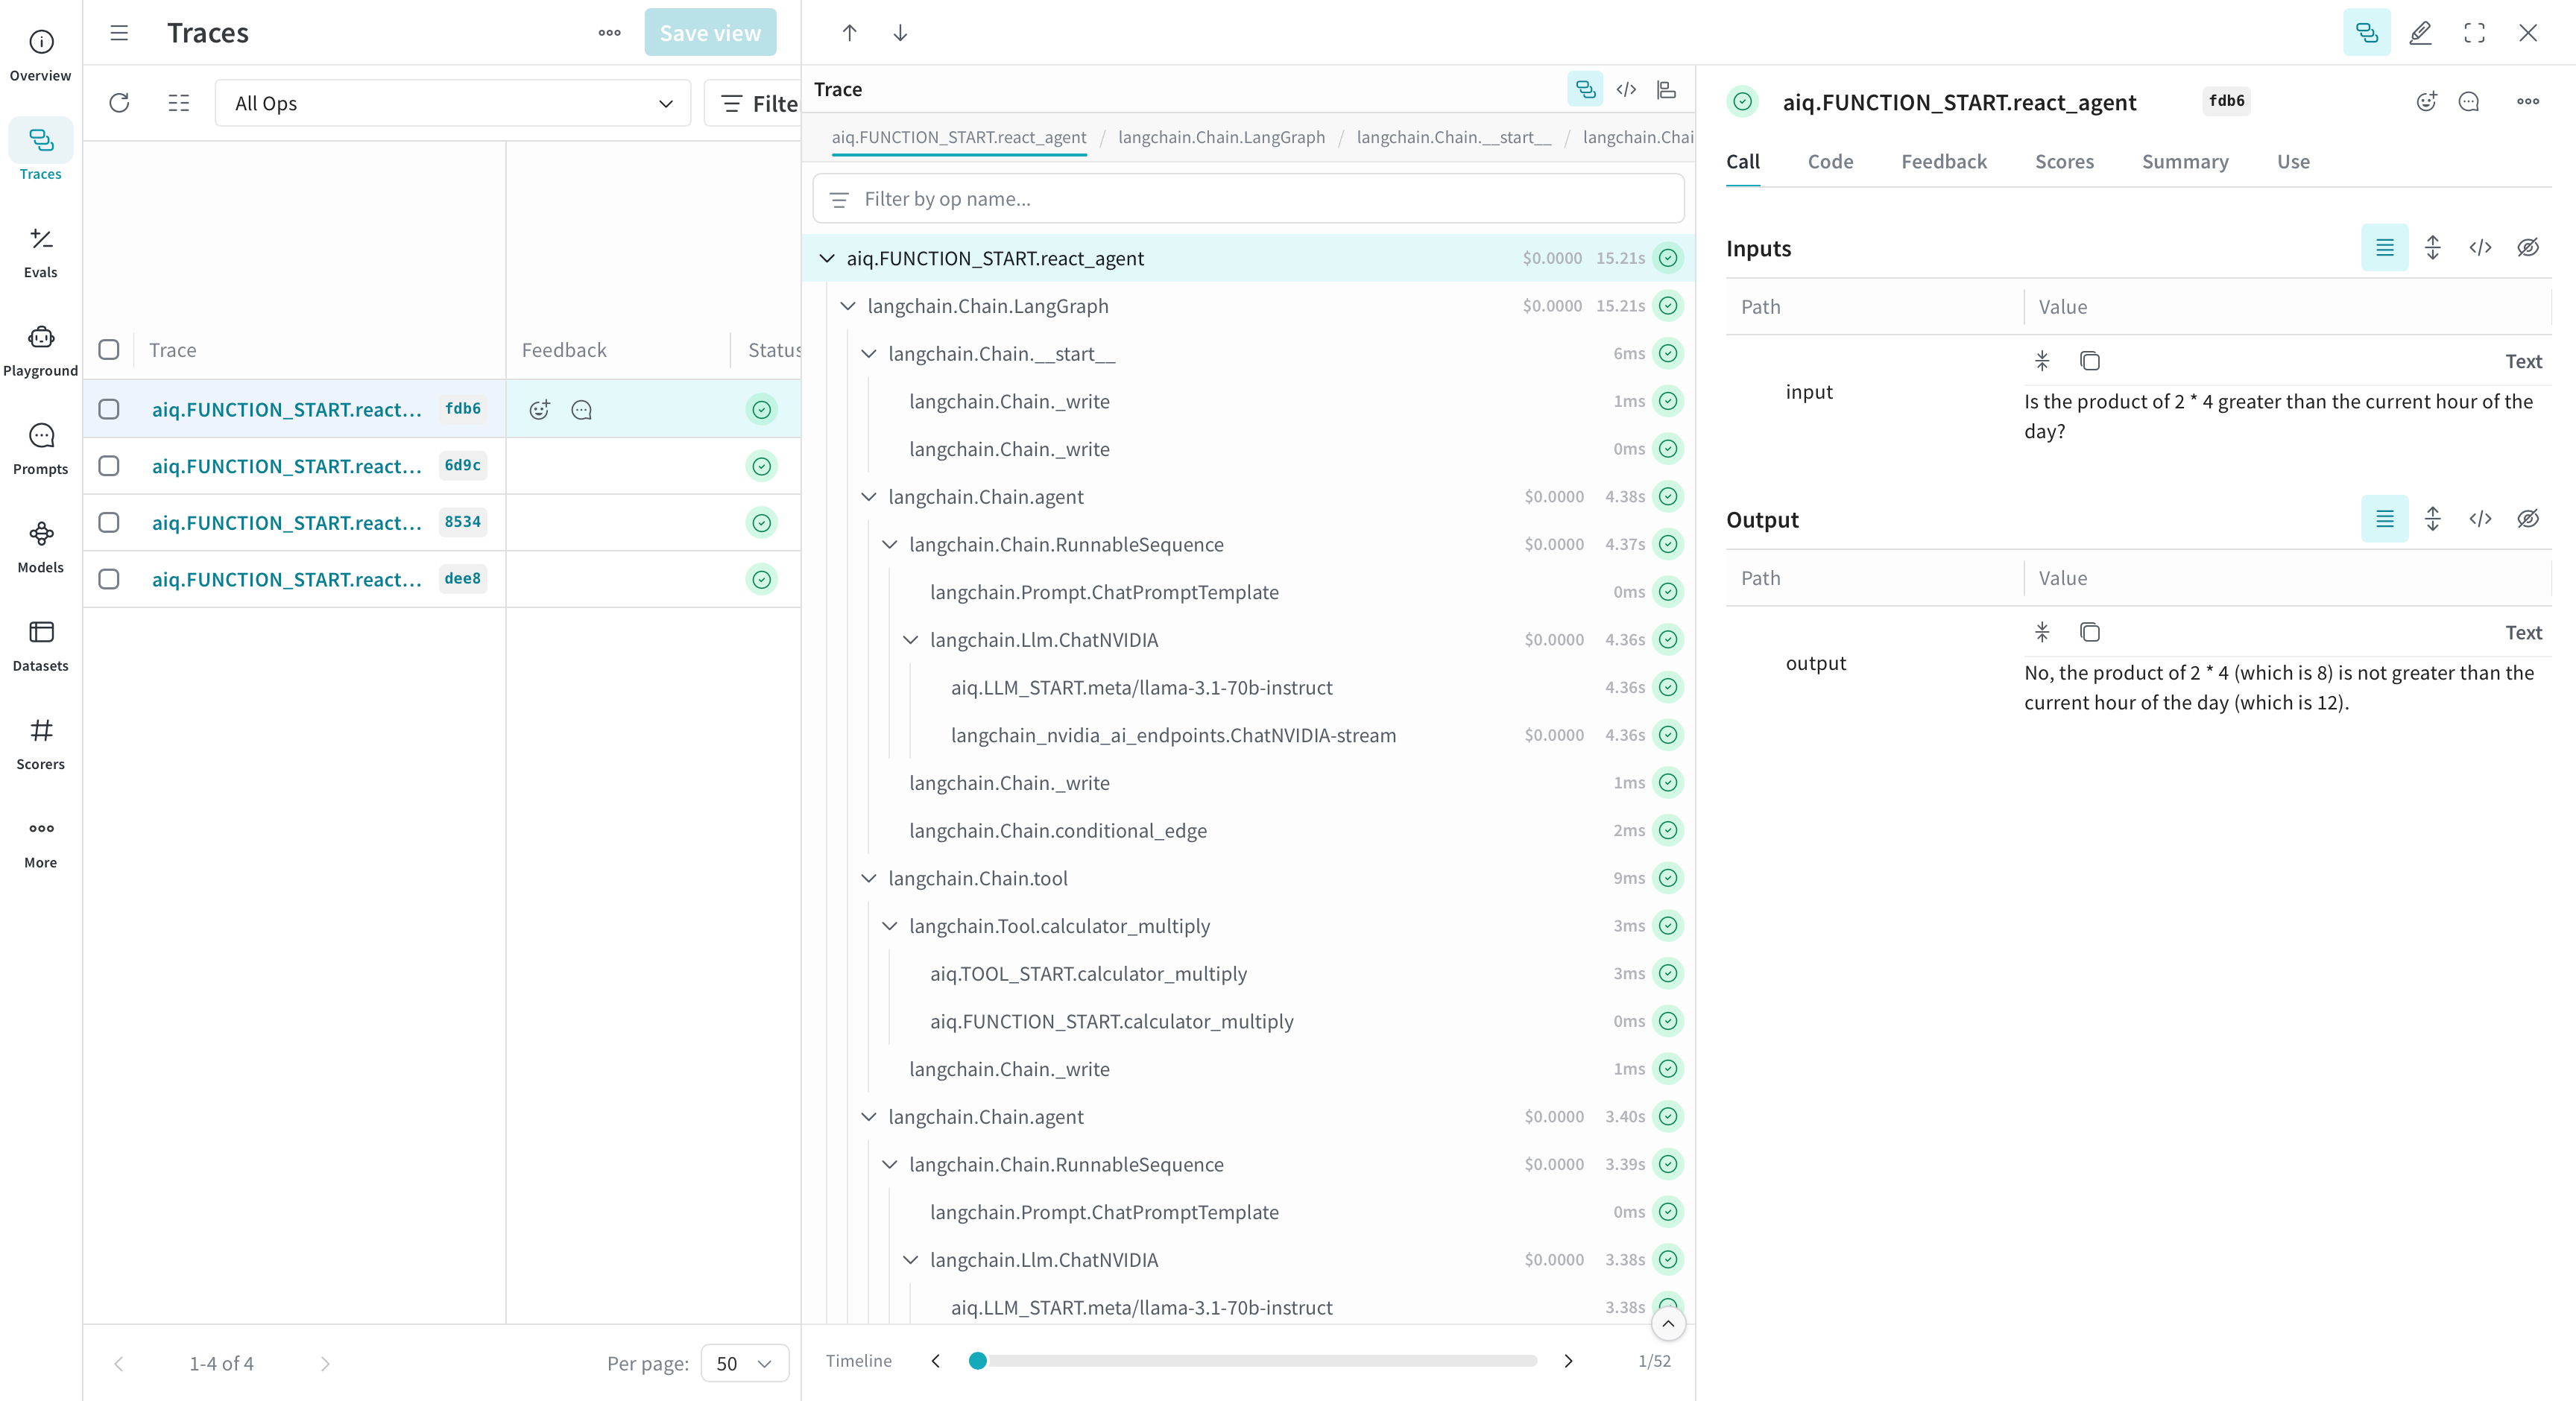
nat run --config_file examples/observability/simple_calculator_observability/configs/config-langsmith.yml --input "What is 2 * 4?"
As the workflow runs, telemetry data will start showing up in LangSmith.
To override the LangSmith project name from the command line without editing the config file, use the --override flag:
nat run --config_file examples/observability/simple_calculator_observability/configs/config-langsmith.yml \
  --override general.telemetry.tracing.langsmith.project <your_project_name> \
  --input "What is 2 * 4?"
The --override flag accepts a dot-notation path into the YAML config hierarchy followed by the new value. It can be specified multiple times to override multiple fields.
Step 4: View Traces in LangSmith
Open your browser and navigate to LangSmith.
Locate your workflow traces under your project name in the Projects section.
Inspect function execution details, latency, token counts, and other information for individual traces.
Structured Evaluation Experiments
Note
The nat eval command is provided by the evaluation package. For full config-driven eval paths, install the full eval extra:
uv pip install -e '.[eval]'
Or, for a package install:
uv pip install "nvidia-nat[eval]"
For more details, see Agent Evaluation Prerequisites.
LangSmith implements the evaluation callback pattern to create structured experiments in the LangSmith Datasets & Experiments UI. When you run nat eval with LangSmith tracing enabled, the following happens automatically:
A Dataset is created from your eval questions (named “Benchmark Dataset (<dataset-name>)”). Each dataset entry becomes a LangSmith example with inputs and expected outputs.
An Experiment project (named “<project> (Run #N)”) is linked to the dataset. Each evaluation run increments the run number.
Per-example runs are linked to their corresponding dataset examples with evaluator scores attached as feedback on each run.
OTel span traces capture each LLM call within each workflow run.
Running an Evaluation with LangSmith
Use the pre-configured evaluation example:
nat eval --config_file examples/observability/simple_calculator_observability/configs/config-langsmith-eval.yml
This configuration includes both the LangSmith telemetry settings and an evaluation section:
general:
  telemetry:
    tracing:
      langsmith:
        _type: langsmith
        project: nat-eval-demo

eval:
  general:
    max_concurrency: 1
    output_dir: .tmp/nat/examples/langsmith_eval
    dataset:
      _type: json
      file_path: examples/getting_started/simple_calculator/src/nat_simple_calculator/data/simple_calculator.json
  evaluators:
    accuracy:
      _type: tunable_rag_evaluator
      llm_name: eval_llm
      default_scoring: true
After running, check your LangSmith project for:
A dataset created from the eval questions.
Per-example runs with model answers linked to dataset examples.
Evaluator scores as feedback on each run.
OTel span traces for each LLM call.
Structured Optimization Experiments
LangSmith implements the optimization callback pattern to track each optimization trial as a separate experiment. When you run nat optimize with LangSmith tracing enabled, the following happens automatically:
A shared Dataset is created for the entire optimization run.
Each trial gets its own Experiment project (named “<base> (Run #N, Trial M)”), all linked to the shared dataset. This enables per-trial comparison in the Datasets & Experiments UI.
Parameter configurations are recorded as project metadata on each trial.
Evaluator scores are attached as feedback per trial.
For prompt optimization, prompt versions are pushed to LangSmith prompt repositories with commit tags for each trial (e.g.,
trial-1,trial-2). The best trial’s prompt is tagged withbest.
Running an Optimization with LangSmith
Use the pre-configured optimization example:
nat optimize --config_file examples/observability/simple_calculator_observability/configs/config-langsmith-optimize.yml
This configuration includes LangSmith telemetry, an evaluation section, and an optimizer section:
general:
  telemetry:
    tracing:
      langsmith:
        _type: langsmith
        project: nat-optimize-demo

eval:
  general:
    max_concurrency: 1
    output_dir: .tmp/nat/examples/langsmith_optimize
    dataset:
      _type: json
      file_path: examples/getting_started/simple_calculator/src/nat_simple_calculator/data/simple_calculator.json
  evaluators:
    accuracy:
      _type: tunable_rag_evaluator
      llm_name: eval_llm
      default_scoring: true

optimizer:
  output_path: .tmp/nat/examples/langsmith_optimize/optimizer
  reps_per_param_set: 1
  eval_metrics:
    accuracy:
      evaluator_name: accuracy
      direction: maximize
  numeric:
    enabled: true
    n_trials: 3
  prompt:
    enabled: false
After running, check your LangSmith project for:
Trial runs with parameter configurations recorded as metadata.
Feedback scores per trial for each configured metric.
OTel span traces for each LLM call within each trial.
Resources
For more information about LangSmith, view the documentation here.
Observing a Workflow with OpenTelemetry Collector
This guide shows how to stream OpenTelemetry (OTel) traces from your NeMo Agent Toolkit workflows to the generic OTel collector, which in turn provides the ability to export those traces to many different places including file stores (like S3), Datadog, Dynatrace, and others.
In this guide, you will learn how to:
Deploy the generic OTel collector with a configuration that saves traces to the local file system. The configuration can be modified to export to other systems.
Configure your workflow (YAML) or Python script to send traces to the OTel collector.
Run the workflow and view traces in the local file.
Configure and deploy the OTel Collector
Configure the OTel Collector using a
otlpreceiver and the exporter of your choice. For this example, create a file namedotelcollectorconfig.yaml:receivers: otlp: protocols: http: endpoint: 0.0.0.0:4318 processors: batch: send_batch_size: 100 timeout: 10s exporters: file: path: /otellogs/llm_spans.json format: json service: pipelines: traces: receivers: [otlp] processors: [batch] exporters: [file]
Install and run your configured OTel Collector noting the endpoint URL such as
http://localhost:4318. For this example, run the OTel Collector using Docker and the configuration file from step 1:mkdir otellogs chmod 777 otellogs docker run -v $(pwd)/otelcollectorconfig.yaml:/etc/otelcol-contrib/config.yaml \ -p 4318:4318 \ -v $(pwd)/otellogs:/otellogs/ \ otel/opentelemetry-collector-contrib:0.128.0
Install the OpenTelemetry Subpackage
If you installed the NeMo Agent Toolkit from source, you can install package extras with one of the following commands, depending on whether you installed the NeMo Agent Toolkit from source or from a package.
uv pip install -e ".[opentelemetry]"
uv pip install "nvidia-nat[opentelemetry]"
Modify Workflow Configuration
Update your workflow configuration file to include the telemetry settings.
Example configuration:
general:
  telemetry:
    tracing:
      otelcollector:
        _type: otelcollector
        # The endpoint where you have deployed the otel collector
        endpoint: http://0.0.0.0:4318/v1/traces
        project: your_project_name
Run the workflow
nat run --config_file <path/to/your/config/file.yml> --input "your notional input"
As the workflow runs, spans are sent to the OTel Collector which in turn exports them based on the exporter you configured. In this example, you can view the exported traces in the local file:
cat otellogs/llm_spans.json
Observing a Workflow with Arize Phoenix
This guide provides a step-by-step process to enable observability in a NeMo Agent Toolkit workflow using Arize Phoenix for tracing and logging. By the end of this guide, you will have:
Configured telemetry in your workflow.
Started the Phoenix server locally.
Ability to view traces in the Phoenix UI.
Step 1: Install the Phoenix Subpackage and Phoenix Server
Install the Phoenix dependencies to enable tracing capabilities with one of the following commands, depending on whether you installed the NeMo Agent Toolkit from source or from a package.
uv pip install -e ".[phoenix]"
uv pip install "nvidia-nat[phoenix]"
Step 2: Start the Phoenix Server
Run the following command to start Phoenix server locally:
docker run -it --rm -p 4317:4317 -p 6006:6006 arizephoenix/phoenix:13.22
Phoenix should now be accessible at http://0.0.0.0:6006.
Step 3: Modify Workflow Configuration
Update your workflow configuration file to include the telemetry settings.
Example configuration:
general:
  telemetry:
    tracing:
      phoenix:
        _type: phoenix
        endpoint: http://localhost:6006/v1/traces
        project: simple_calculator
        # Optional, for Phoenix servers with authentication enabled.
        # You can also set PHOENIX_API_KEY instead.
        api_key: ${PHOENIX_API_KEY}
This setup enables tracing through Phoenix at http://localhost:6006/v1/traces, with traces grouped into the simple_calculator project.
Step 4: Run Your Workflow
From the root directory of the NeMo Agent Toolkit library, install dependencies and run the pre-configured simple_calculator_observability example.
Example:
# Install the workflow and plugins
uv pip install -e examples/observability/simple_calculator_observability/

# Run the workflow with Phoenix telemetry settings
nat run --config_file examples/observability/simple_calculator_observability/configs/config-phoenix.yml --input "What is 1*2?"
As the workflow runs, telemetry data will start showing up in Phoenix.
Step 5: View Traces Data in Phoenix
Open your browser and navigate to
http://0.0.0.0:6006.Locate your workflow traces under your project name in projects.
Inspect function execution details, latency, total tokens, request timelines and other info under Info and Attributes tab of an individual trace.
Debugging
For more Arize-Phoenix details, view the documentation here.
Observing a Workflow with W&B Weave
This guide provides a step-by-step process to enable observability in a NeMo Agent Toolkit workflow using Weights and Biases (W&B) Weave for tracing using just a few lines of code in your workflow configuration file.
Prerequisites
An account on Weights & Biases is required to use Weave.
You can create an account on Weights & Biases by clicking on the “Sign Up” button in the top right corner of the website.
Under the “Account” section, you can find your API key. Click on the “Show” button to reveal the API key. Take note of this API key as you will need it to run the workflow.
export WANDB_API_KEY=<your_api_key>
Step 1: Install the Weave plugin
To install the Weave plugin, run one of the following commands, depending on whether you installed the NeMo Agent Toolkit from source or from a package.
uv pip install -e ".[weave]"
uv pip install "nvidia-nat[weave]"
Step 2: Install the Workflow
Pick an example from the list of available workflows. In this guide, we will be using the simple_calculator example.
uv pip install -e examples/observability/simple_calculator_observability
Step 3: Modify Workflow Configuration
Update your workflow configuration file to include the weave telemetry settings. For example, examples/observability/simple_calculator_observability/configs/config-weave.yml has the following weave settings:
general:
  telemetry:
    tracing:
      weave:
        _type: weave
        project: "nat-demo"
This setup enables logging trace data to W&B weave. The weave integration only requires the project parameter to be set.
Parameter |
Description |
Example |
|---|---|---|
|
The name of your W&B Weave project |
|
|
Your W&B username or team name |
|
Step 4: Run Your Workflow
Install simple_calculator example using the instructions in the examples/observability/simple_calculator_observability/README.md guide.
Run the workflow using config-weave.yml configuration file:
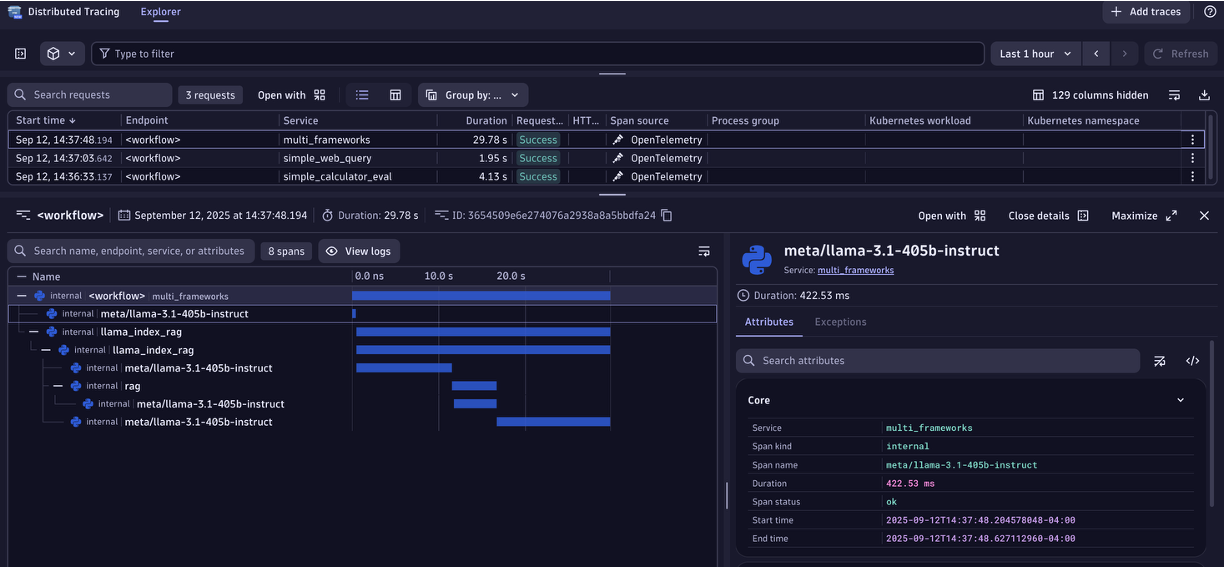
nat run --config_file examples/observability/simple_calculator_observability/configs/config-weave.yml --input "Is the product of 2 * 4 greater than the current hour of the day?"
If it is your first time running the workflow, you will be prompted to login to W&B Weave.
Step 5: View Traces Data in Weave Dashboard
As the workflow runs, you will find a Weave URL (starting with a 🍩 emoji). Click on the URL to access your logged trace timeline.
Note how the integration captures not only the nat intermediate steps but also the underlying framework. This is because Weave has integrations with many of your favorite frameworks.
Step 6: Redacting Sensitive Data
When tracing LLM workflows, you may be processing sensitive information like personal identifiers, credit card numbers, or API keys. NeMo Agent Toolkit Weave integration supports automatic redaction of Personally Identifiable Information (PII) and sensitive keys from your traces.
Prerequisites
To enable PII redaction, you need presidio-analyzer and presidio-anonymizer installed. Installing the weave plugin will install these packages for you.
Enabling PII Redaction
Update your workflow configuration to enable PII redaction:
general:
  telemetry:
    tracing:
      weave:
        _type: weave
        project: "nat-demo"
        redact_pii: true                    # Enable PII redaction
        redact_pii_fields:                  # Optional: specify which entity types to redact
          - EMAIL_ADDRESS
          - PHONE_NUMBER
          - CREDIT_CARD
          - US_SSN
          - PERSON
        redact_keys:                        # Optional: specify additional keys to redact
          - custom_secret
          - api_key
          - auth_token
Redaction Options
The Weave integration supports the following redaction options:
Parameter |
Description |
Required |
|---|---|---|
|
Enable PII redaction (true/false) |
No (default: false) |
|
List of PII entity types to redact |
No (default: all supported entities) |
|
List of additional keys to redact beyond the defaults |
No |
When redact_pii is enabled, common PII entities like email addresses, phone numbers, credit cards, and more are automatically redacted from your traces before they are sent to Weave. The redact_pii_fields parameter allows you to customize which entity types to redact.
See the Microsoft Presidio documentation for a full list of supported entity types.
Additionally, the redact_keys parameter allows you to specify custom keys that should be redacted beyond the default sensitive keys (api_key, auth_headers, authorization).
User Feedback Integration
When using Weave telemetry with the FastAPI front end, you can enable a /feedback endpoint that allows users to provide thumbs-up and thumbs-down feedback on agent responses. This feedback is linked to specific traces in your Weave project for analysis.
Enabling the Feedback Endpoint
To enable the feedback endpoint, configure your workflow to use the WeaveFastAPIPluginWorker:
general:
  front_end:
    _type: fastapi
    runner_class: nat.plugins.weave.fastapi_plugin_worker.WeaveFastAPIPluginWorker
  telemetry:
    tracing:
      weave:
        _type: weave
        project: "nat-demo"
The WeaveFastAPIPluginWorker registers the /feedback endpoint when Weave telemetry is configured. For more details on the feedback API, see the API Server Endpoints documentation.
User Attribution
To associate traces and feedback with a specific user, set one or more of the following fields on the NeMo Agent Toolkit context metadata from within your authentication callback: trace_user_name, trace_user_email, or trace_user_id. These trace_-prefixed fields are an explicit opt-in, so general identity fields set on the metadata for other purposes will not affect Weave attribution.
Any fields that are set will be written to the Weave call summary. When a user submits feedback through the /feedback endpoint, the first available value is used in priority order (trace_user_name → trace_user_email → trace_user_id), falling back to anonymous.
The following example shows how to set these fields from within an authentication callback:
from nat.runtime.context import Context

def my_auth_callback(request):
    user_info = authenticate(request)  # returns user data from your identity provider
    context = Context.get()
    context.metadata.trace_user_name = user_info.get("name")
    context.metadata.trace_user_email = user_info.get("email")
Resources
Cross-Workflow Observability#
When one workflow invokes another (for example, by calling a remote workflow over HTTP or by running a child workflow programmatically), you can link the trace of the child workflow to the parent so that observability backends show a single, connected tree instead of separate traces.
Specifying Parent When Running a Workflow Programmatically#
If you run a workflow from code using a session, pass parent_id and parent_name into session.run(). The toolkit uses these to set the root of the intermediate steps of the child workflow so the first step has the correct parent.
async with session_manager.session() as session:
    async with session.run(
        prompt,
        parent_id="parent-step-uuid",
        parent_name="Caller Workflow",
    ) as runner:
        result = await runner.result(to_type=str)
parent_id: The step ID of the parent (for example, the current workflow step or span that is invoking the child). The root workflow step of the child run is emitted with this as its parent.parent_name: Optional display name for the parent (for example, the workflow or function name). The function ancestry of the root uses this as the parent name for observability.
HTTP Headers When Triggering a Workflow#
When a workflow is triggered over HTTP (such as a POST to /generate/full), the server reads request headers to set the parent for that run. If present, they are applied before the workflow starts so the root step has the correct parent.
Header |
Description |
|---|---|
|
Step ID of the parent. The root workflow step is emitted with this as its parent. |
|
Optional display name for the parent (workflow or function name). |
Example with curl:
curl -X POST http://localhost:8000/generate/full \
  -H "workflow-parent-id: <parent-step-id>" \
  -H "workflow-parent-name: Parent Workflow Name" \
  -H "Content-Type: application/json" \
  -d '{"input_message": "..."}'
Use these headers when the caller (orchestrator, API gateway, or another workflow) has a step or span ID and wants the child workflow to appear under that step in traces.
Replaying Intermediate Steps from a Remote Workflow#
When your workflow calls a remote workflow (for example, by calling its /generate/full endpoint) and receives intermediate step data in the response, you can push those steps into the observability stream of the current run. That way, the steps of the remote workflow appear as part of the same trace tree.
Use the push_intermediate_steps() method from any code that runs inside the current workflow context. Pass the list of intermediate steps (for example, parsed from the remote response); they are injected into the event stream of the current run. The parent of the replayed root step is determined by how the remote was invoked: set workflow-parent-id and workflow-parent-name headers when calling the remote, or use session.run(parent_id=..., parent_name=...) when running a child workflow programmatically, so the trace tree links correctly.
from nat.builder.context import Context

# After calling a remote workflow (for example, /generate/full) and parsing
# the response into a list of IntermediateStep:
Context.get().intermediate_step_manager.push_intermediate_steps(remote_intermediate_steps)
This is useful when you call a remote workflow and want its steps to appear under the trace of the current workflow in your observability backend, so you get one connected tree for the full request.