DLProf Viewer User Guide
Abstract
DLProf Viewer User Guide provides instructions on how to use the DLProf Viewer to analyze performance results gathered by the NVIDIA Deep Learning Profiler.
1.1. Overview
The DLProf Viewer makes it easy to visualize the performance of your models by showing Top 10 operations that took the most time, eligibility of Tensor Core operations and Tensor Core usage, as well as interactive iteration reports.
1.2. What's New in 1.4.0
- The Iterations View is now filled with the recommended
iter_startanditer_stopvalues when launched from the Expert Systems panel on the Dashboard. - The PDF export of the Op Type Summary table now fits properly on a single page.
- A new HELP pulldown menu has been added to the navigation bar next to the VIEWER documentation link. The HELP pulldown menu includes a link to the CLI documentation.
1.3. Features
This release includes these commands and features:
- Panelized Dashboard Summary View: A summary view comprising several panels that provide a quick overview of the performance results.
- Top-level Key Metrics: The Summary view displays several key metrics that are used to quickly gauge the quality of the performance, including Average Iteration Time and Tensor Core Utilization.
- Top 10 GPU Ops Node: A table in the Summary view lists the top 10 Op Nodes with the most time spent on the GPU.
- Expert Systems Panel: This panel displays any issues detected by the DLProf Expert Systems, along with suggestions on how to address the issues and improve the models performance.
- Iteration Summary Panel: This panel visually displays iterations. Users can quickly see how many iterations are in the model, the iterations that were aggregated/profiled, and the durations of tensor core kernels in each iteration.
- Interactive Tables: All tables in detailed views are completely interactive, allowing the use to sort, filter, and paginate the display.
- Interoperable Tables: Several views have the ability to drill down for more information. Selecting a row in one table will populate the next table with performance information pertaining to the selection.
- Client/server architecture:
- All of the data is now in a relational database.
- Load times have improved for all views.
- GPUs View: Displays GPU utilization and GPU properties of all GPUs used during profiling.
2.1. Installing Using Python Wheel
The DLPROF Viewer can be easily installed from the NVIDIA PY index.
Install nvidia-pyindex.
$ pip install nvidia-pyindex
Next install the DLProf Viewer using pip:
$ pip install nvidia-dlprofviewer
2.2. Using the NGC Docker Container
The following steps are required to use pre-built NGC containers:
- Ensure you have access and are logged into NGC. For step-by-step instructions, see the NGC Getting Started Guide.
- Install Docker and nvidia-docker. For DGX users, see Preparing to use NVIDIA Containers. For users other than DGX, see nvidia-docker installation documentation.
Use docker pull to get the TensorFlow container from NGC:
$ docker pull nvcr.io/nvidia/tensorflow:xx.yy>-tf1-py3
Assuming the training data for the model is available in /full/path/to/training/data, you can launch the container with the following command:
            $ docker run --rm --gpus=1 --shm-size=1g --ulimit memlock=-1 \
--ulimit stack=67108864 -it -p8000:8000 -v/full/path/to/training/data:/data \
nvcr.io/nvidia/tensorflow:<xx.yy>-tf1-py3
2.3. Generating DLProf Database
The DLProf database is created directly from the Deep Learning Profiler. See the Deep Learning Profiler User Guide for information on how to generate the database.
2.4. Starting DLProf Viewer
The DLProf Viewer is installed in all containers that DLProf is installed in the NVIDIA GPU Cloud (NGC). The container must be run with the -p8000:8000 option to open port 8000 for the DLProf Viewer. Use any port such as 8001, 8002, etc.
            Usage: dlprofviewer [-h] [--version] [-b ADDRESS] [-p PORT] database

positional arguments:
  database              Specify path to DLProf database

optional arguments:
  -h, --help            Show this help message and exit
  --version             Show program's version number and exit
  -b ADDRESS, --bind ADDRESS
                        Specify alternate bind address. Use '0.0.0.0' to serve to the entire local network. [default: localhost]
  -p PORT, --port PORT  Specify alternate port [default: 8000]
The Viewer is launched directly from the container:
$ dlprofviewer dlprof_dldb.sqlite
Where dlprof_dldb.sqlite is the path to the DLProf database.
Bind If you want anyone on your local network to be able to access your dlprofviewer server in their browser, launch with -b 0.0.0.0:
$ dlprofviewer -b 0.0.0.0 dlprof_dldb.sqlite
Port
You can also specify a custom port with -p PORT:
$ dlprofviewer -b 0.0.0.0 -p 8001 dlprof_dldb.sqlite
Once running, the data can be viewed in a browser with the URL:
http://<machine IP Address>:8000
2.5. Backwards Compatibility
Some older versions of the DLProf database can be used as input to the latest dlprofviewer:
- A DLProf database’s initial version is the version of DLProf used to create it.
- DLProf databases v1.2+ can be used as input to DLProf CLI v1.2+
- The DLProf database version should still be less than or equal to the dlprofviewer version.
- DLProf databases v1.0 and v1.1 cannot be used as input to dlprofviewer v1.2+.
- When an older DLProf database is used as input, some minor changes will be made to it to allow it to be used correctly with the latest dlprofviewer.
- Backwards compatibility gets “reset” each major release.
- dlprofviewer v2.x will not support DLProf databases v1.y.
This section describes each of the available views in the DLProf Viewer.
3.1. Views Overview
The following information is common to all views within the DLProf Viewer.
| Term | Definition |
|---|---|
| Aggregation | The rollup of metrics, given an iteration start, iteration stop, and key node. |
| Op Node | A node in the graph where an operation is performed on the incoming tensor. |
| Model, Graph, Network | <synonyms> |
3.2. Pane Overview
The DLProf Viewer user interface is divided into three panes:
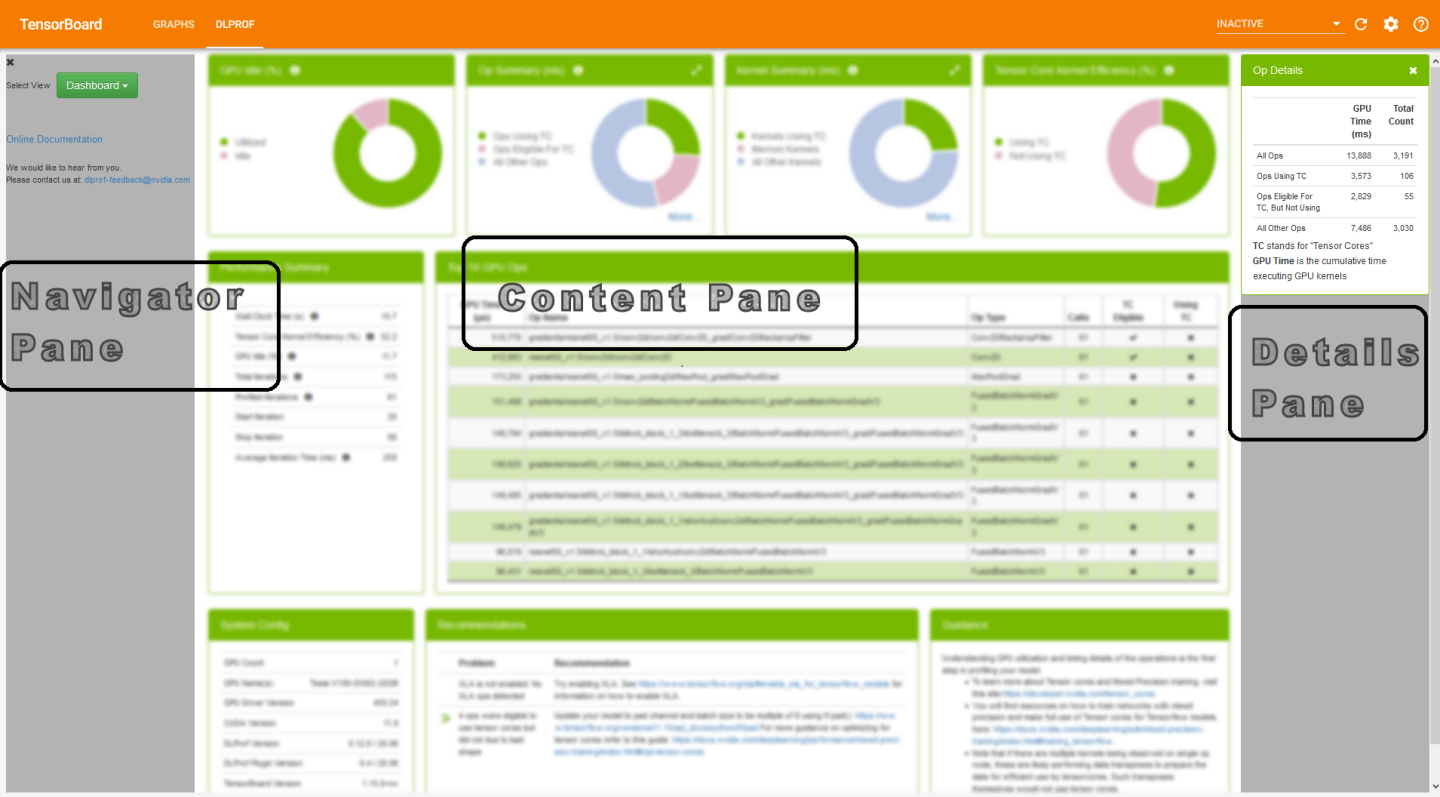
3.3. Navigation Bar
This standard navigation bar is a navigation header that is placed at the top of the viewer. It contains a few buttons like most standard web sites. It does not scroll off the screen so these buttons are always available.

| Control | Definition |
| NVIDIA DLProf Viewer button | This is the branding button. When clicked, the user is navigated to the Dashboard view. |
| Online Docs | This button navigates users to the online version of this document |
| Email Us | Let us know! If you have a comment, question, or suggestion, click this link. It will launch your default email software with the TO address already filled in. Just fill in the Subject line, type your email message, and click send. |
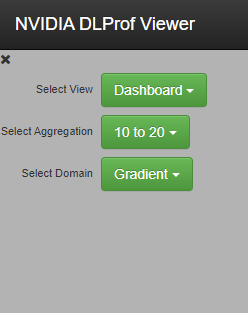
3.4. Navigation Pane
| Control | Definition |
| X | Closes the Navigation pane and widens all the other panels. |
| Select View | Clicking on the green "Select View" button provides a drop-down list of available views. Clicking on a name in the drop down list loads that view in the main display panel. Available views are: |
| Select Aggregation (optional) | This optional drop down list appears when a network has been re-aggregated (ie, aggregated more than once). An aggregation is a combination of iteration start, iteration stop, and key node. The iter stop and iter stop values are listed in the drop list as seen above. To see the corresponding key node, click the drop list and hover over each aggregation in the list. Aggregations can be created in the Iterations view. The workflow and user interface controls are documented in the view. |
| Select Domain (optional) | This optional drop down list appears when a network has been profiled using the NVIDIA Tools Extension (NVTX) plugin. See github for more details: https://github.com/NVIDIA/nvtx-plugins Each domain is profiled independently, so when a different domain is selected, all values in the entire DLProf Viewer will change. This plugin allows network programmers to isolate and profile certain areas of a network. |
3.5. Details Pane
This pane shows more details about a particular area of the system.
3.5.1. Kernel Details Panel
This panel provides key metrics about the kernels in the network aggregated over the specific iteration range.
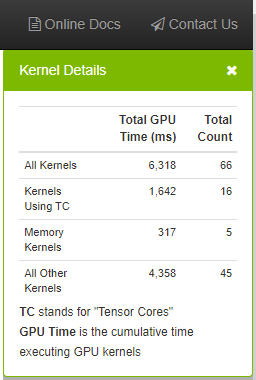
| Field | Definition |
| All Kernels | Aggregates the total GPU time and count for all kernels in the network. |
| Kernels Using TC | Aggregates the total GPU time and count for all kernels using Tensor Cores. |
| Memory Kernels | Aggregates the total GPU time and count for all memory kernels. |
| All Other Kernels | Aggregates the total GPU time and count for all remaining kernel types. |
| Control | Definition |
| X | Closes the Details Pane. |
4.1. Dashboard
The Dashboard view provides a high level summary of the performance results in a panelized view. This view serves as a starting point in analyzing the results and provides several key metrics.
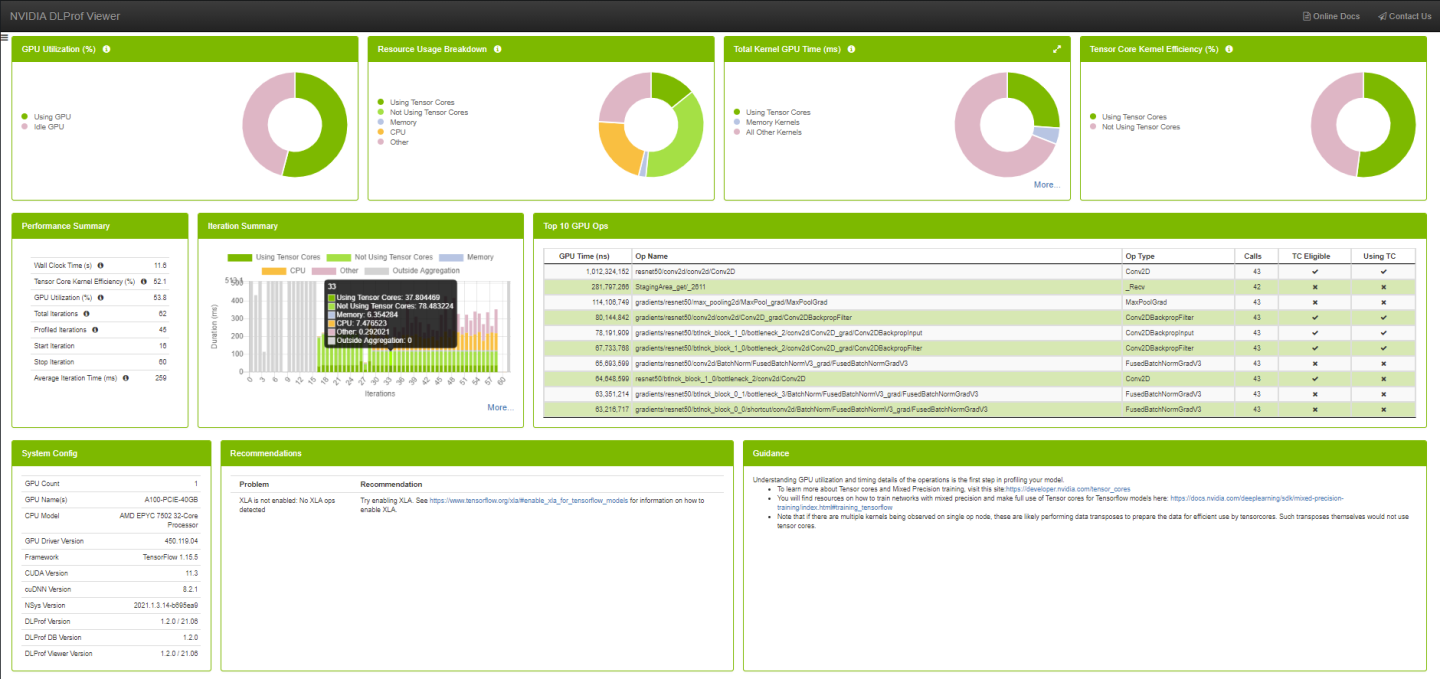
4.1.1. GPU Utilization Panel
The GPU Idle panel visually indicates the percentage of GPU utilization time during execution of aggregated iterations. Hovering over a slice in the chart will show the numeric percentage.
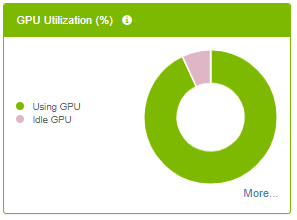
| Legend Label | Definition |
| Using GPU | The average GPU utilization percentage across all GPUs. |
| Idle GPU | The average GPU idle percentage across of all GPUs. |
| Control | Definition |
| Legend Label | Toggle between hiding and showing legend entry in chart. |
| More... | Show drop-down menu of more views (only visible when more than one GPU was used during profiling). |
4.1.2. Resource Usage Breakdown Panel
The panel provides a Breakdown of profile activity into resource categories.
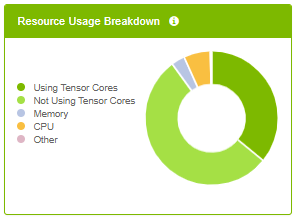
| Legend Label | Definition |
| Using Tensor Cores | Accumulated duration of all kernels using tensor cores. |
| Not Using Tensor Cores | Accumulated duration of all kernels not using tensor cores. |
| Memory | Accumulated duration of all memory operations. |
| CPU | Accumulated duration of all CPU operations. |
| Other | All time not in any of the other categories. |
| Control | Definition |
| Legend Label | Toggle between hiding and showing legend entry in chart. |
4.1.3. Total Kernel GPU Time Panel
The panel provides key metrics about the kernels in the network aggregated over the specific iteration range.
- Hovering over a slice in the chart will show the aggregated GPU time.
- Clicking a legend item will toggle its visualization in the chart.
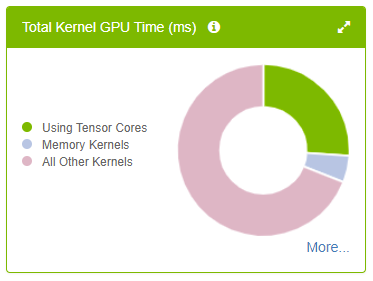
| Legend Label | Definition |
| Using Tensor Cores | Aggregates the total GPU time for all kernels using Tensor Cores. |
| Memory Kernels | Aggregates the total GPU time for all memory-related kernels. |
| All Other Kernels | Aggregates the total GPU time for all remaining kernel types. |
| Control | Definition |

|
Show Kernel Details panel in Details Pane. |
| Legend Label | Toggle between hiding and showing legend entry in chart. |
| More... | Show drop-down menu of more views. |
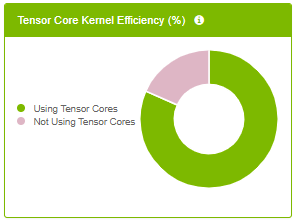
4.1.4. Tensor Core Kernel Efficiency Panel
- Hovering over a slice in the chart will show the percentage.
- Clicking a legend item will toggle its visualization in the chart.
Performance Summary Panel
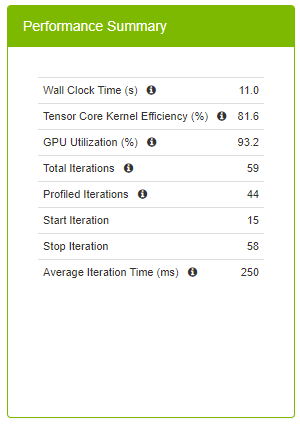
The Performance Summary panel provides top level key metrics about the performance data aggregated over the specific iteration range. A helpful tooltip text will appear when hovering over the ‘i’ icon.
| Field | Definition |
| Wall Clock Time | This is the total run time for the aggregation range, and is defined as the time between the start time of the first op in the starting iteration on the CPU and the end time of the last op in the final iteration on either the CPU or GPU, whichever timestamp is greatest. |
| Tensor Core Kernel Efficiency % | This high level metric represents the utilization of Tensor Core enabled kernels. Tensor Core operations can provide a performance improvement and should be used when possible. This metric is calculated by: [Total GPU Time for Tensor Core kernels] / [Total GPU Time for Tensor Core Eligible Ops] A 100% Tensor Core Utilization means that all eligible Ops are running only Tensor Core enabled kernels on the GPU. A 50% Tensor Core Utilization can mean anything from all eligible Ops are running Tensor Core kernels only half of the time to only half of all eligible Ops are running Tensor Core kernels only. This metric should be used with the Op Summary Panel to determine the quality of Tensor Core usage. Higher is better. |
| GPU Utilization % | Average GPU utilization across all GPUs. Higher is better. |
| Total Iterations | The total number of iterations found in the network. |
| Profiled Iterations | The total number of iterations used to aggregate the performance results. This number is calculated using ‘Start Iteration’ and ‘Stop Iteration’. |
| Start Iteration | The starting iteration number used to generate performance results. |
| Stop Iteration | The ending iteration number used to generate performance results. |
| Average Iteration Time | The average iteration time is the total Wall Time divided by the number of iterations. |
4.1.6. Iteration Summary panel
This panel visually displays iterations. Users can quickly see how many iterations are in the model, the iterations that were aggregated/profiled, and the durations of tensor core kernels in each iteration. The colors on this panel match the colors on all the other dashboard panels.

For more information on this panel, see Iterations View.
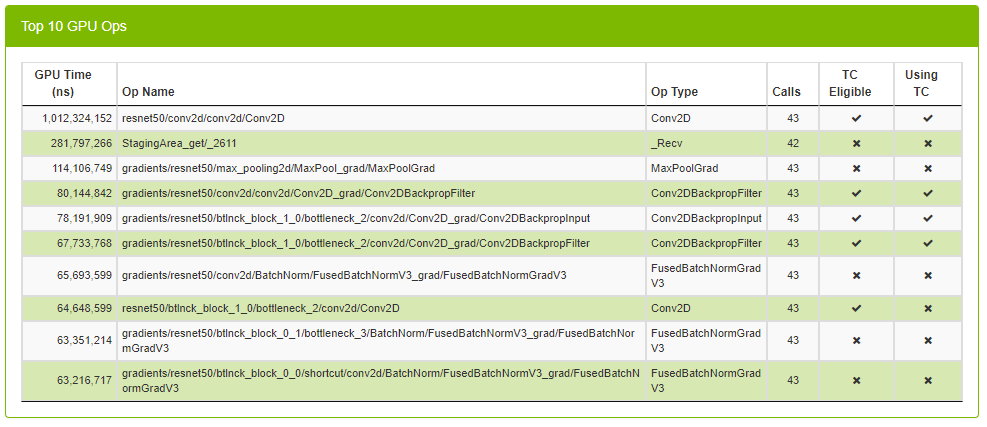
4.1.7. Top 10 GPU Ops Panel
Top 10 GPU Ops table shows the top 10 operations with the largest execution times on the GPU. This table comes pre-sorted with the order of each row in descending GPU Time. The table is not sortable or searchable.
| Column | Definition |
| GPU Time | Shows total GPU time of all kernels across all GPUs. |
| Op Name | The name of the op. |
| Direction | The fprop/bprop direction of the op. (only visible on PyTorch runs). |
| Op Type | The type of the op. |
| Calls | The number of times the op was called. |
| TC Eligible | A true/false field indicating whether or not the op is eligible to use Tensor Core kernels. |
| Using TC | A true/false field indicating whether or not one of the kernels launched in this op is using Tensor Cores. |
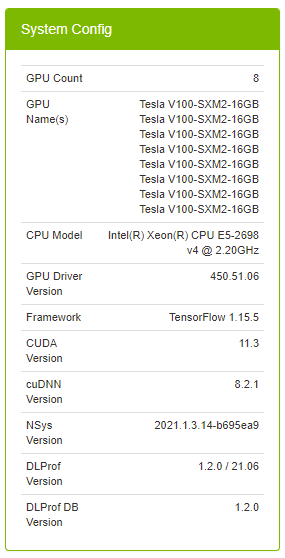
4.1.8. System Configuration Panel
| Field | Definition |
| Profile Name | (Optional) Helpful label to describe the profiled network. The value in this field corresponds to the value supplied in the --profile_name command line argument in DLProf. |
| GPU Count | The number of GPU devices found on the computer during training. |
| GPU Name(s) | A list of the GPU devices found on the computer during training. |
| CPU Model | The model of the CPU on the computer during training. |
| GPU Driver Version | The version of the driver used for NVIDIA Graphics GPU. |
| Framework | The framework used to generate profiling data (eg, TensorFlow, PyTorch). |
| CUDA Version | The version of the CUDA parallel computing platform. |
| cuDNN Version | The version of CUDA Deep Neural Network used during training. |
| NSys Version | The version of Nsight Systems used during training. |
| DLProf Version | The version of the Deep Learning Profiler used to generate the data visualized in the DLProf Viewer. |
| DLProf DB Version | The version of the DLProf database. |
| DLProf Viewer Version | The version of the DLProf Viewer. |
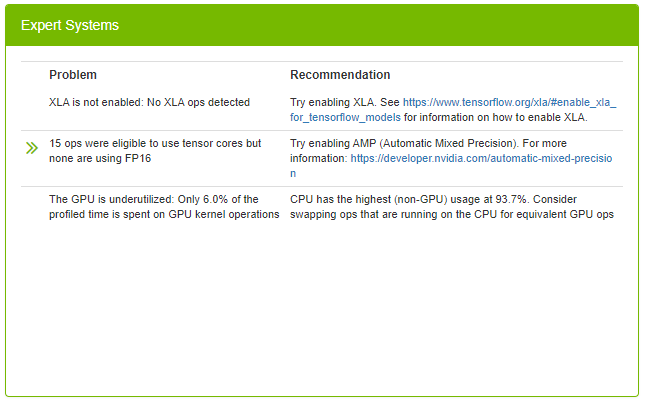
4.1.9. Expert Systems panel
The Expert Systems panel displays common issues detected in the profiled network and provides potential solutions and suggestions to address the issues. The panel will only show issues that have been detected by DLProf. For a full list of potential issues that DLProf looks for, see the Expert Systems section in the Deep Learning Profiler User Guide.
Clicking on the double-green arrows shows additional information about the detected problem.
| Column | Definition |
| Problem | The description of the scenario that DLProf detected when profiling the network. |
| >> | (Optional) When present, clicking on the double arrows will display a new view displaying the problem in detail. |
| Recommendation | A recommendation or actionable feedback, a tangible suggestion that the user can do to improve the network. Clicking on a hyperlink inside the recommendation will open a new tab in the browser. |
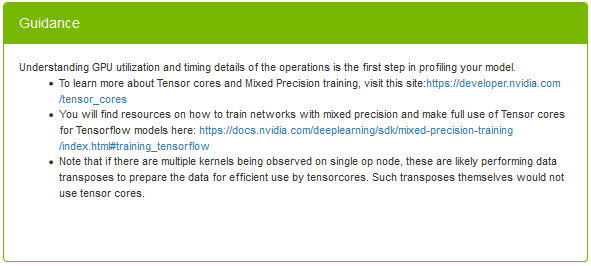
4.1.10. Guidance Panel
This panel provides static guidance to the user to help the user learn more about Tensor Cores, Mixed Precision training. The panel has hyperlinks for further reading. Clicking on a hyperlink inside the Guidance Panel will open a new tab in the browser.
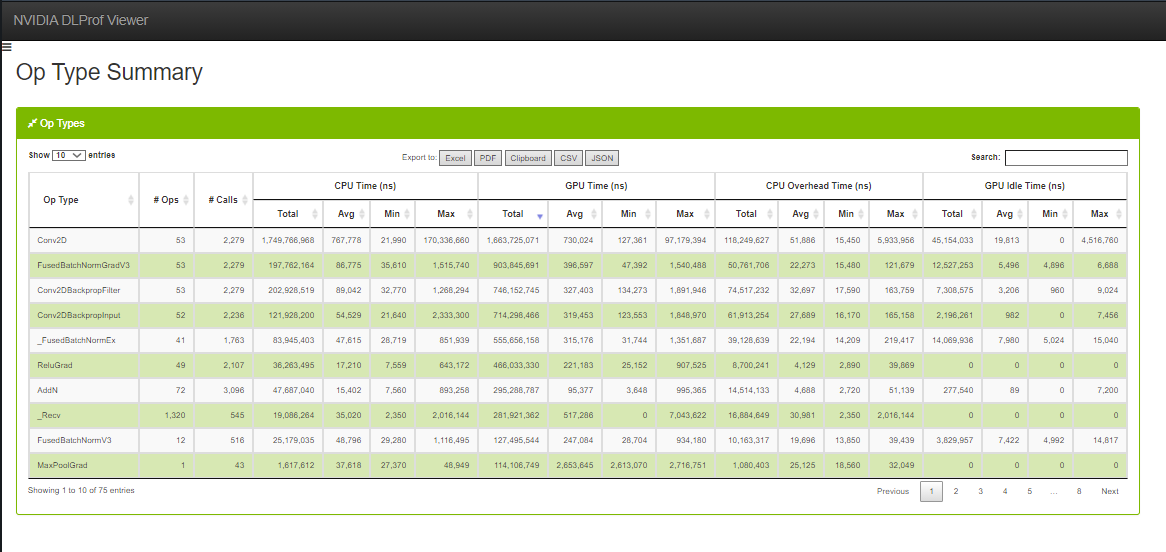
4.2. Op Type Summary
This table aggregates metrics over all op types and enables users to see the performance of all the ops in terms of its types, such as Convolutions, Matrix Multiplications, etc.
See this description for all the features available in all DataTables.
| Column name | Description |
|---|---|
| Op Type | The operation type. |
| No. Ops | The number of ops that have the Op Type above. |
| No. Calls | Number of instances that the operation was called / executed. |
| Total CPU Time (ns) | The total CPU time of all instances of this op type. |
| Avg. CPU Time (ns) | The average CPU time of all instances of this op type. |
| Min CPU Time (ns) | The minimum CPU time found amongst all instances of this op type. |
| Max CPU Time (ns) | The maximum CPU time found amongst all instances of this op type. |
| Total GPU Time (ns) | The total GPU time of all instances of this op type. |
| Avg. GPU Time (ns) | The average GPU time of all instances of this op type. |
| Min GPU Time (ns) | The minimum GPU time found amongst all instances of this op type. |
| Max GPU Time (ns) | The maximum GPU time found amongst all instances of this op type. |
| Total CPU Overhead Time (ns) | The total CPU overhead of all instances of this op type. |
| Avg. CPU Overhead Time (ns) | The average CPU overhead of all instances of this op type. |
| Min CPU Overhead Time (ns) | The minimum CPU overhead found amongst all instances of this op type. |
| Max CPU Overhead Time (ns) | The maximum CPU overhead found amongst all instances of this op type. |
| Total GPU Idle Time (ns) | The total GPU idle time of all instances of this op type. |
| Avg. GPU Idle Time (ns) | The average GPU idle time of all instances of this op type. |
| Min GPU Idle Time (ns) | The minimum GPU idle time found amongst all instances of this op type. |
| Max GPU Idle Time (ns) | The maximum GPU idle time found amongst all instances of this op type. |
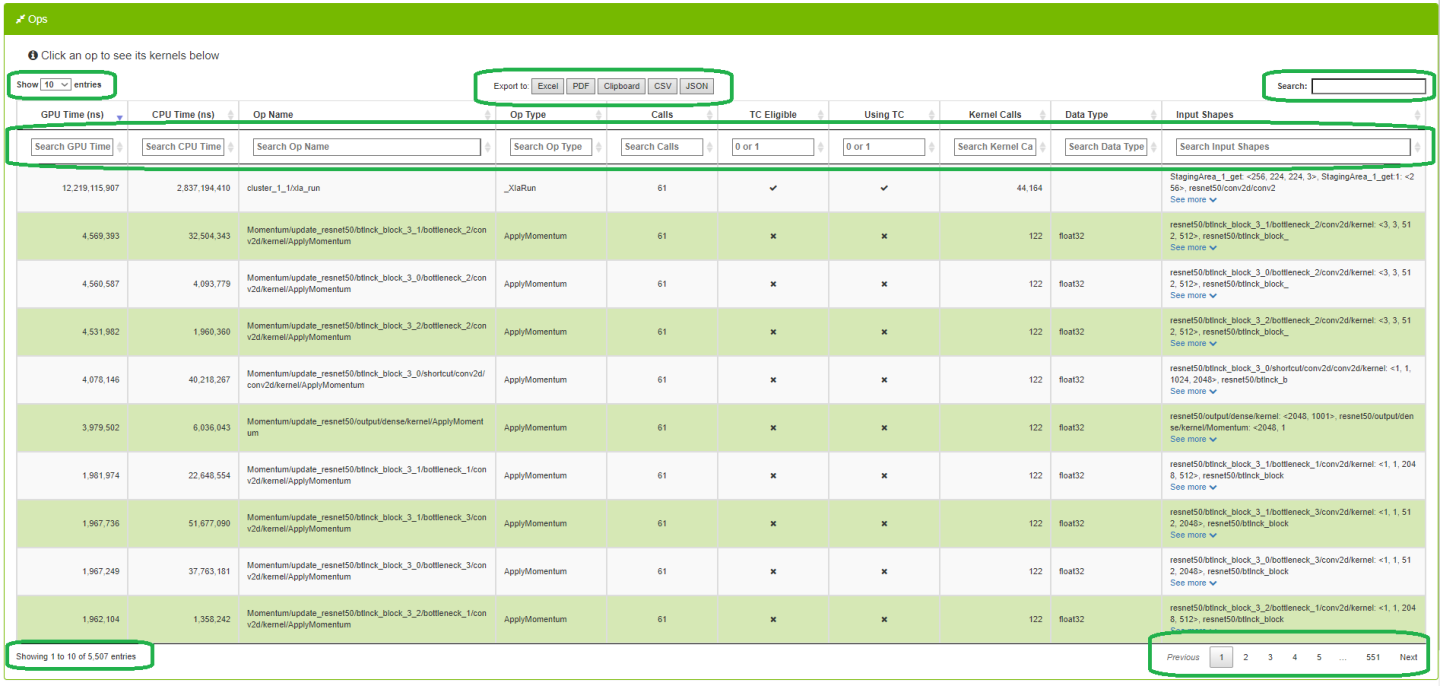
4.3. Ops and Kernels
This view enables users to view, search, sort all ops and their corresponding kernels in the entire network.
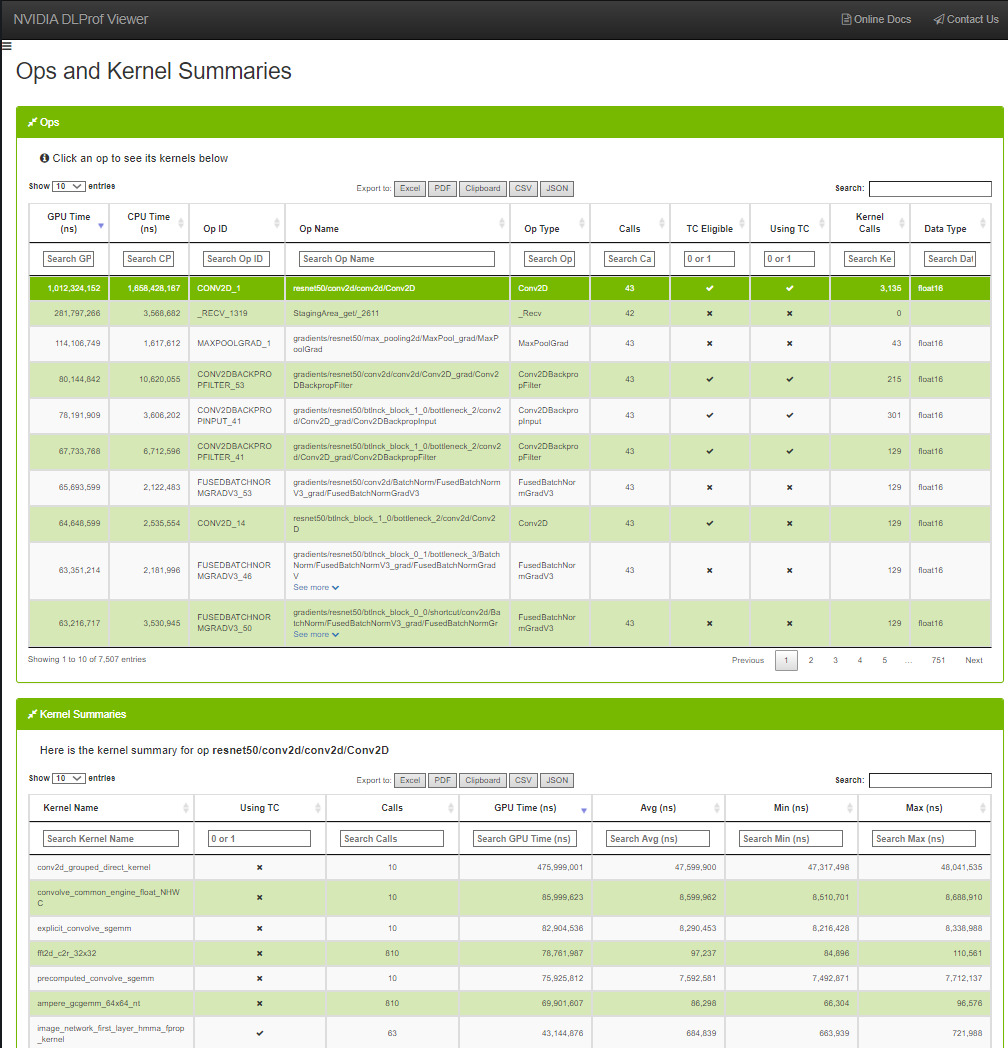
4.3.1. Ops Data Table
When a row is selected in the Ops table, a summary of each kernel for that op is displayed in the bottom table.
See this description for all the features available in all DataTables.
| Entry | Description |
|---|---|
| GPU Time (ns) | Cumulative time executing all GPU kernels launched for the op. |
| CPU Time (ns) | Cumulative time executing all op instances on the CPU. |
| Op Name | The name of the op. |
| Direction | The fprop/bprop direction of the op. (only visible on PyTorch runs). |
| Op Type | The operation of the op. |
| Calls | The number of times the op was called. |
| TC Eligible | A true/false field indicating whether or not the op is eligible to use Tensor Core kernels. To filter, type ‘1’ for true, and ‘0’ for false. |
| Using TC | A true/false field indicating whether or not one of the kernels launched in this op is using Tensor Cores. To filter, type ‘1’ for true, and ‘0’ for false. |
| Kernel Calls | The number of kernels launched in the op. |
| Data Type | The data type of this op (eg, float16, int64, int32) |
| Stack Trace | The stack trace of the op. (only visible on PyTorch runs). If the contents of this cell is more than 100 characters, a ‘See More’ hyperlink appears. When clicked, the full contents of the cell appears. When the cell is expanded, the hyperlink text is changed to ‘See Less’. When clicked, the cell collapses back to the first 100 characters. |
4.3.2. Kernel Summaries Data Table
See this description for all the features available in all DataTables.
| Entry | Description |
|---|---|
| Kernel name | The full name of the kernel. |
| Using TC | A true/false field indicating whether or not the kernel is actually using a Tensor Core. To filter, type ‘1’ for true, and ‘0’ for false. |
| Calls | The number of times this kernel was launched. |
| GPU Time (ns) | The aggregate duration of each time the kernel was launched. |
| Avg (ns) | The average duration of each time this kernel was launched. |
| Min (ns) | The minimum duration of all kernel launches. |
| Max (ns) | The maximum duration of all kernel launches. |
4.4. Kernels by Iteration
The Kernels by Iterations view shows operations and their execution time for every iteration. At a glance, you can compare iterations with respect to time as well as Kernels executed.
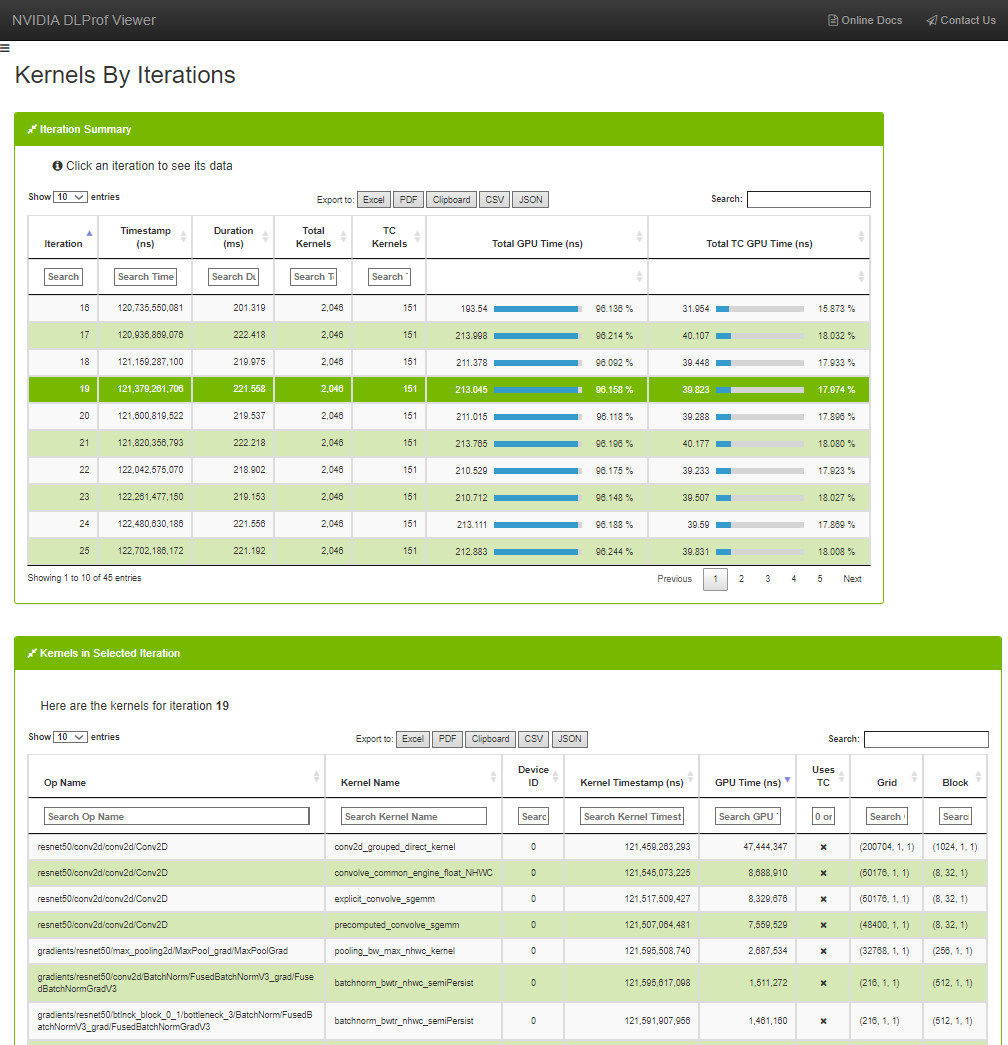
4.4.1. Iteration Summary Data Table
To see the kernels for a specific iteration, click a row in the top table. The ‘Kernels in Selected Iteration’ table will be filled with the kernels from the selection iteration.
See this description for all the features available in all DataTables.
4.4.2. Kernels in Selected Iteration
See this description for all the features available in all DataTables.
| Column | Description |
|---|---|
| Op Name | The name of the op that launched the kernel. |
| Kernel Name | The name of the kernel. |
| Device ID | the device ID of the kernel. |
| Kernel Timestamp (ns) | The timestamp for when the CUDA API call was made for this kernel in the CPU thread. Useful to see the order in which the kernels were called. |
| GPU Time (ns) | The time spent executing the kernel on the GPU. |
| Users TC | A true/false field indicating whether or not the kernel uses Tensor Cores. To filter, type ‘1’ for true, and ‘0’ for false. |
| Grid | The grid size of the kernel. |
| Block | The block size of the kernel. |
4.5. Kernels by Op
The Kernels by Op view is a variation of the Kernels by Iterations view. It has the capability to filter the list of kernels by iterations and op.
See this description for all the features available in all DataTables.
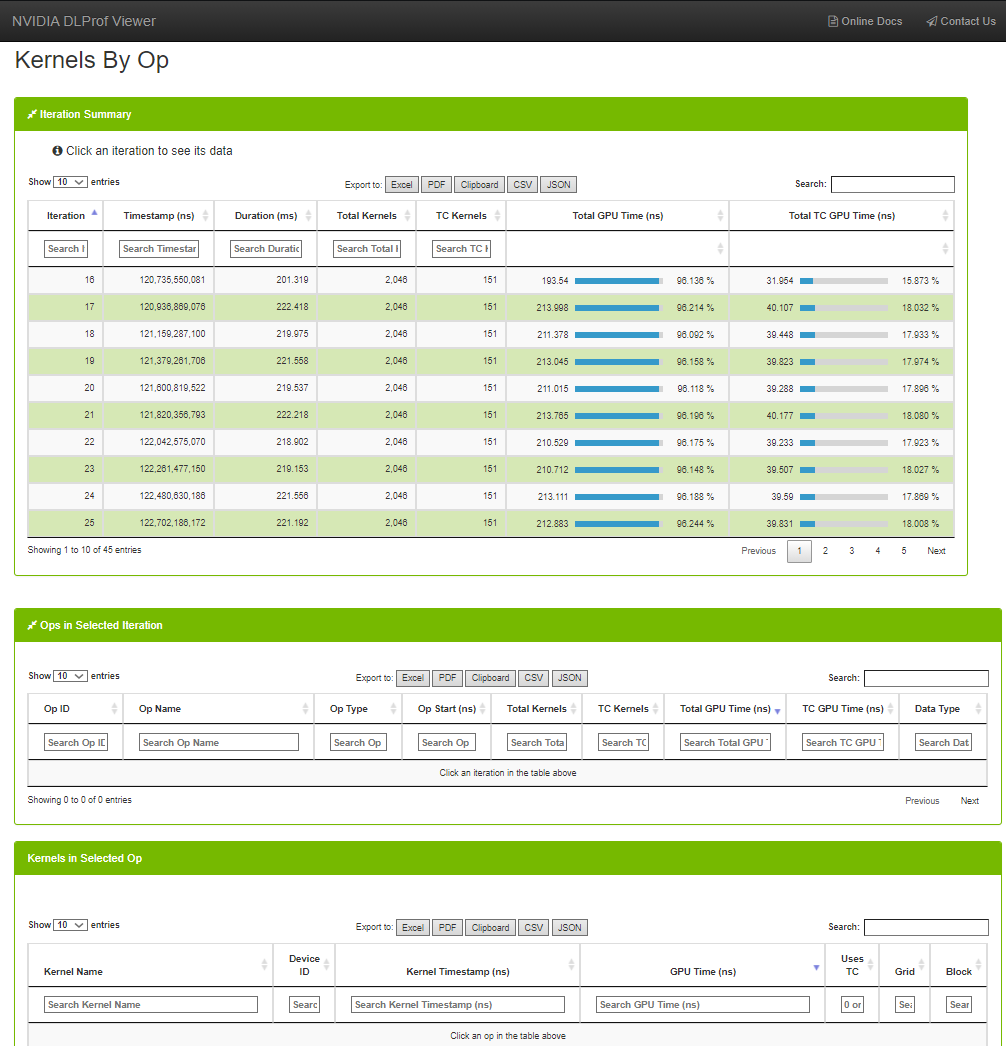
4.5.1. Iteration Summary Data Table
Selecting an iteration in the Iteration Summary table will populate the Ops in Selected Iteration table with all the profile data for the ops from the selected iteration. Selecting an op in the Ops in Selected Iteration table will populate the Kernels in Selected Op table with the list of kernels and timing data executed for the selected Op and Iteration.
See this description for all the features available in all DataTables.
4.5.2. Ops in Selected Iteration Table
Ops in Selected Iteration
See this description for all the features available in all DataTables.
| Column | Description |
|---|---|
| Op Name | The name of the op that launched the kernel. |
| Direction | The fprop/bprop direction of the op. (only visible on PyTorch runs). |
| Op Type | The type of the op. |
| Total Kernels | The number of GPU kernels called during this iteration. |
| TC Kernels | The number of GPU Tensor Core kernels called during the iteration. |
| Total GPU Time (ns) | Cumulative execution time for all kernels on the GPU during the op. |
| TC GPU Time (ns) | Cumulative execution time for all Tensor Core kernels on the GPU during the op. |
| Data Type | The data type of this op (eg, float16, int64, int32). |
| Stack Trace | The stack trace of the op. (only visible on PyTorch runs) If the contents of this cell is more than 100 characters, a ‘See More’ hyperlink appears. When clicked, the full contents of the cell appears. When the cell is expanded, the hyperlink text is changed to ‘See Less’. When clicked, the cell collapses back to the first 100 characters. |
4.5.3. Kernels Selected Iteration / Op Combination Table
Kernels in Selected Iteration / Op combination
See this description for all the features available in all DataTables.
| Column | Description |
|---|---|
| Kernel Name | The name of the kernel. |
| Device ID | The device ID of the kernel. |
| Kernel Timestamp (ns) |
The timestamp for when the CUDA API call was made for this kernel in the CPU thread. Useful to see the order in which the kernels were called. |
| GPU Time (ns) | The time spent executing the kernel on the GPU. |
| Uses TC | A true/false field indicating whether or not the kernel uses Tensor Cores. To filter, type ‘1’ for true, and ‘0’ for false. |
| Grid | The grid size of the kernel. |
| Block | The block size of the kernel. |
4.6. Iterations view
This view displays iterations visually. Users can quickly see how many iterations are in the model, the iterations that were aggregated/profiled, and the accumulated durations of tensor core kernels in each iteration.
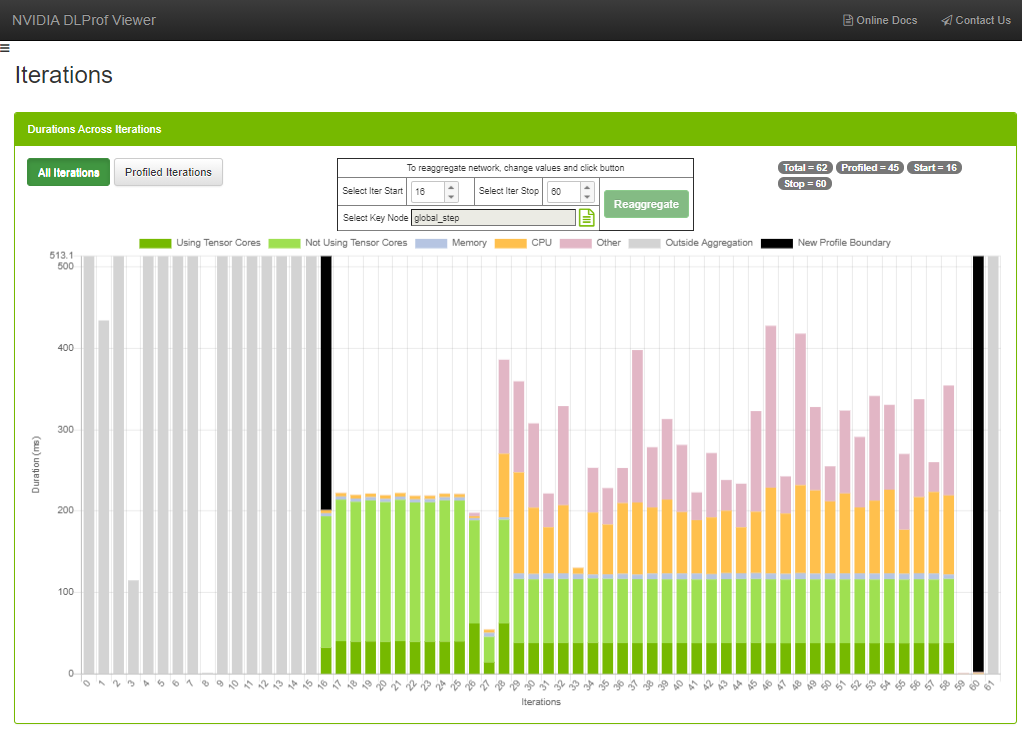
Workflow
Sometimes the original aggregation parameters on the DLProf command-line specified an iteration start value, an iteration stop value, or even key node that yielded a suboptimal representation of the network’s profile (such as including warm-up nodes). This feature allows the user to change those values and re-aggregate. Here is an example:
- Notice in the Iterations View screenshot above:
- Iteration eight contains no work, and
- Iteration nine through fifteen (among others) contain way too much work. The aggregation values throughout the viewer contain those ops and kernels and potentially skews the results.
- You can change the iteration start and iteration stop values in a number of ways: typing and clicking the up and down spinners. The best way is to hover over the field and spin the mouse wheel.
- Some platforms do not have a default key node for a neural network. Sometimes the predefined key node is suboptimal. By clicking on the ‘Select Key Node’ picker, a key node can be selected.
This is a full-featured panel that allows for filtering, sorting, and pagination to find a Key Node. See the view called Ops and Kernels for more details.
Note:
Note: There are fewer columns here than in the view, but the usability is the same.

- Once any of these three fields change, click the Reaggregate button. A confirmation dialog is displayed:

- After confirmation, a message is sent to the back-end DLProf server to reaggregate the profile with these values. This reaggregation process could potentially take minutes, so the following panel appears above all panels:

The viewer is fully functional while the re-aggregation is taking place. The “Underway!” panel will remain in view above all other views and panels until reaggregation is complete.
Note:Note: Do not click the browser’s BACK or REFRESH button. If either are accidentally, the “Underway!” panel will no longer appear. The re-aggregation will continue regardless.
- When the reaggregation is complete, a “Success!” panel will appear like this:

- At this point, clicking the REFRESH button will load all the newly reaggregated data into the viewer. If it’s not already there, the droplist called Select Aggregation is displayed in the Navigation Pane:

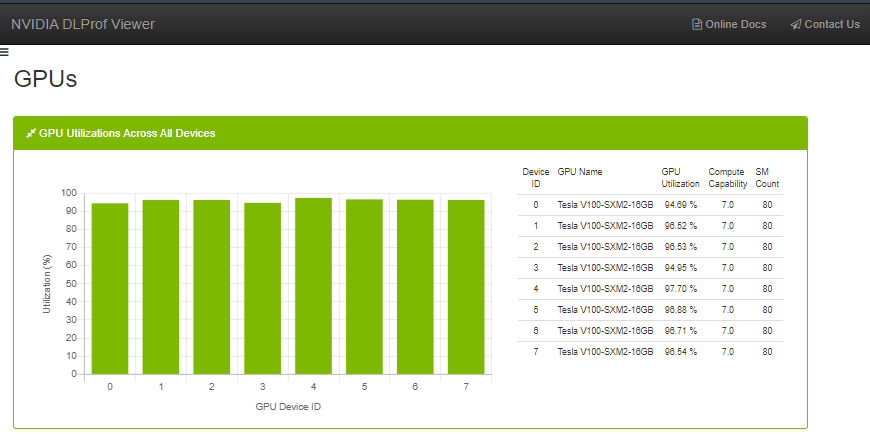
4.7. GPUs View
This view shows the utilization of all GPUs during the profile run. It is broken down into two different but related elements:
- Bar Chart - Quick visualization where you can see the GPU utilization for every GPU used during the profile. This view appears only when more than one GPU is used in a profile.
- Table - This table shows a little more detail about each GPU device, including its name, Compute Capability, and SM count.
DataTables are used in many views in the DLProf Viewer. The features in DataTables enable users to quickly find information. Below is a screenshot to see the location of the features, followed by a table describing the functionality of each feature.
| Data Table Feature | Definition |
| Showing label | The label under the table (bottom left) will show a real-time count of rows in the table. |
| Search text box | Filter results by text search. Typing in this field will display only those rows that contain the text in the box. Adding or removing text in the Search box will update the “Showing…” label. |
| Column search | Typing into the text box under most column headers will display only those rows with the entered text. This is powerful since users can enter search criteria for multiple columns to zero-in on interesting rows. Columns with ‘x’ and ‘check mark’ are boolean fields. Users can enter "1" to show those rows with a ‘check mark’, and ‘0’ to show only those rows with ‘x’. |
| Sort toggle button | Clicking on a column header will sort the table. When clicked, all rows are sorted either ascending or descending. The initial sort on most numeral columns are descending. |
| Show Entries drop list | This drop list allows the user to display 10, 25, 50, or 100 rows. Changing the setting will update the “Showing…” label. |
| Pagination buttons | Previous, next, and page# navigation. Allows users to quickly page through large data sets. Uses ‘Show Entries’ setting and updates the “Showing…” label. |
| Export to buttons | Allows users to easily export the data in the datatable to well known formats. An optional profile name is displayed in the header of all exports when the Warning: A slight delay occurs when any of these buttons are clicked on large networks. Enable pop-ups in your browser to export to PDF. |


Notice
This document is provided for information purposes only and shall not be regarded as a warranty of a certain functionality, condition, or quality of a product. NVIDIA Corporation (“NVIDIA”) makes no representations or warranties, expressed or implied, as to the accuracy or completeness of the information contained in this document and assumes no responsibility for any errors contained herein. NVIDIA shall have no liability for the consequences or use of such information or for any infringement of patents or other rights of third parties that may result from its use. This document is not a commitment to develop, release, or deliver any Material (defined below), code, or functionality.
NVIDIA reserves the right to make corrections, modifications, enhancements, improvements, and any other changes to this document, at any time without notice.
Customer should obtain the latest relevant information before placing orders and should verify that such information is current and complete.
NVIDIA products are sold subject to the NVIDIA standard terms and conditions of sale supplied at the time of order acknowledgement, unless otherwise agreed in an individual sales agreement signed by authorized representatives of NVIDIA and customer (“Terms of Sale”). NVIDIA hereby expressly objects to applying any customer general terms and conditions with regards to the purchase of the NVIDIA product referenced in this document. No contractual obligations are formed either directly or indirectly by this document.
NVIDIA products are not designed, authorized, or warranted to be suitable for use in medical, military, aircraft, space, or life support equipment, nor in applications where failure or malfunction of the NVIDIA product can reasonably be expected to result in personal injury, death, or property or environmental damage. NVIDIA accepts no liability for inclusion and/or use of NVIDIA products in such equipment or applications and therefore such inclusion and/or use is at customer’s own risk.
NVIDIA makes no representation or warranty that products based on this document will be suitable for any specified use. Testing of all parameters of each product is not necessarily performed by NVIDIA. It is customer’s sole responsibility to evaluate and determine the applicability of any information contained in this document, ensure the product is suitable and fit for the application planned by customer, and perform the necessary testing for the application in order to avoid a default of the application or the product. Weaknesses in customer’s product designs may affect the quality and reliability of the NVIDIA product and may result in additional or different conditions and/or requirements beyond those contained in this document. NVIDIA accepts no liability related to any default, damage, costs, or problem which may be based on or attributable to: (i) the use of the NVIDIA product in any manner that is contrary to this document or (ii) customer product designs.
No license, either expressed or implied, is granted under any NVIDIA patent right, copyright, or other NVIDIA intellectual property right under this document. Information published by NVIDIA regarding third-party products or services does not constitute a license from NVIDIA to use such products or services or a warranty or endorsement thereof. Use of such information may require a license from a third party under the patents or other intellectual property rights of the third party, or a license from NVIDIA under the patents or other intellectual property rights of NVIDIA.
Reproduction of information in this document is permissible only if approved in advance by NVIDIA in writing, reproduced without alteration and in full compliance with all applicable export laws and regulations, and accompanied by all associated conditions, limitations, and notices.
THIS DOCUMENT AND ALL NVIDIA DESIGN SPECIFICATIONS, REFERENCE BOARDS, FILES, DRAWINGS, DIAGNOSTICS, LISTS, AND OTHER DOCUMENTS (TOGETHER AND SEPARATELY, “MATERIALS”) ARE BEING PROVIDED “AS IS.” NVIDIA MAKES NO WARRANTIES, EXPRESSED, IMPLIED, STATUTORY, OR OTHERWISE WITH RESPECT TO THE MATERIALS, AND EXPRESSLY DISCLAIMS ALL IMPLIED WARRANTIES OF NONINFRINGEMENT, MERCHANTABILITY, AND FITNESS FOR A PARTICULAR PURPOSE. TO THE EXTENT NOT PROHIBITED BY LAW, IN NO EVENT WILL NVIDIA BE LIABLE FOR ANY DAMAGES, INCLUDING WITHOUT LIMITATION ANY DIRECT, INDIRECT, SPECIAL, INCIDENTAL, PUNITIVE, OR CONSEQUENTIAL DAMAGES, HOWEVER CAUSED AND REGARDLESS OF THE THEORY OF LIABILITY, ARISING OUT OF ANY USE OF THIS DOCUMENT, EVEN IF NVIDIA HAS BEEN ADVISED OF THE POSSIBILITY OF SUCH DAMAGES. Notwithstanding any damages that customer might incur for any reason whatsoever, NVIDIA’s aggregate and cumulative liability towards customer for the products described herein shall be limited in accordance with the Terms of Sale for the product.
HDMI
HDMI, the HDMI logo, and High-Definition Multimedia Interface are trademarks or registered trademarks of HDMI Licensing LLC.
OpenCL
OpenCL is a trademark of Apple Inc. used under license to the Khronos Group Inc.
Trademarks
NVIDIA, the NVIDIA logo, and cuBLAS, CUDA, cuDNN, DALI, DIGITS, DGX, DGX-1, DGX-2, DGX Station, DLProf, Jetson, Kepler, Maxwell, NCCL, Nsight Compute, Nsight Systems, NvCaffe, NVIDIA Ampere GPU Architecture, PerfWorks, Pascal, SDK Manager, Tegra, TensorRT, Triton Inference Server, Tesla, TF-TRT, and Volta are trademarks and/or registered trademarks of NVIDIA Corporation in the U.S. and other countries. Other company and product names may be trademarks of the respective companies with which they are associated.