


Monitoring GPU Performance#
NVIDIA vGPU software enables you to monitor the performance of physical GPUs and virtual GPUs from the hypervisor and from within individual guest VMs.
You can use several tools for monitoring GPU performance:
From any supported hypervisor, and from a guest VM that is running a 64-bit edition of Windows or Linux, you can use NVIDIA System Management Interface,
nvidia-smi.From XenServer, you can use Citrix XenCenter.
From a Windows guest VM, you can use these tools:
Windows Performance Monitor
Windows Management Instrumentation (WMI)
NVIDIA System Management Interface nvidia-smi#
NVIDIA System Management Interface, nvidia-smi, is a command-line tool that reports management information for NVIDIA GPUs.
The nvidia-smi tool is included in the following packages:
NVIDIA Virtual GPU Manager package for each supported hypervisor
NVIDIA driver package for each supported guest OS
The scope of the reported management information depends on where you run nvidia-smi from:
From a hypervisor command shell, such as the XenServer dom0 shell or VMware ESXi host shell,
nvidia-smireports management information for NVIDIA physical GPUs and virtual GPUs present in the system.Note
When run from a hypervisor command shell,
nvidia-smiwill not list any GPU that is currently allocated for GPU pass-through.From a guest VM,
nvidia-smiretrieves usage statistics for vGPUs or pass-through GPUs that are assigned to the VM.In a Windows guest VM,
nvidia-smiis installed in a folder that is in the default executable path. Therefore, you can runnvidia-smifrom a command prompt from any folder by running thenvidia-smi.execommand.
Monitoring GPU Performance from a Hypervisor#
You can monitor GPU performance from any supported hypervisor by using the NVIDIA System Management Interface nvidia-smi command-line utility. On XenServer platforms, you can also use Citrix XenCenter to monitor GPU performance.
Note
You cannot monitor from the hypervisor the performance of GPUs that are being used for GPU pass-through. You can monitor the performance of pass-through GPUs only from within the guest VM that is using them.
Using nvidia-smi to Monitor GPU Performance from a Hypervisor#
You can get management information for the NVIDIA physical GPUs and virtual GPUs present in the system by running nvidia-smi from a hypervisor command shell such as the XenServer dom0 shell or the VMware ESXi host shell.
Without a subcommand, nvidia-smi provides management information for physical GPUs. To examine virtual GPUs in more detail, use nvidia-smi with the vgpu subcommand.
From the command line, you can get help information about the nvidia-smi tool and the vgpu subcommand.
Help Information |
Command |
|---|---|
A list of subcommands supported by the |
|
A list of all options supported by the |
|
Getting a Summary of all Physical GPUs in the System#
To get a summary of all physical GPUs in the system, along with PCI bus IDs, power state, temperature, current memory usage, and so on, run nvidia-smi without additional arguments.
Each vGPU instance is reported in the Compute processes section, together with its physical GPU index and the amount of frame-buffer memory assigned to it.
In the example that follows, three vGPUs are running in the system: One vGPU is running on each of the physical GPUs 0, 1, and 2.
[root@vgpu ~]# nvidia-smi
Fri May 15 09:26:18 2026
+-----------------------------------------------------------------------------+
| NVIDIA-SMI 595.91.04                Driver Version: 595.91.04               |
|-------------------------------+----------------------+----------------------+
| GPU  Name        Persistence-M| Bus-Id        Disp.A | Volatile Uncorr. ECC |
| Fan  Temp  Perf  Pwr:Usage/Cap|         Memory-Usage | GPU-Util  Compute M. |
|===============================+======================+======================|
|   0  Tesla M60           On   | 0000:83:00.0     Off |                  Off |
| N/A   31C    P8    23W / 150W |   1889MiB /  8191MiB |      7%      Default |
+-------------------------------+----------------------+----------------------+
|   1  Tesla M60           On   | 0000:84:00.0     Off |                  Off |
| N/A   26C    P8    23W / 150W |    926MiB /  8191MiB |      9%      Default |
+-------------------------------+----------------------+----------------------+
|   2  Tesla M10           On   | 0000:8A:00.0     Off |                  N/A |
| N/A   23C    P8    10W /  53W |   1882MiB /  8191MiB |     12%      Default |
+-------------------------------+----------------------+----------------------+
|   3  Tesla M10           On   | 0000:8B:00.0     Off |                  N/A |
| N/A   26C    P8    10W /  53W |     10MiB /  8191MiB |      0%      Default |
+-------------------------------+----------------------+----------------------+
|   4  Tesla M10           On   | 0000:8C:00.0     Off |                  N/A |
| N/A   34C    P8    10W /  53W |     10MiB /  8191MiB |      0%      Default |
+-------------------------------+----------------------+----------------------+
|   5  Tesla M10           On   | 0000:8D:00.0     Off |                  N/A |
| N/A   32C    P8    10W /  53W |     10MiB /  8191MiB |      0%      Default |
+-------------------------------+----------------------+----------------------+
+-----------------------------------------------------------------------------+
| Processes:                                                       GPU Memory |
|  GPU       PID  Type  Process name                               Usage      |
|=============================================================================|
|    0     11924  C+G   /usr/lib64/xen/bin/vgpu                       1856MiB |
|    1     11903  C+G   /usr/lib64/xen/bin/vgpu                        896MiB |
|    2     11908  C+G   /usr/lib64/xen/bin/vgpu                       1856MiB |
+-----------------------------------------------------------------------------+
[root@vgpu ~]#
Getting a Summary of all vGPUs in the System#
To get a summary of the vGPUs currently that are currently running on each physical GPU in the system, run nvidia-smi vgpu without additional arguments.
[root@vgpu ~]# nvidia-smi vgpu
Fri May 15 09:27:06 2026
+-----------------------------------------------------------------------------+
| NVIDIA-SMI 595.91.04                Driver Version: 595.91.04               |
|-------------------------------+--------------------------------+------------+
| GPU  Name                     | Bus-Id                         | GPU-Util   |
|      vGPU ID    Name          | VM ID    VM Name               | vGPU-Util  |
|===============================+================================+============|
|   0  Tesla M60                | 0000:83:00.0                   |   7%       |
|      11924      GRID M60-2Q   | 3        WinD-64 VGPU test 2   |       6%   |
+-------------------------------+--------------------------------+------------+
|   1  Tesla M60                | 0000:84:00.0                   |   9%       |
|      11903      GRID M60-1B   | 1        WinDv2-64 VGPU test 3 |       8%   |
+-------------------------------+--------------------------------+------------+
|   2  Tesla M10                | 0000:8A:00.0                   |  12%       |
|      11908      GRID M10-2Q   | 2        WinD-64 VGPU test 1   |      10%   |
+-------------------------------+--------------------------------+------------+
|   3  Tesla M10                | 0000:8B:00.0                   |   0%       |
+-------------------------------+--------------------------------+------------+
|   4  Tesla M10                | 0000:8C:00.0                   |   0%       |
+-------------------------------+--------------------------------+------------+
|   5  Tesla M10                | 0000:8D:00.0                   |   0%       |
+-------------------------------+--------------------------------+------------+
[root@vgpu ~]#
For a MIG-enabled GPU, the nvidia-smi vgpu command also lists the GPU instance ID.
[root@vgpu ~]# nvidia-smi vgpu
Fri May 15 09:27:06 2026
+-----------------------------------------------------------------------------+
| NVIDIA-SMI 595.91.04                Driver Version: 595.91.04               |
|-------------------------------+--------------------------------+------------+
| GPU  Name                     | Bus-Id                         | GPU-Util   |
|  GI  vGPU ID    Name          | VM ID    VM Name               | vGPU-Util  |
|===============================+================================+============|
|  0   NVIDIA RTX PRO 6000   ...| 00000000:C7:00.0               |  N/A       |
|   3  3251634224  NVIDIA R ... | 604d...  linux2022             |   N/A      |
+-------------------------------+--------------------------------+------------+
[root@vgpu ~]#
Getting Physical GPU Details#
To get detailed information about all the physical GPUs on the platform, run nvidia-smi with the –q or --query option.
[root@vgpu ~]# nvidia-smi -q
==============NVSMI LOG==============

Timestamp                                 : Tue Nov 22 10:33:26 2022
Driver Version                            : 525.60.06
CUDA Version                              : Not Found
vGPU Driver Capability
        Heterogenous Multi-vGPU           : Supported

Attached GPUs                             : 3
GPU 00000000:C1:00.0
    Product Name                          : Tesla T4
    Product Brand                         : NVIDIA
    Product Architecture                  : Turing
    Display Mode                          : Enabled
    Display Active                        : Disabled
    Persistence Mode                      : Enabled
    vGPU Device Capability
        Fractional Multi-vGPU             : Supported
        Heterogeneous Time-Slice Profiles : Supported
        Heterogeneous Time-Slice Sizes    : Not Supported
    MIG Mode
        Current                           : N/A
        Pending                           : N/A
    Accounting Mode                       : Enabled
    Accounting Mode Buffer Size           : 4000
    Driver Model
        Current                           : N/A
        Pending                           : N/A
    Serial Number                         : 1321120031291
    GPU UUID                              : GPU-9084c1b2-624f-2267-4b66-345583fbd981
    Minor Number                          : 1
    VBIOS Version                         : 90.04.38.00.03
    MultiGPU Board                        : No
    Board ID                              : 0xc100
    Board Part Number                     : 900-2G183-0000-001
    GPU Part Number                       : 1EB8-895-A1
    Module ID                             : 0
    Inforom Version
        Image Version                     : G183.0200.00.02
        OEM Object                        : 1.1
        ECC Object                        : 5.0
        Power Management Object           : N/A
    GPU Operation Mode
        Current                           : N/A
        Pending                           : N/A
    GSP Firmware Version                  : N/A
    GPU Virtualization Mode
        Virtualization Mode               : Host VGPU
        Host VGPU Mode                    : Non SR-IOV
    IBMNPU
        Relaxed Ordering Mode             : N/A
    PCI
        Bus                               : 0xC1
        Device                            : 0x00
        Domain                            : 0x0000
        Device Id                         : 0x1EB810DE
        Bus Id                            : 00000000:C1:00.0
        Sub System Id                     : 0x12A210DE
        GPU Link Info
            PCIe Generation
                Max                       : 3
                Current                   : 1
                Device Current            : 1
                Device Max                : 3
                Host Max                  : N/A
            Link Width
                Max                       : 16x
                Current                   : 16x
        Bridge Chip
            Type                          : N/A
            Firmware                      : N/A
        Replays Since Reset               : 0
        Replay Number Rollovers           : 0
        Tx Throughput                     : 0 KB/s
        Rx Throughput                     : 0 KB/s
        Atomic Caps Inbound               : N/A
        Atomic Caps Outbound              : N/A
    Fan Speed                             : N/A
    Performance State                     : P8
    Clocks Throttle Reasons
        Idle                              : Active
        Applications Clocks Setting       : Not Active
        SW Power Cap                      : Not Active
        HW Slowdown                       : Not Active
            HW Thermal Slowdown           : Not Active
            HW Power Brake Slowdown       : Not Active
        Sync Boost                        : Not Active
        SW Thermal Slowdown               : Not Active
        Display Clock Setting             : Not Active
    FB Memory Usage
        Total                             : 15360 MiB
        Reserved                          : 0 MiB
        Used                              : 3859 MiB
        Free                              : 11500 MiB
    BAR1 Memory Usage
        Total                             : 256 MiB
        Used                              : 17 MiB
        Free                              : 239 MiB
    Compute Mode                          : Default
    Utilization
        Gpu                               : 0 %
        Memory                            : 0 %
        Encoder                           : 0 %
        Decoder                           : 0 %
    Encoder Stats
        Active Sessions                   : 0
        Average FPS                       : 0
        Average Latency                   : 0
    FBC Stats
        Active Sessions                   : 0
        Average FPS                       : 0
        Average Latency                   : 0
    Ecc Mode
        Current                           : Enabled
        Pending                           : Enabled
    ECC Errors
        Volatile
            SRAM Correctable              : 0
            SRAM Uncorrectable            : 0
            DRAM Correctable              : 0
            DRAM Uncorrectable            : 0
        Aggregate
            SRAM Correctable              : 0
            SRAM Uncorrectable            : 0
            DRAM Correctable              : 0
            DRAM Uncorrectable            : 0
    Retired Pages
        Single Bit ECC                    : 0
        Double Bit ECC                    : 0
        Pending Page Blacklist            : No
    Remapped Rows                         : N/A
    Temperature
        GPU Current Temp                  : 35 C
        GPU Shutdown Temp                 : 96 C
        GPU Slowdown Temp                 : 93 C
        GPU Max Operating Temp            : 85 C
        GPU Target Temperature            : N/A
        Memory Current Temp               : N/A
        Memory Max Operating Temp         : N/A
    Power Readings
        Power Management                  : Supported
        Power Draw                        : 16.57 W
        Power Limit                       : 70.00 W
        Default Power Limit               : 70.00 W
        Enforced Power Limit              : 70.00 W
        Min Power Limit                   : 60.00 W
        Max Power Limit                   : 70.00 W
    Clocks
        Graphics                          : 300 MHz
        SM                                : 300 MHz
        Memory                            : 405 MHz
        Video                             : 540 MHz
    Applications Clocks
        Graphics                          : 585 MHz
        Memory                            : 5001 MHz
    Default Applications Clocks
        Graphics                          : 585 MHz
        Memory                            : 5001 MHz
    Deferred Clocks
        Memory                            : N/A
    Max Clocks
        Graphics                          : 1590 MHz
        SM                                : 1590 MHz
        Memory                            : 5001 MHz
        Video                             : 1470 MHz
    Max Customer Boost Clocks
        Graphics                          : 1590 MHz
    Clock Policy
        Auto Boost                        : N/A
        Auto Boost Default                : N/A
    Voltage
        Graphics                          : N/A
    Fabric
        State                             : N/A
        Status                            : N/A
    Processes
        GPU instance ID                   : N/A
        Compute instance ID               : N/A
        Process ID                        : 2103065
            Type                          : C+G
            Name                          : Win11SV2_View87
            Used GPU Memory               : 3810 MiB
[root@vgpu ~]#
Getting vGPU Details#
To get detailed information about all the vGPUs on the platform, run nvidia-smi vgpu with the –q or --query option.
To limit the information retrieved to a subset of the GPUs on the platform, use the –i or --id option to select one or more GPUs.
[root@vgpu ~]# nvidia-smi vgpu -q -i 1
GPU 00000000:C1:00.0
    Active vGPUs                          : 1
    vGPU ID                               : 3251634327
        VM ID                             : 2103066
        VM Name                           : Win11SV2_View87
        vGPU Name                         : GRID T4-4Q
        vGPU Type                         : 232
        vGPU UUID                         : afdcf724-1dd2-11b2-8534-624f22674b66
        Guest Driver Version              : 527.15
        License Status                    : Licensed (Expiry: 2022-11-23 5:2:12 GMT)
        GPU Instance ID                   : N/A
        Accounting Mode                   : Disabled
        ECC Mode                          : Enabled
        Accounting Buffer Size            : 4000
        Frame Rate Limit                  : 60 FPS
        PCI
            Bus Id                        : 00000000:02:04.0
        FB Memory Usage
            Total                         : 4096 MiB
            Used                          : 641 MiB
            Free                          : 3455 MiB
        Utilization
            Gpu                           : 0 %
            Memory                        : 0 %
            Encoder                       : 0 %
            Decoder                       : 0 %
        Encoder Stats
            Active Sessions               : 0
            Average FPS                   : 0
            Average Latency               : 0
        FBC Stats
            Active Sessions               : 0
            Average FPS                   : 0
            Average Latency               : 0
[root@vgpu ~]#
For a MIG-enabled GPU, use the –gi or --gpu-instance-id option with the –i or --id option to select one or more GPU instances.
[root@vgpu ~]# nvidia-smi vgpu -q -gi 3 -i 0
GPU 00000000:C7:00.0
    Active vGPUs                          : 1
    vGPU ID                               : 3251634224
        VM UUID                           : 604de595-d65c-4e6f-acb5-b178dec1da0d
        VM Name                           : linux2022
        vGPU Name                         : NVIDIA RTX Pro 6000 Blackwell DC-1-24Q
        vGPU Type                         : 1561
        vGPU UUID                         : 40884b72-6c60-11f0-aab8-2b7e4b395804
        MDEV UUID                         : 3bdbac5d-0850-457a-918d-5b7ecd1c8afd
        Guest Driver Version              : N/A
        License Status                    : N/A (Expiry: N/A)
        GPU Instance ID                   : 3
        Placement ID                      : 0
        Accounting Mode                   : N/A
        ECC Mode                          : Disabled
        Accounting Buffer Size            : 4000
        Frame Rate Limit                  : N/A
        PCI
            Bus Id                        : 00000000:00:00.0
        FB Memory Usage
            Total                         : 24576 MiB
            Used                          : 0 MiB
            Free                          : 24576 MiB
        Utilization
            GPU                           : N/A
            Memory                        : N/A
            Encoder                       : N/A
            Decoder                       : N/A
            Jpeg                          : N/A
            Ofa                           : N/A
        Encoder Stats
            Active Sessions               : 0
            Average FPS                   : 0
            Average Latency               : 0
        FBC Stats
            Active Sessions               : 0
            Average FPS                   : 0
            Average Latency               : 0
[root@vgpu ~]#
Monitoring vGPU engine usage#
To monitor vGPU engine usage across multiple vGPUs, run nvidia-smi vgpu with the –u or --utilization option.
For each vGPU, the usage statistics in the following table are reported once every second. The table also shows the name of the column in the command output under which each statistic is reported.
Statistic |
Column |
|---|---|
3D/Compute |
|
Memory controller bandwidth |
|
Video encoder |
|
Video decoder |
|
Each reported percentage is the percentage of the physical GPU’s capacity that a vGPU is using. For example, a vGPU that uses 20% of the GPU’s graphics engine’s capacity will report 20%.
To modify the reporting frequency, use the –l or --loop option.
To limit monitoring to a subset of the GPUs on the platform, use the –i or --id option to select one or more GPUs.
[root@vgpu ~]# nvidia-smi vgpu -u
# gpu    vgpu    sm   mem   enc   dec
# Idx      Id     %     %     %     %
    0   11924     6     3     0     0
    1   11903     8     3     0     0
    2   11908    10     4     0     0
    3       -     -     -     -     -
    4       -     -     -     -     -
    5       -     -     -     -     -
    0   11924     6     3     0     0
    1   11903     9     3     0     0
    2   11908    10     4     0     0
    3       -     -     -     -     -
    4       -     -     -     -     -
    5       -     -     -     -     -
    0   11924     6     3     0     0
    1   11903     8     3     0     0
    2   11908    10     4     0     0
    3       -     -     -     -     -
    4       -     -     -     -     -
    5       -     -     -     -     -
^C[root@vgpu ~]#
Monitoring vGPU engine usage by applications#
To monitor vGPU engine usage by applications across multiple vGPUs, run nvidia-smi vgpu with the –p option.
For each application on each vGPU, the usage statistics in the following table are reported once every second. Each application is identified by its process ID and process name. The table also shows the name of the column in the command output under which each statistic is reported.
Statistic |
Column |
|---|---|
3D/Compute |
|
Memory controller bandwidth |
|
Video encoder |
|
Video decoder |
|
Each reported percentage is the percentage of the physical GPU’s capacity used by an application running on a vGPU that resides on the physical GPU. For example, an application that uses 20% of the GPU’s graphics engine’s capacity will report 20%.
To modify the reporting frequency, use the –l or --loop option.
To limit monitoring to a subset of the GPUs on the platform, use the –i or --id option to select one or more GPUs.
[root@vgpu ~]# nvidia-smi vgpu -p
# GPU    vGPU process        process   sm  mem  enc  dec
# Idx      Id      Id           name    %    %    %    %
    0   38127    1528        dwm.exe    0    0    0    0
    1   37408    4232  DolphinVS.exe   32   25    0    0
    1  257869    4432    FurMark.exe   16   12    0    0
    1  257969    4552    FurMark.exe   48   37    0    0
    0   38127    1528        dwm.exe    0    0    0    0
    1   37408    4232  DolphinVS.exe   16   12    0    0
    1  257911     656  DolphinVS.exe   32   24    0    0
    1  257969    4552    FurMark.exe   48   37    0    0
    0   38127    1528        dwm.exe    0    0    0    0
    1  257869    4432    FurMark.exe   38   30    0    0
    1  257911     656  DolphinVS.exe   19   14    0    0
    1  257969    4552    FurMark.exe   38   30    0    0
    0   38127    1528        dwm.exe    0    0    0    0
    1  257848    3220    Balls64.exe   16   12    0    0
    1  257869    4432    FurMark.exe   16   12    0    0
    1  257911     656  DolphinVS.exe   16   12    0    0
    1  257969    4552    FurMark.exe   48   37    0    0
    0   38127    1528        dwm.exe    0    0    0    0
    1  257911     656  DolphinVS.exe   32   25    0    0
    1  257969    4552    FurMark.exe   64   50    0    0
    0   38127    1528        dwm.exe    0    0    0    0
    1   37408    4232  DolphinVS.exe   16   12    0    0
    1  257911     656  DolphinVS.exe   16   12    0    0
    1  257969    4552    FurMark.exe   64   49    0    0
    0   38127    1528        dwm.exe    0    0    0    0
    1   37408    4232  DolphinVS.exe   16   12    0    0
    1  257869    4432    FurMark.exe   16   12    0    0
    1  257969    4552    FurMark.exe   64   49    0    0
[root@vgpu ~]#
Monitoring Encoder Sessions#
Note
Encoder sessions can be monitored only for vGPUs assigned to Windows VMs. No encoder session statistics are reported for vGPUs assigned to Linux VMs.
To monitor the encoder sessions for processes running on multiple vGPUs, run nvidia-smi vgpu with the –es or --encodersessions option.
For each encoder session, the following statistics are reported once every second:
GPU ID
vGPU ID
Encoder session ID
PID of the process in the VM that created the encoder session
Codec type, for example, H.264 or H.265
Encode horizontal resolution
Encode vertical resolution
One-second trailing average encoded FPS
One-second trailing average encode latency in microseconds
To modify the reporting frequency, use the –l or --loop option.
To limit monitoring to a subset of the GPUs on the platform, use the –i or --id option to select one or more GPUs.
[root@vgpu ~]# nvidia-smi vgpu -es
# GPU    vGPU Session Process   Codec       H       V Average     Average
# Idx      Id      Id      Id    Type     Res     Res     FPS Latency(us)
    1   21211       2    2308   H.264    1920    1080     424        1977
    1   21206       3    2424   H.264    1920    1080       0           0
    1   22011       1    3676   H.264    1920    1080     374        1589
    1   21211       2    2308   H.264    1920    1080     360         807
    1   21206       3    2424   H.264    1920    1080     325        1474
    1   22011       1    3676   H.264    1920    1080     313        1005
    1   21211       2    2308   H.264    1920    1080     329        1732
    1   21206       3    2424   H.264    1920    1080     352        1415
    1   22011       1    3676   H.264    1920    1080     434        1894
    1   21211       2    2308   H.264    1920    1080     362        1818
    1   21206       3    2424   H.264    1920    1080     296        1072
    1   22011       1    3676   H.264    1920    1080     416        1994
    1   21211       2    2308   H.264    1920    1080     444        1912
    1   21206       3    2424   H.264    1920    1080     330        1261
    1   22011       1    3676   H.264    1920    1080     436        1644
    1   21211       2    2308   H.264    1920    1080     344        1500
    1   21206       3    2424   H.264    1920    1080     393        1727
    1   22011       1    3676   H.264    1920    1080     364        1945
    1   21211       2    2308   H.264    1920    1080     555        1653
    1   21206       3    2424   H.264    1920    1080     295         925
    1   22011       1    3676   H.264    1920    1080     372        1869
    1   21211       2    2308   H.264    1920    1080     326        2206
    1   21206       3    2424   H.264    1920    1080     318        1366
    1   22011       1    3676   H.264    1920    1080     464        2015
    1   21211       2    2308   H.264    1920    1080     305        1167
    1   21206       3    2424   H.264    1920    1080     445        1892
    1   22011       1    3676   H.264    1920    1080     361         906
    1   21211       2    2308   H.264    1920    1080     353        1436
    1   21206       3    2424   H.264    1920    1080     354        1798
    1   22011       1    3676   H.264    1920    1080     373        1310
^C[root@vgpu ~]#
Monitoring Frame Buffer Capture (FBC) Sessions#
To monitor the FBC sessions for processes running on multiple vGPUs, run nvidia-smi vgpu with the -fs or --fbcsessions option.
For each FBC session, the following statistics are reported once every second:
GPU ID
vGPU ID
FBC session ID
PID of the process in the VM that created the FBC session
Display ordinal associated with the FBC session.
FBC session type
FBC session flags
Capture mode
Maximum horizontal resolution supported by the session
Maximum vertical resolution supported by the session
Horizontal resolution requested by the caller in the capture call
Vertical resolution requested by the caller in the capture call
Moving average of new frames captured per second by the session
Moving average new frame capture latency in microseconds for the session
To modify the reporting frequency, use the –l or --loop option.
To limit monitoring to a subset of the GPUs on the platform, use the –i or --id option to select one or more GPUs.
[root@vgpu ~]# nvidia-smi vgpu -fs
# GPU vGPU Session Process Display Session Diff. Map Class. Map Capture Max H Max V H V Average Average
# Idx Id Id Id Ordinal Type State State Mode Res Res Res Res FPS Latency(us)
0 - - - - - - - - - - - - - -
1 3251634178 - - - - - - - - - - - - -
2 - - - - - - - - - - - - - -
0 - - - - - - - - - - - - - -
1 3251634178 - - - - - - - - - - - - -
2 - - - - - - - - - - - - - -
0 - - - - - - - - - - - - - -
1 3251634178 - - - - - - - - - - - - -
2 - - - - - - - - - - - - - -
0 - - - - - - - - - - - - - -
1 3251634178 - - - - - - - - - - - - -
2 - - - - - - - - - - - - - -
0 - - - - - - - - - - - - - -
1 3251634178 - - - - - - - - - - - - -
2 - - - - - - - - - - - - - -
0 - - - - - - - - - - - - - -
1 3251634178 1 3984 0 ToSys Disabled Disabled Unknown 4096 2160 0 0 0 0
2 - - - - - - - - - - - - - -
0 - - - - - - - - - - - - - -
1 3251634178 1 3984 0 ToSys Disabled Disabled Unknown 4096 2160 0 0 0 0
2 - - - - - - - - - - - - - -
# GPU vGPU Session Process Display Session Diff. Map Class. Map Capture Max H Max V H V Average Average
# Idx Id Id Id Ordinal Type State State Mode Res Res Res Res FPS Latency(us)
0 - - - - - - - - - - - - - -
1 3251634178 1 3984 0 ToSys Disabled Disabled Unknown 4096 2160 0 0 0 0
2 - - - - - - - - - - - - - -
0 - - - - - - - - - - - - - -
1 3251634178 1 3984 0 ToSys Disabled Disabled Unknown 4096 2160 0 0 0 0
2 - - - - - - - - - - - - - -
0 - - - - - - - - - - - - - -
1 3251634178 1 3984 0 ToSys Disabled Disabled Unknown 4096 2160 0 0 0 0
2 - - - - - - - - - - - - - -
0 - - - - - - - - - - - - - -
1 3251634178 1 3984 0 ToSys Disabled Disabled Unknown 4096 2160 0 0 0 0
2 - - - - - - - - - - - - - -
0 - - - - - - - - - - - - - -
1 3251634178 1 3984 0 ToSys Disabled Disabled Unknown 4096 2160 0 0 0 0
2 - - - - - - - - - - - - - -
0 - - - - - - - - - - - - - -
1 3251634178 1 3984 0 ToSys Disabled Disabled Unknown 4096 2160 0 0 0 0
2 - - - - - - - - - - - - - -
0 - - - - - - - - - - - - - -
1 3251634178 1 3984 0 ToSys Disabled Disabled Unknown 4096 2160 0 0 0 0
2 - - - - - - - - - - - - - -
0 - - - - - - - - - - - - - -
1 3251634178 1 3984 0 ToSys Disabled Disabled Blocking 4096 2160 1600 900 25 39964
2 - - - - - - - - - - - - - -
0 - - - - - - - - - - - - - -
1 3251634178 1 3984 0 ToSys Disabled Disabled Blocking 4096 2160 1600 900 25 39964
2 - - - - - - - - - - - - - -
0 - - - - - - - - - - - - - -
1 3251634178 1 3984 0 ToSys Disabled Disabled Blocking 4096 2160 0 0 0 0
2 - - - - - - - - - - - - - -
# GPU vGPU Session Process Display Session Diff. Map Class. Map Capture Max H Max V H V Average Average
# Idx Id Id Id Ordinal Type State State Mode Res Res Res Res FPS Latency(us)
0 - - - - - - - - - - - - - -
1 3251634178 1 3984 0 ToSys Disabled Disabled Blocking 4096 2160 0 0 0 0
2 - - - - - - - - - - - - - -
0 - - - - - - - - - - - - - -
1 3251634178 1 3984 0 ToSys Disabled Disabled Blocking 4096 2160 0 0 0 0
2 - - - - - - - - - - - - - -
0 - - - - - - - - - - - - - -
1 3251634178 1 3984 0 ToSys Disabled Disabled Blocking 4096 2160 0 0 0 0
2 - - - - - - - - - - - - - -
0 - - - - - - - - - - - - - -
1 3251634178 1 3984 0 ToSys Disabled Disabled Blocking 4096 2160 0 0 0 0
2 - - - - - - - - - - - - - -
0 - - - - - - - - - - - - - -
1 3251634178 1 3984 0 ToSys Disabled Disabled Blocking 4096 2160 0 0 0 0
2 - - - - - - - - - - - - - -
0 - - - - - - - - - - - - - -
1 3251634178 1 3984 0 ToSys Disabled Disabled Blocking 4096 2160 1600 900 135 7400
2 - - - - - - - - - - - - - -
0 - - - - - - - - - - - - - -
1 3251634178 1 3984 0 ToSys Disabled Disabled Blocking 4096 2160 1600 900 227 4403
2 - - - - - - - - - - - - - -
0 - - - - - - - - - - - - - -
1 3251634178 1 3984 0 ToSys Disabled Disabled Blocking 4096 2160 1600 900 227 4403
2 - - - - - - - - - - - - - -
0 - - - - - - - - - - - - - -
1 3251634178 1 3984 0 ToSys Disabled Disabled Blocking 4096 2160 0 0 0 0
2 - - - - - - - - - - - - - -
0 - - - - - - - - - - - - - -
1 3251634178 1 3984 0 ToSys Disabled Disabled Blocking 4096 2160 0 0 0 0
2 - - - - - - - - - - - - - -
# GPU vGPU Session Process Display Session Diff. Map Class. Map Capture Max H Max V H V Average Average
# Idx Id Id Id Ordinal Type State State Mode Res Res Res Res FPS Latency(us)
0 - - - - - - - - - - - - - -
1 3251634178 1 3984 0 ToSys Disabled Disabled Blocking 4096 2160 0 0 0 0
2 - - - - - - - - - - - - - -
0 - - - - - - - - - - - - - -
1 3251634178 1 3984 0 ToSys Disabled Disabled Blocking 4096 2160 0 0 0 0
2 - - - - - - - - - - - - - -
0 - - - - - - - - - - - - - -
1 3251634178 1 3984 0 ToSys Disabled Disabled Blocking 4096 2160 0 0 0 0
2 - - - - - - - - - - - - - -
0 - - - - - - - - - - - - - -
1 3251634178 1 3984 0 ToSys Disabled Disabled Blocking 4096 2160 0 0 0 0
2 - - - - - - - - - - - - - -
0 - - - - - - - - - - - - - -
1 3251634178 1 3984 0 ToSys Disabled Disabled Blocking 4096 2160 0 0 0 0
2 - - - - - - - - - - - - - -
0 - - - - - - - - - - - - - -
1 3251634178 1 3984 0 ToSys Disabled Disabled Blocking 4096 2160 0 0 0 0
2 - - - - - - - - - - - - - -
0 - - - - - - - - - - - - - -
1 3251634178 1 3984 0 ToSys Disabled Disabled Blocking 4096 2160 0 0 0 0
2 - - - - - - - - - - - - - -
0 - - - - - - - - - - - - - -
1 3251634178 1 3984 0 ToSys Disabled Disabled Blocking 4096 2160 0 0 0 0
2 - - - - - - - - - - - - - -
0 - - - - - - - - - - - - - -
1 3251634178 1 3984 0 ToSys Disabled Disabled Blocking 4096 2160 0 0 0 0
2 - - - - - - - - - - - - - -
0 - - - - - - - - - - - - - -
1 3251634178 1 3984 0 ToSys Disabled Disabled Blocking 4096 2160 0 0 0 0
2 - - - - - - - - - - - - - -
^C[root@vgpu ~]#
Monitoring MIG-backed vGPU activity#
To monitor MIG-backed vGPU activity across multiple vGPUs, run nvidia-smi vgpu with the --gpm-metrics <ID-list> option.
The --gpm-metrics option is supported only on MIG-backed vGPUs that are allocated all of the GPU instance’s frame buffer.
<ID-list>A comma-separated list of integer IDs that specify the statistics to monitor as shown in the following table. The table also shows the name of the column in the command output under which the statistic is reported.
Statistic
ID
Column
Graphics activity
1
gractStreaming multiprocessor (SM) activity
2
smutilSM occupancy
3
smoccInteger activity
4
intutilTensor activity
5
mmaactDouble-precision fused multiply-add (DFMA) tensor activity
6
dfmatHalf matrix multiplication and accumulation (HMMA) tensor activity
7
hmmatInteger matrix multiplication and accumulation (IMMA) tensor activity
9
immatDynamic random-access memory (DRAM) activity
10
dramDouble-precision 64-bit floating-point (FP64) activity
11
fp64Single-precision 32-bit floating-point (FP32) activity
12
fp32Half-precision 16-bit FP16 activity
13
fp16NVDEC 0-7 Activity
30-37
nvdec0-nvdec7NVJPG 0-7 Activity
40-47
nvjpg0-nvjpg7NVOFA 0-1 Activity
50-51
nvofa0-nvofa01HOSTMEM CACHE HIT
160
hmhitHOSTMEM CACHE MISS
161
hmmissPEERMEM CACHE HIT
162
pmhitPEERMEM CACHE MISS
163
pmmissDRAM CACHE HIT
164
dmhitDRAM CACHE MISS
165
dmmissNVENC 0-3 Activity
166-169
nvenc0-nvenc3
Each reported percentage is the percentage of the physical GPU’s capacity that a vGPU is using. For example, a vGPU that uses 20% of the GPU’s DRAM capacity will report 20%.
For each vGPU, the specified statistics are reported once every second.
To modify the reporting frequency, use the –l or --loop option.
To limit monitoring to a subset of the GPUs on the platform, use the –i or --id option to select one or more GPUs.
The following example reports graphics activity, SM activity, SM occupancy, and integer activity for one vGPU VM that is powered on and within which one application is running.
[root@vgpu ~]# nvidia-smi vgpu --gpm-metrics 1,2,3,4
# gpu        vgpu    mig_id       gi_id        ci_id       gract    smutil      smocc    intutil
# Idx          Id       Idx         Idx          Idx           %         %          %          %
   0  3251634249          0           2            0           -         -          -          -
   0  3251634249          0           2            0          99        97         26         13
   0  3251634249          0           2            0          99        96         23         13
   0  3251634249          0           2            0          99        97         27         13
When no vGPUs are active on the hypervisor host, no activity is reported.
[root@vgpu ~]# nvidia-smi vgpu --gpm-metrics 1,2,3,4
# gpu        vgpu    mig_id       gi_id        ci_id       gract    smutil      smocc    intutil
# Idx          Id       Idx         Idx          Idx           %         %          %          %
   0            -         -           -            -           -         -          -          -
   0            -         -           -            -           -         -          -          -
   0            -         -           -            -           -         -          -          -
Listing Supported vGPU Types#
To list the virtual GPU types that the GPUs in the system support, run nvidia-smi vgpu with the –s or --supported option.
To limit the retrieved information to a subset of the GPUs on the platform, use the –i or --id option to select one or more GPUs.
[root@vgpu ~]# nvidia-smi vgpu -s -i 0
GPU 0000:83:00.0
    GRID M60-0B
    GRID M60-0Q
    GRID M60-1A
    GRID M60-1B
    GRID M60-1Q
    GRID M60-2A
    GRID M60-2Q
    GRID M60-4A
    GRID M60-4Q
    GRID M60-8A
    GRID M60-8Q
[root@vgpu ~]#
To view detailed information about the supported vGPU types, add the –v or --verbose option:
[root@vgpu ~]# nvidia-smi vgpu -s -i 0 -v   | less
GPU 00000000:40:00.0
    vGPU Type ID                          : 0xc
        Name                              : GRID M60-0Q
        Class                             : Quadro
        GPU Instance Profile ID           : N/A
        Max Instances                     : 16
        Max Instances Per VM              : 1
        Multi vGPU Exclusive              : False
        vGPU Exclusive Type               : False
        vGPU Exclusive Size               : False
        Device ID                         : 0x13f210de
        Sub System ID                     : 0x13f2114c
        FB Memory                         : 512 MiB
        Display Heads                     : 2
        Maximum X Resolution              : 2560
        Maximum Y Resolution              : 1600
        Frame Rate Limit                  : 60 FPS
        GRID License                      : Quadro-Virtual-DWS,5.0;GRID-Virtual-WS,2.0;GRID-Virtual-WS-Ext,2.0
    vGPU Type ID                          : 0xf
        Name                              : GRID M60-1Q
        Class                             : Quadro
        GPU Instance Profile ID           : N/A
        Max Instances                     : 8
        Max Instances Per VM              : 1
        Multi vGPU Exclusive              : False
        vGPU Exclusive Type               : False
        vGPU Exclusive Size               : False
        Device ID                         : 0x13f210de
        Sub System ID                     : 0x13f2114d
        FB Memory                         : 1024 MiB
        Display Heads                     : 4
        Maximum X Resolution              : 5120
        Maximum Y Resolution              : 2880
        Frame Rate Limit                  : 60 FPS
        GRID License                      : Quadro-Virtual-DWS,5.0;GRID-Virtual-WS,2.0;GRID-Virtual-WS-Ext,2.0
    vGPU Type ID                          : 0x12
        Name                              : GRID M60-2Q
        Class                             : Quadro
        GPU Instance Profile ID           : N/A
        Max Instances                     : 4
        Max Instances Per VM              : 1
        Multi vGPU Exclusive              : False
        vGPU Exclusive Type               : False
        vGPU Exclusive Size               : False
…
[root@vgpu ~]#
Listing the vGPU Types that Can Currently Be Created#
To list the virtual GPU types that can currently be created on GPUs in the system, run nvidia-smi vgpu with the –c or --creatable option.
This property is a dynamic property that reflects the number and type of vGPUs that are already running on the GPU.
If no vGPUs are running on the GPU, all vGPU types that the GPU supports are listed.
If one or more vGPUs are running on the GPU, but the GPU is not fully loaded, only the type of the vGPUs that are already running is listed.
If the GPU is fully loaded, no vGPU types are listed.
To limit the retrieved information to a subset of the GPUs on the platform, use the –i or --id option to select one or more GPUs.
[root@vgpu ~]# nvidia-smi vgpu -c -i 0
GPU 0000:83:00.0
    GRID M60-2Q
[root@vgpu ~]#
For a MIG-enabled GPU, use the –gi or --gpu-instance-id option with the –i or --id option to select one or more GPU instances.
[root@vgpu ~]# nvidia-smi vgpu -c -gi 3 -i 0
GPU 00000000:C7:00.0
    GPU Instance ID: 3
      NVIDIA RTX Pro 6000 Blackwell DC-1-2Q
      ...
To view detailed information about the vGPU types that can currently be created, add the –v or --verbose option.
Using Citrix XenCenter to monitor GPU performance#
If you are using XenServer as your hypervisor, you can monitor GPU performance in XenCenter.
Click on a server’s Performance tab.
Right-click on the graph window, then select Actions and New Graph.
Provide a name for the graph.
In the list of available counter resources, select one or more GPU counters.
Counters are listed for each physical GPU not currently being used for GPU pass-through.
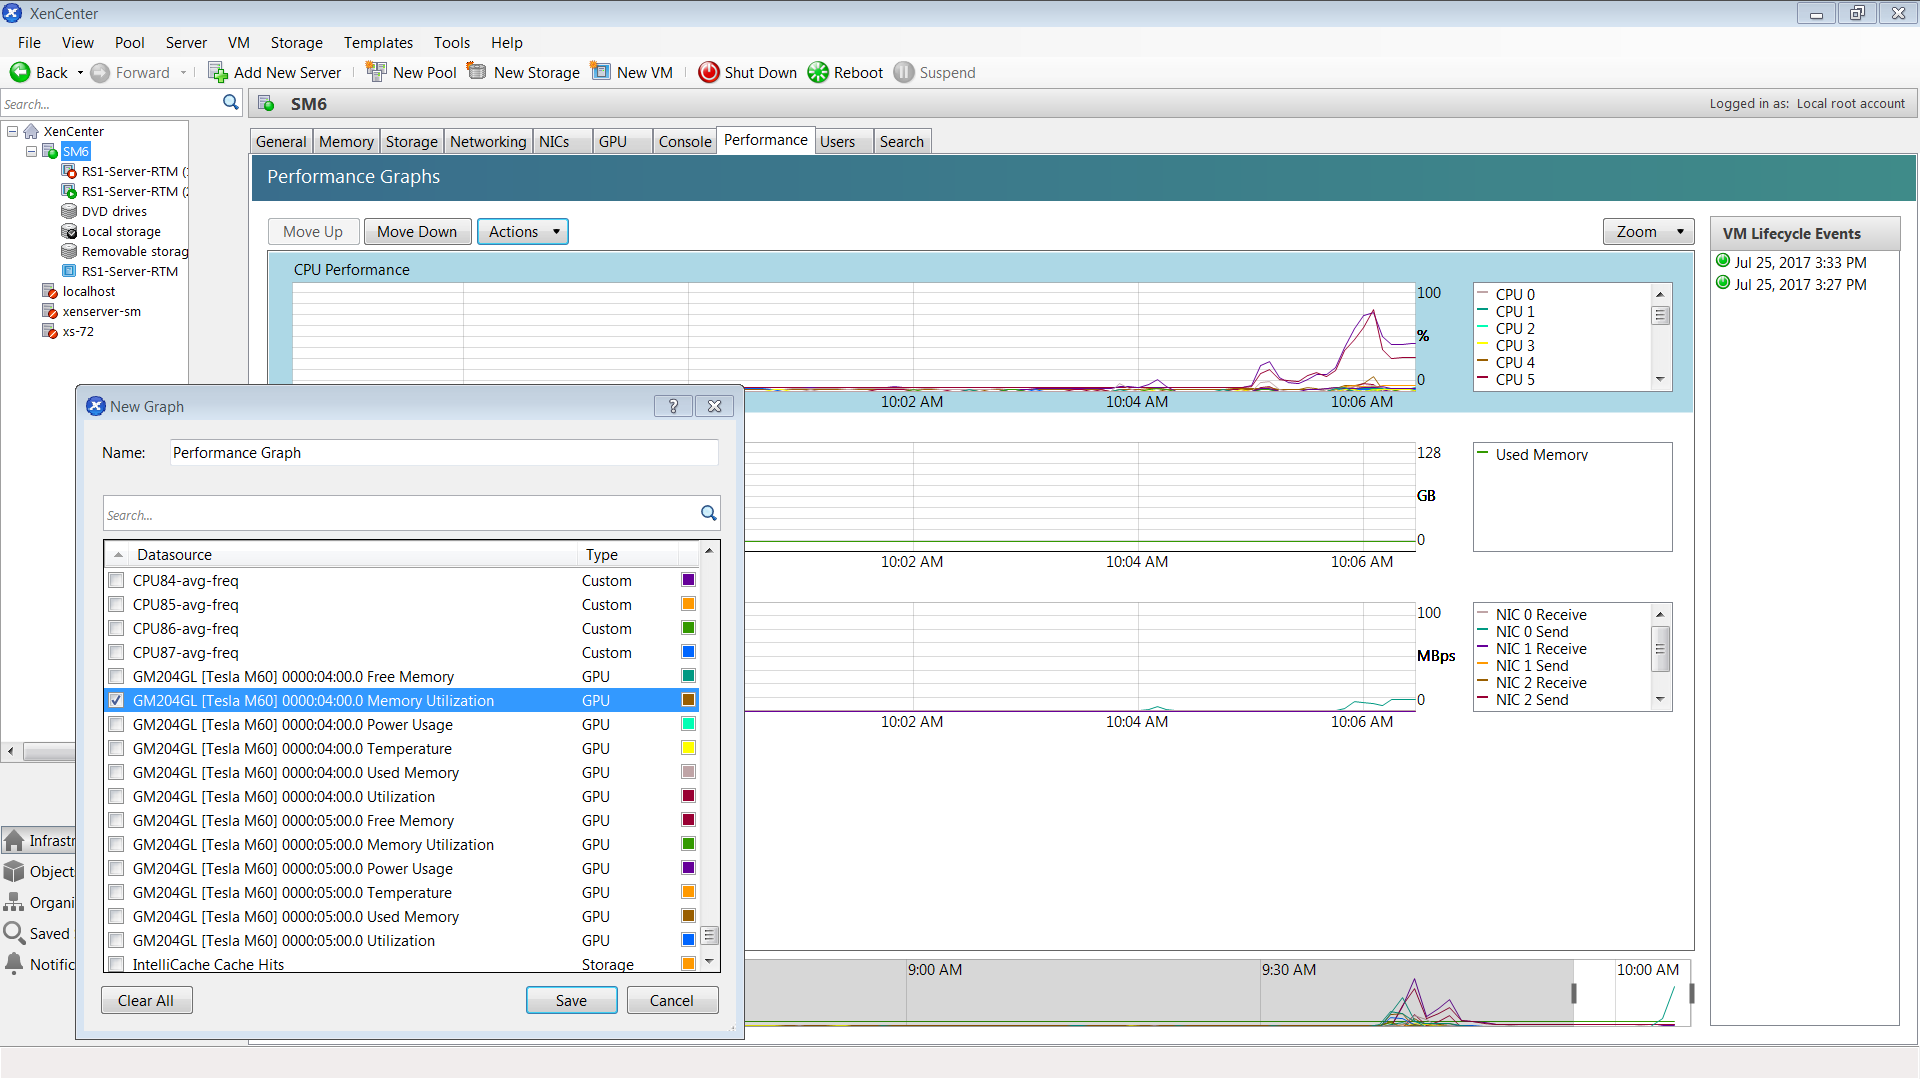
Figure 24 Using Citrix XenCenter to monitor GPU performance#
Monitoring GPU Performance from a Guest VM#
You can use monitoring tools within an individual guest VM to monitor the performance of vGPUs or pass-through GPUs that are assigned to the VM. The scope of these tools is limited to the guest VM within which you use them. You cannot use monitoring tools within an individual guest VM to monitor any other GPUs in the platform.
For a vGPU, only these metrics are reported in a guest VM:
3D/Compute
Memory controller
Video encoder
Video decoder
Frame buffer usage
Other metrics normally present in a GPU are not applicable to a vGPU and are reported as zero or N/A, depending on the tool that you are using.
Using nvidia-smi to Monitor GPU Performance from a Guest VM#
In guest VMs, you can use the nvidia-smi command to retrieve statistics for the total usage by all applications running in the VM and usage by individual applications of the following resources:
GPU
Video encoder
Video decoder
Frame buffer
To use nvidia-smi to retrieve statistics for the total resource usage by all applications running in the VM, run the following command:
nvidia-smi dmon
The following example shows the result of running nvidia-smi dmon from within a Windows guest VM.
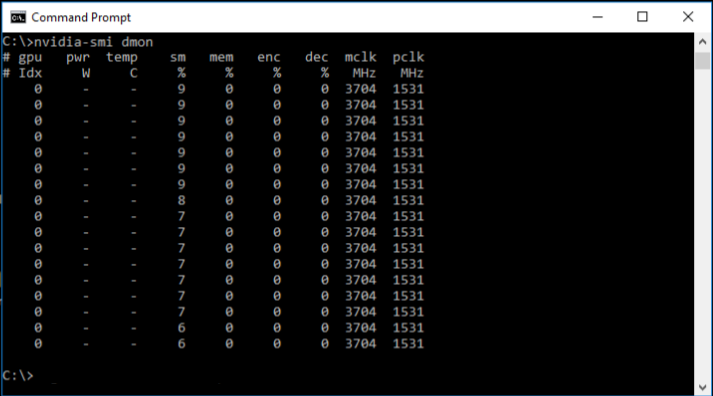
Figure 25 Using nvidia-smi from a Windows guest VM to get total resource usage by all applications#
To use nvidia-smi to monitor MIG-backed vGPU activity from a VM, run nvidia-smi dmon with the following options:
--gpm-metrics<ID-list><ID-list>A comma-separated list of integer IDs that specify the statistics to monitor as described in Monitoring MIG-backed vGPU activity.
Note
The
--gpm-metricsoption is not supported on Windows.--gpm-options m
To use nvidia-smi to retrieve statistics for resource usage by individual applications running in the VM, run the following command:
nvidia-smi pmon
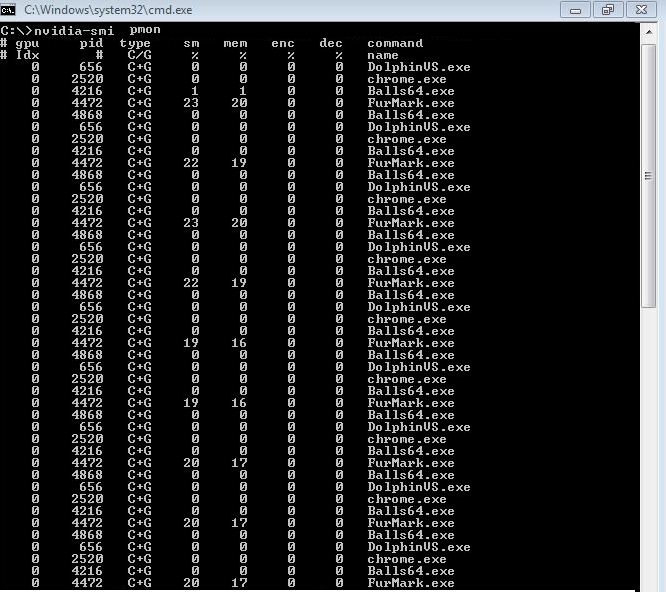
Figure 26 Using nvidia-smi from a Windows guest VM to get resource usage by individual applications#
Using Windows Performance Counters to monitor GPU performance#
In Windows VMs, GPU metrics are available as Windows Performance Counters through the NVIDIA GPU object.
Any application that is enabled to read performance counters can access these metrics. You can access these metrics directly through the Windows Performance Monitor application that is included with the Windows OS.
The following example shows GPU metrics in the Performance Monitor application.
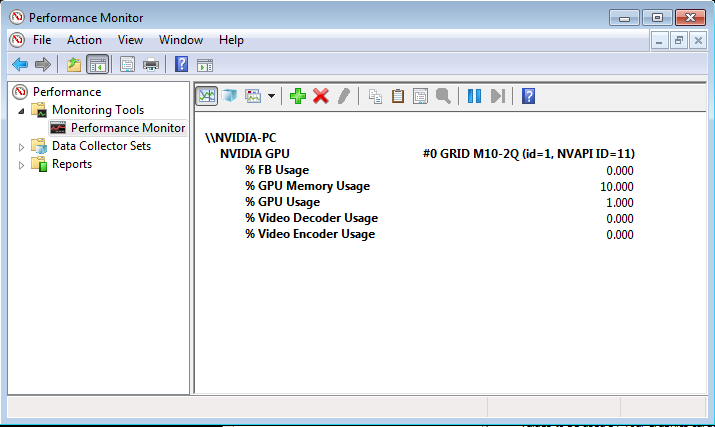
Figure 27 Using Windows Performance Monitor to monitor GPU performance#
On vGPUs, the following GPU performance counters read as 0 because they are not applicable to vGPUs:
% Bus Usage
% Cooler rate
Core Clock MHz
Fan Speed
Memory Clock MHz
PCI-E current speed to GPU Mbps
PCI-E current width to GPU
PCI-E downstream width to GPU
Power Consumption mW
Temperature C
Using NVWMI to monitor GPU performance#
In Windows VMs, Windows Management Instrumentation (WMI) exposes GPU metrics in the ROOT\CIMV2\NV namespace through NVWMI. NVWMI is included with the NVIDIA driver package. The NVWMI API Reference in Windows Help format is available for download from the NVIDIA website.
Any WMI-enabled application can access these metrics. The following example shows GPU metrics in the third-party application WMI Explorer, which is available for download from the from the WMI Explorer on GitHub page.
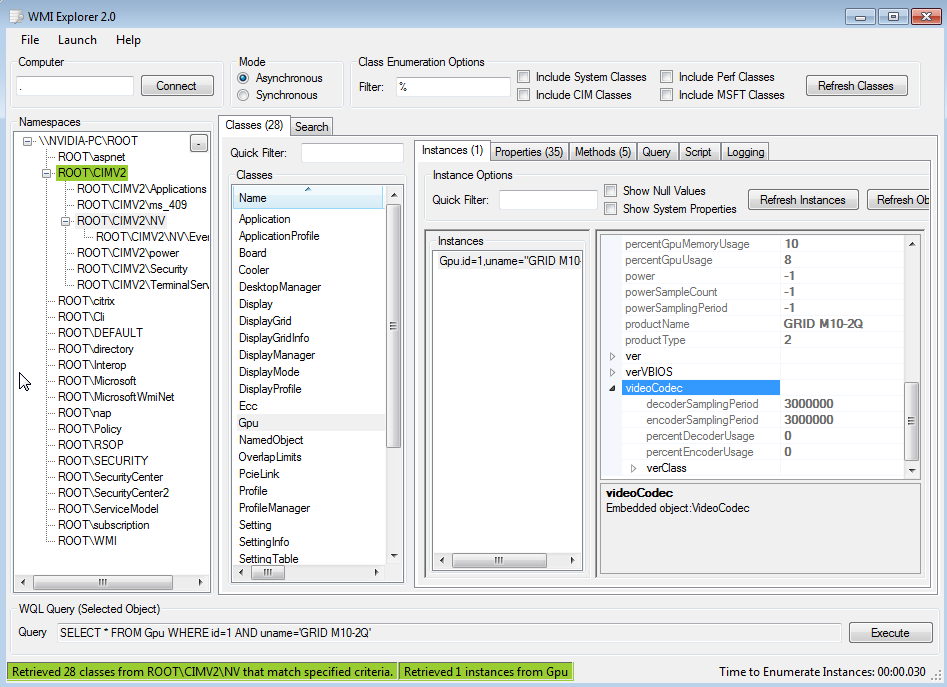
Figure 28 Using WMI Explorer to monitor GPU performance#
On vGPUs, some instance properties of the following classes do not apply to vGPUs:
GpuPcieLink
Gpu instance properties that do not apply to vGPUs#
|
Value reported on vGPU |
|---|---|
|
-1 |
|
-1 |
|
0 |
|
0 |
|
0 |
|
0 |
|
1 |
|
2500 |
|
0 |
|
-1 |
|
-1 |
|
-1 |
|
0 |
|
— |
|
0 |
PcieLink instance properties that do not apply to vGPUs#
No instances of PcieLink are reported for vGPU.