DLProf User Guide
Abstract
The Deep Learning Profiler (DLProf) User Guide provides instructions on using the DLProf tool to improve the performance of deep learning models.
1.1. Overview
Deep Learning Profiler is a tool for profiling deep learning models to help data scientists understand and improve performance of their models visually via the DLProf Viewer or by analyzing text reports. We will refer to Deep Learning Profiler simply as DLProf for the remainder of this guide.
1.2. What's New in 1.3.0
- Added database versioning and backwards compatibility starting with v1.2 databases.
- Added underutilized GPU detector.
1.3. Features
This release includes these commands and features:
- Tensor Core Usage and Eligibility Detection: DLProf can determine if an operation has the potential to use Tensor Cores and whether or not Tensor Core enabled kernels are being executed for those operations.
- Multiple Deep Learning Framework Support: Individual frameworks supported by DLProf can be profiled by selecting the appropriate profile mode.
- Custom Viewer: DLProf will automatically generate a DLProf database. This file can be viewed with NVIDIA's DLProf Viewer to visualize and analyze the profile results in a web browser.
- Multi-GPU Support: DLProf can profile runs with multiple GPUs.
- Iteration Detection: Iterations can be detected from specifying a key node. Reports can be aggregated based on iterations, allowing users to further drill down performance bottlenecks.
- Time Correlation with NVTX Markers: DLProf uses NVTX markers inserted into the profile data to correlate CPU and GPU time with model operations.
- Report Generation: A number of reports can be generated that aggregate data based on operation, iteration, layer, or kernel. Both JSON and CSV formats are supported for most reports.
- Expert Systems: A feature that analyzes the profiling data, identifying common improvement areas and performance bottlenecks, and provides suggestions on how to address the issues to improve the overall performance.
- XLA Support: DLProf fully supports analyzing XLA compiled TensorFlow models.
- Support Custom NVTX Markers and Domains: DLProf will support custom NVTX markers and domains specified with the NVTX Plugin.
- Profile with Delay and Duration: DLProf can delay the start of profile and stop the profile after a set duration.
2.1. Installing Using a Python Wheel File
A stand-alone, framework agnostic version of DLProf is available as a python(pip) wheel on the NVIDIA PY index. First, install nvidia-pyindex:
$ pip install nvidia-pyindex
Then install DLProf.
$ pip install nvidia-dlprof
This will install just DLProf and the immediate dependencies. This option assumes a supported framework is installed. See Profiling from a PythonPIP Wheel for more installation options.
2.2. Using the NGC Docker Container
The following steps are required to use pre-built NGC containers:
- Ensure you have access and are logged into NGC. For step-by-step instructions, see the NGC Getting Started Guide.
- Install Docker and nvidia-docker. For DGX users, see Preparing to use NVIDIA Containers. For users other than DGX, see nvidia-docker installation documentation.
Use docker pull to get the TensorFlow container from NGC:
$ docker pull [<container name>]
Where [<container name>] is the location for the NGC framework container. Supported containers include:
- Tensorflow 1.x:
nvcr.io/nvidia/tensorflow:21.07-tf1-py3 - Tensorflow 2:
nvcr.io/nvidia/tensorflow:21.07-tf2-py3 - PyTorch:
nvcr.io/nvidia/pytorch:21.07-py3
Assuming the training data for the model is available in /full/path/to/training/data, you can launch the container with the following command:
            $ docker run --rm --gpus=1 --shm-size=1g --ulimit memlock=-1 \
--ulimit stack=67108864 -it -p8000:8000 -v/path/to/training/data:/data \
[<container name>]
2.3. Running DLProf
This simplest way to profile your model training from an NGC container is with the following command (extra steps are required for PyTorch):
$ dlprof python <train script>
Where <train script> is the full command line you would normally use to train your model. NVIDIA recommends that you provide options to your script to only train your model for 5 minutes or less. That will be long enough to gather a reasonable snapshot of training. Running for too long can result in too much data being generated.
DLProf automatically creates the correct Nsight System command line needed to profile your training session and creates the DLProf database needed to view the results in the DLProf Viewer. The following collateral is created:
- nsys_profile.qdrep : The QDREP file is generated by Nsight Systems and can be opened in the Nsight Systems GUI to view the timeline of the profile.
- nsys_profile.sqlite : A SQLite database of the profile data that is used by DLprof.
- dlprof_dldb.sqlite: The DLProf database which contains the aggregated statistic from the run.
2.4. Analyzing Results
To analyze the results in the DLProf Viewer, run the following command:
$ dlprofviewer ./dlprof_dldb.sqlite
This command launches the server. To view the results, enter http://<IP Address>:8000 in a browser.
See the NVIDIA DLProf Viewer User Guide for more information.
DLProf is designed to be agnostic to the underlying Deep Learning framework when analyzing and presenting profile results. However, profiling is very specific to the individual framework. It is not always possible to automatically detect which framework a training or inferencing script is using. In DLProf, the correct framework can be selected by setting the execution mode with the --mode command line option. The available modes of operation are listed below.
A special build of DLProf is created for each supported framework container on the NVIDIA GPU Cloud (NGC). This build will set the appropriate default mode to the underlying framework in the container, so it is not necessary to set the --mode flag within the container. Additional options may be limited depending on which features are supported in each framework. See Command Line Options for a full list of available options per framework.
3.1. Simple Mode
DLProf provides a Simple Mode that is completely framework agnostic and works with any framework, both supported and unsupported. Simple mode is activated with the DLProf command line option --mode=simple.
Unlike framework specific modes, simple mode does not require NVTX annotation markers to be embedded at the framework level. These markers are already present in the NGC TensorFlow1 but not in TensorFlow2 or PyTorch. Simple mode will only provide the Total Wall Clock Time, Total GPU Time, and Total Tensor Core Kernel Time. Additionally, simple mode can generate a Kernel Report showing the time aggregation for each executed kernel.
Without the aid of NVTX markers, all additional features and reports are not available in simple mode. This includes creating files needed for the DLProf viewer and Expert Systems output. However, simple mode can provide an overview of GPU utilization and Tensor Core Kernel utilization.
Simple mode still requires Nsight Systems and you can use --delay and --duration options to limit the profile window for the training script.
3.2. TensorFlow 1.X
To profile a TensorFlow 1.x model, use the command line option --mode=tensorflow1. This mode is set by default in the DLProf released in the NGC TensorFlow 1.x container and does not need to be explicitly called.
All reports and features are fully supported in TensorFlow 1.x. See the Command Line Options section for a full list of available options.
3.3. TensorFlow 2.x
To profile a TensorFlow 2.x model, use the command line option --mode=tensorflow2. This mode is set by default in the DLProf released in the NGC TensorFlow 2.x container and does not need to be explicitly called.
All reports and features are fully supported in TensorFlow 2.x. See the Command Line Options section for a full list of available options. Unlike TensorFlow 1.x, TensorFlow 2.x does not have a not common node like "global_step" that can be used to detect iteration (or step) boundaries. However, there is a two-step process that TF2 users can perform to generate textual reports and visualizations that display profiled data split on iteration boundaries.
-
First step: run the model without a key_node, and specify
--reports=detailon the command line.- Inspect the detail report CSV file, and manually determine which op node can be used to determine iteration (ie, "step") boundaries. This will be used as in the
--key_nodeargument in the second step below. - Locate the dlprof database with the network's profile information (
dlprof_dldb.sqlite). This will be used in the second step below.
- Inspect the detail report CSV file, and manually determine which op node can be used to determine iteration (ie, "step") boundaries. This will be used as in the
- Second step: run dlprof again using the
--key_nodeand--databasearguments:- Add
--key_node=<the Op ID determined from the first step above> - Add
--database=<the name of the dlprof database located from this first step above> - Remove "python" and all the arguments after it to run DLProf without profiling
- Add --reports=<list of reports you're interested in>
- Finally, add
--force=trueto overwrite any old reports/outputs from the last run.
- Add
The second step will be much faster than the first step since the profile was captured in the database during the first step.
After these two steps are performed, the textual reports are available for review as well as the DLProf database that can be used for visualization inside of the DLProf Viewer.
3.4. TensorRT
To profile a TensorRT model, use --mode=tensorrt. This mode is available in both the standalone DLProf pip install and all of the NGC containers that DLProf is installed in.
DLProf TensorRT support includes models that run only TensorRT. This includes models run using trtexec or created from scratch via the TensorRT python/C++ APIs. DLProf does not support TF-TRT yet.
All reports and features are fully supported in TensorRT mode. See the Command Line Options section for a full list of available options.
3.5. PyTorch
To profile a PyTorch model, use the command line option --mode=pytorch. This mode is set by default in the DLProf released in the NGC PyTorch container and does not need to be explicitly called.
DLProf uses both its own python pip package and Nsight Systems to profile PyTorch models and are available in the NGC PyTorch container.
All reports and features are fully supported in PyTorch. See the Command Line Options section for full list of available options.
For the best experience, make sure to use the compatible versions of the GPU Driver, CUDA, TensorFlow, and Nsight Systems specified in the release notes.
DLProf is a wrapper tool around Nsight Systems that correlates profile timing data and kernel information to a Machine Learning model. The correlated data is presented in a format that can be easily digested and understood by the user. The results highlight GPU utilization of model and DL/ML operations. The tools provide different reports to aid in identifying bottlenecks and Tensor Core usage.
4.1. Profiling from a PythonPIP Wheel
DLProf is available as a Python wheel file on the NVIDIA PY index. This will install a framework generic build of DLProf that will require the user to specify the framework with the --mode flag. To install the DLProf from a PIP wheel, first install the NVIDIA PY index:
$ pip install nvidia-pyindex
Then install DLProf.
$ pip install nvidia-dlprof
This will install just DLProf along with any immediate dependencies. This option assumes a supported framework is installed or that you just want to run in "simple" mode to profile an unsupported framework.
To install additional dependencies for a specific framework, pass the name of the framework as an option.
4.1.1. TensorFlow 1.X
$ pip install nvidia-dlprof[tensorflow]
This option will also install the nvidia-tensorflow pip package from the NVIDIA PY index. This version of Tensorflow contains the functionality to insert the NVTX markers needed by DLProf.
4.1.2. TensorFlow 2.X
The PythonPIP wheel file is not supported at this time.
4.1.3. PyTorch
$ pip install nvidia-dlprof[pytorch]
This option also installs the nvidia-pytorch pip package from the NVIDIA PY index and dlprof’s python pip package for pytorch models, nvidia_dlprof_pytorch_nvtx. Both components are required to insert the NVTX markers needed by DLProf.
4.2. Profiling from the NGC TensorFlow Docker Container
DLProf is provided in the TensorFlow container on the NVIDIA GPU Cloud (NGC). The version of TensorFlow inside the container has been modified by NVIDIA to automatically insert NVTX range markers around the TensorFlow executor. The NVTX markers are required for DLProf in order to correlate GPU time with the TensorFlow model.
4.2.1. Pulling NGC Framework Containers
Before you can pull a container from the NGC container registry, you must have Docker and nvidia-docker installed. For DGX users, this is explained in Preparing to use NVIDIA Containers Getting Started Guide. For users other than DGX, follow the nvidia-docker installation documentation to install the most recent version of CUDA, Docker, and nvidia-docker.
After performing the above setup, you can use the following commands to pull the desired framework container.
TensorFlow 1.x
$ docker pull nvcr.io/nvidia/tensorflow:21.07-tf1-py3
TensorFlow 2.x
$ docker pull nvcr.io/nvidia/tensorflow:21.07-tf2-py3
PyTorch
$ docker pull nvcr.io/nvidia/pytorch:21.07-py3
Replace the current container version with the version of the container and profiler release that you want to pull.
4.2.2. Launching the NGC Container
Assuming the training data for the model is available in /full/path/to/training/data, you can launch the container with the following command:
            $ docker run --rm --gpus=1 --shm-size=1g --ulimit memlock=-1 \
 --ulimit stack=67108864 -it -p8000:8000 -v/path/to/training/data:/data \

[<container name>]
Replace [<container name>] with the name of the container used in the previous docker pull instruction.
The --gpus option is required to use nvidia-docker and specifies the number of GPUs to provide to the container.
The docker -v option maps /path/to/training/data on the host into the container at /data. You may also map additional host directories into the container with separate -v options.
The -p flag exposes the container port for the DLProf Viewer's server (port 8000).
The--shm-size and --ulimit flags are recommended to improve the server’s performance. For --shm-size the minimum recommended size is 1g but smaller or larger sizes may be used depending on the number and size of models being served.
4.3. Profiling with DLProf CLI
One of the main goals for DLProf is to automate and simplify the profiling experience. In its simplest form, a user would just need to prepend the training script with dlprof.
$ dlprof [training_script.py]
DLProf automatically creates the correct Nsight System command line needed to profile your training session and creates the necessary files needed to view the results in DLProf Viewer. The following collateral is created:
- nsys_profile.qdrep: The QDREP file is generated by Nsight Systems and can be opened in the Nsight Systems GUI to view the timeline of the profile.
- nsys_profile.sqlite: A SQLite database of the profile data that is used by DLProf.
- dlprof_dldb.sqlite: The DLProf database that is used in the DLProf Viewer.
All DLProf specific options must be passed before the training script in the following format:
$ dlprof <args> [training_script.py]
4.4. Passing arguments to Nsight Systems
Nsight Systems passively logs CUDA API calls. The result is the ability to profile the entire model network, both GPU and CPU, in near real time. DLProf then extracts the timing and NVTX range information for every executed kernel. Getting timing information for the operations that ran during model training can be an important debugging tool to determine where optimization is needed.
DLProf determines the Tensor Core utilization from the name of the kernel. This method can accurately identify cuDNN kernels that use Tensor Cores, but will not identify custom kernels or kernels outside of cuDNN that use Tensor Cores.
DLProf enables you to customize the Nsight Systems command line. By default, DLProf calls Nsight Systems with the following command line arguments:
$ nsys profile -t cuda,nvtx -s none --show-output=true --export-sqlite -o ./nsys_profile <training_script.py>
You can customize the NSight System arguments using this DLProf option:
--nsys_opts="[option list]"
For example,
$ dlprof --nsys_opts="-t orst,cuda,nvtx" <training_script.py>
creates and executes the following Nsight Systems command:
$ nsys profile -t orst,cuda,nvtx --show-output=true --export-sqlite -o ./nsys_profile <training_script.py>
The output level sent to Nsight Systems depends on the DLProf verbosity level. To hide output from NSight Systems, you can use the either quiet or minimal verbosity level. For example, the following DLProf command:
dlprof --verbosity=quiet <training_script.py>
creates the following Nsight Systems command:
nsys profile -t cuda,nvtx -s none --show-output=false --export-sqlite -o ./nsys_profile <training_script.py>
The base filename for Nsight Systems output files can be changed from nsys_profile with
--nsys_base_output_filename=<basename>
This can be useful when profiling multiple configurations and you require keeping the profile data from each run.
4.5. Profiling PyTorch with nvidia_dlprof_pytorch_nvtx
When profiling PyTorch models, DLProf uses a python pip package called nvidia_dlprof_pytorch_nvtx to insert the correct NVTX markers. nvidia_dlprof_pytorch_nvtx must first be enabled in the PyTorch Python script before it can work correctly. To enable it, you must add the following lines to your PyTorch network:
            import nvidia_dlprof_pytorch_nvtx
nvidia_dlprof_pytorch_nvtx.init()
You should also run the training/inference loop with PyTorch’s NVTX Context Manager with the following:
with torch.autograd.profiler.emit_nvtx():
The PyTorch model can then be profiled normally with DLProf.
4.6. Profiling within a range
DLProf can profile within a range set in your model.
--nsys_profile_range=True
Enabling this option causes DLProf to respect the profiler.start() and profiler.stop() boundaries set in your model, which results in data only collected inside that boundary. Profiler.stop() does not immediately end the profiler, only the collection of data.
4.7. Profiling with Delay and Duration
DLProf can delay the start of the profile with this command line option:
--delay <seconds>
This adds the correct command line to Nsight Systems that will delay the start of the profile by the specified number of seconds. Note that the first iteration starts with the first key node found after the delay, and will not include any iterations before the delayed time.
DLProf can stop the profile and the execution of the model after a specified number of seconds with the following command line option:
--duration <seconds>
Both delay and duration can be used together to limit the profiling to a specified number of seconds in the middle of a model run.
4.8. Running DLProf without Profiling
It is possible to run DLProf without calling Nsight Systems to profile the model again. This is useful to create a new report, specify a different key node, or aggregate data over different iteration ranges. In each of these cases, it is better to reuse profile data that has already been collected.
In order to run DLProf without profiling, an SQLite database created by an initial Nsight Systems profile or a DLProf sqlite database is required. If both are available, the DLProf sqlite database is preferred.The format for the DLProf command line becomes:
$ dlprof --database=[nsys_profile.sqlite] [<args>]
or
$ dlprof --database=[dbdlprof.sqlite] [<args>]
where [nsys_profile.sqlite] is the SQLITE file generated by Nsight Systems, and dbdlprof.sqlite is the SQLITE file generated by DLProf. All other DLProf options are valid and optional.
4.8.1. Backwards Compatibility
Some older versions of the DLProf database can be used as input to the latest DLProf CLI:
- A DLProf database’s initial version is the version of DLProf used to create it.
- The DLProf database version should still be less than or equal to the DLProf CLI version.
- DLProf databases v1.2+ can be used as input to DLProf CLI v1.2+
- DLProf databases v1.0 and v1.1 cannot be used as input to DLProf CLI v1.2+.
- When an older DLProf database is used as input, some minor changes will be made to it to allow it to be used correctly with the latest DLProf CLI.
- Backwards compatibility gets “reset” each major release.
- DLProf CLI v2.x will not support DLProf databases v1.y.
NVIDIA's Tensor Cores is a revolutionary technology that accelerates AI performance by enabling efficient mixed-precision implementation. It accelerates large matrix multiples and accumulates operations in a single operation.
5.1. Mixed Precision Training
Mixed precision methods combine the use of different numerical formats in one computational workload. Mixed precision training offers significant computational speedup by performing operations in half-precision format, while storing minimal information in single-precision to retain as much information as possible in critical parts of the network. Since the introduction of Tensor Cores in the Volta, Turing, and Ampere architecture, significant training speedups are experienced by switching to mixed precision -- up to 3x overall speedup on the most arithmetically intense model architectures.
5.2. Determining Tensor Core Eligibility
A feature of DLProf that provides feedback on Tensor Core utilization in the model. Tensor Cores are mixed precision floating point operations available for Volta GPUs (Titan V) and beyond. The cuDNN and cuBLAS libraries contain several Tensor Core enabled GPU kernels for most Convolution and GEMM operations.
DLProf determines the Tensor Core eligibility of each operation. Tensor Core usage is determined from executed GPU kernels found in the Nsight Systems profile results.
The NVIDIA DLProf Viewer makes it easy to find and visualize the performance of your models by showing Top 10 operations that took the most time, eligibility of Tensor Core operations and Tensor Core usage, interactive iteration reports. For information on how to use the Viewer, see the NVIDIA DLProf Viewer User Guide.
6.1. Starting the DLProf Viewer
The DLProf Viewer is installed in all containers that DLProf is installed in the NVIDIA GPU Cloud (NGC). The container must be run with the -p8000:8000 option to open port 8000 for the Viewer's server.
The Viewer is launched directly from the container:
$ dlprofviewer <dlprof_database>
Where <dlprof_database> is the name of the DLProf database, usually dlprof_dldb.sqlite. Once running, the data can be viewed in a browser with the URL:
http://<machine IP Address>:8000
An iteration interval is one pass through both forward and backward propagation, for a single batch. DLProf attempts to automatically determine iteration intervals using the NVTX stop times of a key node. A key node is an op node that is executed only once, each iteration, preferably the very first operation of each iteration. Typically this would be GlobalStep, or something similar.
Once the iteration intervals are found, every model operation and kernel call instance are sorted into the intervals. Metrics can be aggregated per interval for specific reports and is an extremely useful aid in locating bottlenecks.
Iteration intervals always start from time 0 and end with the final stopping timestamp in the profile. For N instances of Key Node, the intervals would be:
[0,Node[1].stop-1], [Node[1].stop,Node[2].stop-1], ..., [Node[N].stop, last]
Resulting in N+1 intervals.
Note: If no iterations are found, then the entire profiled model is treated as a single iteration. This will be reflected in the Iteration Report and the Summary Report will show 0 iterations found.
7.1. Specifying the Key Node
By default, DLProf will look for a framework-specific node as the key node. However, not all models will use this default name. If DLProf outputs 0 iterations, then the current key node was not found in the model.
When the default key node is not found, you need to identify and select a new key node with the following command argument:
--key_node=<key_node>
where <key_node> is the name or Op ID of the new key node as listed in the Detailed report.
7.2. Limiting Aggregation to an Iteration Range
DLProf can specify an interval range to use when aggregating the profile data for all of the reports. This is useful to ignore profile data captured during the warm up and tear down phases. To limit the aggregation range, use the following command line arguments:
--iter_start <start_iter> --iter_stop <stop_iter>
The aggregation range is inclusive. All timing data aggregates from iteration <start_iter> to <stop_iter>, including both <start_iter> and <stop_iter>.
The core purpose of DLProf is to correlate NVTX (NVIDIA Tools Extension) annotated results from Nsight Systems profiles with a high-level model description. From here, any number of reports can be created to deliver the profile results in a format familiar to the Data Scientist.
8.1. NVTX Markers in TensorFlow
TensorFlow in the NGC TensorFlow container has been modified to automatically insert NVTX Start/Stop range markers into the execution of the model. The NVTX markers are wrapped around the execution nodes of the model and named exactly the same as the node. Nsight Systems will associate all GPU kernels to the NVTX range that was active when the kernel was scheduled.
Note: The modification to TensorFlow to automatically insert NVTX ranges has not been upstreamed to TensorFlow and is only available in the version of TensorFlow provided in the NGC Tensorflow container.
Since the NVTX name has a 1:1 mapping to a node in the TensorFlow graph, DLProf can correlate kernels to a particular node. DLProf will also associate any metrics gathered for a kernel from Nsight Systems, such as Tensor Core usage, start time, and stop time.
8.2. NVTX Markers in Pytorch
Pytorch does not have built in NVTX ranges around operations. As such, DLProf has to rely on a python pip package called nvidia_dlprof_pytorch_nvtx to add NVTX ranges around the operations.
Data outside of NVTX Markers
For various reasons, not all cuda calls and kernel calls end up being inside of NVTX ranges. In order to capture all the CPU and GPU information from the run, DLProf will create a new op with the name unassociated_<cuda_or_kernel_name>, and will set the operation type to <cuda_or_kernel_name>. All cuda calls or kernel calls of that type that aren’t inside of NVTX ranges will be associated with that “operation”.
8.4. Mapping GPU Time
NVTX ranges are used as the time stamps for the start and end of operations on a CPU thread. This range then becomes synonymous with the CPU time for that instance of the operation. To determine the GPU time, Nsight Systems correlates all of the CUDA API calls to specific NVTX range in which they were called.
CUDA API calls on the CPU thread schedule a corresponding CUDA kernel onto the GPU. A CUDA kernel is a small, parallel function executed on the GPU and makes GPGPU computing possible. Nsight Systems tracks which CUDA API call started each kernel and can correlate the actual execution of the kernel back to the CPU API call and NVTX range.
Nsight Systems has a notion of Mapped GPU Time for each NVTX range. The mapped GPU time starts with the starting time stamp on the GPU for the first kernel from the NVTX range, and stops with the stopping time stamp for the last kernel executed on the GPU from that same NVTX time range.
8.5. Aggregating Time
There are two ways that time is combined when computing statistics:
- Flattening is done by taking multiple time intervals and performing a union, where any intervals that share any time are joined. This eliminates any overlaps from being double counted. This is done when gathering global statistics such as GPU IDLE time, or when gathering parent node statistics from multiple children like the group_node report.
- Accumulating is done by taking multiple time intervals and summing their times together, while keeping a count of how many time intervals have been added. This is used when aggregating multiple instances of a single object, such as the GPU times for all instances of a single kernel or the CPU time for all instances of a single op node. The end result is the calculation of the total/average/min/max statistics that exist in most reports.
In addition to the NVTX markers automatically added by the framework, you can specify custom markers by annotating the model with custom NVTX ranges. This allows statistics and reports to be gathered for parts of the model that you are most interested in.
In order to use custom NVTX markers, you will need to install nvtx-plugins:
$ pip install nvtx-plugins
To run an example model with custom NVTX ranges through DLProf, follow these instructions:
            $ git clone https://github.com/NVIDIA/nvtx-plugins.git \
$ cd nvtx-plugins \
$ dlprof --reports=summary,detail /usr/bin/python  \
examples/tf_session_example.py
That example is annotated with NVTX markers that put the forward pass in a new domain called Forward, and the backward pass in a new domain called Gradient. The result is that a summary and detail report will be created for the Forward domain and the Gradient domain in addition to the default domain reports that encompass the entire model.
For more information on custom NVTX ranges see: https://nvtx-plugins.readthedocs.io/en/latest/.
DLProf supports running multiple GPUs on a single node. Nothing special needs to be done by the user to have DLProf profile a multi-GPU training run.
All “total” metrics reported in output reports are a summation of values across all visible GPUs. The “GPU Utilization” metric is the average GPU Utilization across all visible GPUs (including unused GPUs).
For multi-GPU iteration detection, DLProf assumes data parallelism and looks for the case where there is an equal number of instances of the key node on each GPU. If that is true then DLProf looks at the Nth instance of the key node on each GPU and uses the end of the last one in time order as the splitting point between iterations N-1 and N for the run. If DLProf is not able to find the case of equal number of instances on each GPU, then it falls back to assuming that every instance of the key node on any GPU indicates a new iteration.
DLProf can create several textual reports in both JSON and CSV formats. This section details the available reports that can be created.
11.1. Specifying Reports and Formats
This section discusses how to select which reports will be created and in what file formats.
11.1.1. Selecting Reports
A user may choose to generate reports by passing the report types to the --report option:
--reports=<type1>[,type2][,...]
The following types are allowed:
summary: creates a Summary Reportdetail: creates a Detailed Reportiteration: creates an Iteration Reportkernel: creates a Kernel Reporttensor: creates a Tensor Core Reportnode_op: creates a Node Op Report.group_node: creates a Group Node Report.expert_systems: creates an Expert Systems Report.all: creates all reports in this list
Some usage examples include:
            --reports=kernel,iteration,summary
--reports iteration tensor node_op --
--reports all
11.1.2. Selecting Domains
If the model has been annotated with custom NVTX ranges, then more than one domain will exist in the profile run. By default, DLProf will output the requested reports separately for each domain, including the default domain. If one or more domains are specified using the --domains option, then reports will only be generated for the requested domains:
--domains=<domain1>[,domain2][,...]
11.1.3. Selecting File Formats
By default, DLProf will create a CSV file for each report specified by --report. DLPROF can also output reports in a JSON file format. If multiple formats are selected, then a report will be created in each format, if possible.To specify the output format for the reports, use the --file_formats option:
--file_formats=<opt1>[,opt2][,...]
The following format options are allowed:
csv: a comma-separated file format that can be easily imported into a spreadsheetjson: a JSON file format, useful for importing data into third-party applications
Some usage examples include:
            --file_formats json
--file_formats=csv,json
--file_formats json csv --
11.1.4. Report Names
The file names for the reports are in the following format:
[base_name]_[report_type]_[domain_name].[csv|json]
Where [profile_name] is the name of the profile (as specified by --profile_name, replacing spaces with underscores), [report_type] is the same string passed to --reports to select the report, [domain_name] is the name of the domain (or blank for the default domain), and the final extension is either csv or json, depending on the file format. By default, the profile name is dlprof, but can be changed with:
--profile_name <base_name>
For example, the following options:
--reports=summary,iteration --file_formats=csv,json --domains dom1,dom2
dlprof_summary_dom1.csvdlprof_summary_dom1.jsondlprof_iteration_dom1.csvdlprof_iteration_dom1.jsondlprof_summary_dom2.csvdlprof_summary_dom2.jsondlprof_iteration_dom2.csvdlprof_iteration_dom2.json
11.1.5. Output Path
By default, all reports will be written in the current working directory. However, you may choose a different output directory for reports with:
--output_path <path/to/output>
where <path/to/output> is the new results folder. If the folder does not exist, DLProf will attempt to create it.
11.2. Summary Report
The Summary Report provides high level metrics on the performance results of all the operations and kernels in the entire model. This report contains several individual tables.
System config
This table provides configuration of the system used to profile the model.
| Row Name | Description |
| Profile Name | The user-specified name of the profile (hidden if unspecified) |
| GPU Count | The number of GPUs found while profiling. |
| GPU Name(s) | The name for each GPU found while profiling. |
| CPU Model | The CPU model used to profile. |
| GPU Driver Version | The version of the GPU Driver found while profiling. |
| Framework | The framework/version found while profiling. |
| CUDA Version | The version of CUDA found while profiling. |
| cuDNN Version | The version of cuDNN found while profiling. |
| NSys Version | The version of Nsight Systems found while profiling. |
| DLProf Version | The version of DLProf used to profile. |
| DLProf Build | The build ID for DLProf used to profile. |
| Row Name | Description |
| Wall Clock Time (ns) | Total wall clock time for the found iteration range. |
| Tensor Core Kernel Utilization % | 100 * (Time of Tensor Core Kernels) / (Total time of all kernels in Tensor Core eligible nodes). Higher is better. |
| GPU Utilization % | Percent of the time that the GPU is active. In the case of a multi-gpu run, it is the average of all visible GPU utilizations. |
| Tensor Core Kernel Duration % | Percent of the time Tensor Core kernels are active. In the case of a multi-gpu run, it is the average of all visible GPUs. |
| Non-Tensor Core Kernel Duration % | Percent of the time Non-Tensor Core kernels are active, while Tensor Core kernels are inactive. In the case of a multi-gpu run, it is the average of all visible GPUs. |
| Memory Duration % | Percent of the time Memory kernels are active, while TC and non-TC kernels are inactive. In the case of a multi-gpu run, it is the average of all visible GPUs. |
| CPU Duration % | Percent of the time CPU is active while TC, non-TC and Memory kernels are inactive. In the case of a multi-gpu run, it is the average of all visible GPUs. |
| Other Duration % | Percent of the time TC, non-TC, memory, and CPU kernels are inactive. In the case of a multi-gpu run, it is the average of all visible GPUs. |
Iterations
This table provides information on the number of iterations found and aggregated.
| Row Name | Description |
| Total Iterations | The total number of iterations found based on the number of unique key node operation instances. |
| Aggregated Iterations | The total number of iterations used to aggregate the profile data over and used to generate report data. |
| Start Iteration | The starting iteration in the aggregated iteration range. |
| Stop Iteration | The stopping iteration in the aggregated iteration range. |
| Average Iteration Time (ns) | The average time for all aggregated iterations in nanoseconds. |
| Iteration Time Standard Deviation (ns) | The standard deviation for all aggregated iterations in nanoseconds. |
All Ops
This table provides a high level breakdown of all operations found in the model.
| Row Name | Description |
| All Op | Total metrics for all operations aggregated. |
| Ops Using TC | Total metric for operations that use Tensor Core kernels. |
| Op eligible for TC but not using | Total metrics for operations that are eligible to use Tensor Core kernels but are currently not using any. |
| All other ops | Total metrics for all other operations. |
| Column Name | Description |
| GPU Time (ns) | Total time of all kernels for the operation spent executing on the GPU. |
| CPU Time (ns) | Total time for the operation spent executing on the CPU. |
| # Ops | The number of unique operations found in this category. |
All Kernels
This table provides a high level breakdown of all kernels found in the model.
| Row Name | Description |
| All Kernels | Total metrics for all kernels found. |
| Kernels Using TC | Total metric for kernels that use Tensor Core enabled operations. |
| Memory | Total metrics for memory based kernels, including device-to-device, device-to-host, and host-to-device. |
| All other kernels | Total metrics for all other kernels. |
| Column Name | Description |
| GPU Time (ns) | Total time of all kernels spent executing on the GPU. |
| CPU Time (ns) | Total time on the CPU spent calling the CUDA API for these kernels. |
| # Kernels | The number of unique kernels found in this category. |
11.3. Detailed Report
The Detailed Report contains correlated information for every group node, leaf node, and kernel executed in the profile. The report contains the GPU and CPU time metrics, kernel counts, and whether Tensor Core are used in the node. By sorting this report, a user can identify the top N GPU/CPU nodes, and identify quickly which operations can use and are using Tensor Cores.
Each row in the table represents a unique operation in the model as determined by an NVTX range. The report contains the following columns:
| Column name | Description |
|---|---|
| Op ID | An ID string that uniquely identifies the operation and can be used to associate other report data with this one. The string is based on a combination of the op type and direction. |
| Op Name | Name of the op. |
| Direction | The direction (fprop vs bprop) of the op. This column only exists for PyTorch runs. |
| Op Type | The operation type. |
| No. Calls | Number of instances that the operation was called / executed. |
| TC Eligibility | Indicates if the node can use Tensor Cores based on operation name. |
| Using TC | Indicates if a Tensor Core enabled kernel was used by the node. |
| Total CPU Time (ns) | The total CPU time of all instances of the node. |
| Avg. CPU Time (ns) | The average CPU time of all instances of the node. |
| Min CPU Time (ns) | The minimum CPU time found amongst all instances of the node. |
| Max CPU Time (ns) | The maximum CPU time found amongst all instances of the node. |
| Total GPU Time (ns) | The total GPU time of all instances of the node. |
| Avg. GPU Time (ns) | The average GPU time of all instances of the node. |
| Min GPU Time (ns) | The minimum GPU time found amongst all instances of the node. |
| Max GPU Time (ns) | The maximum GPU time found amongst all instances of the node. |
| Total CPU Overhead Time (ns) | The total CPU overhead of all instances of the node. |
| Avg. CPU Overhead Time (ns) | The average CPU overhead of all instances of the node. |
| Min CPU Overhead Time (ns) | The minimum CPU overhead found amongst all instances of the node. |
| Max CPU Overhead Time (ns) | The maximum CPU overhead found amongst all instances of the node. |
| Total GPU Idle Time (ns) | The total GPU idle time of all instances of the node. |
| Avg. GPU Idle Time (ns) | The average GPU idle time of all instances of the node. |
| Min GPU Idle Time (ns) | The minimum GPU idle time found amongst all instances of the node. |
| Max GPU Idle Time (ns) | The maximum GPU idle time found amongst all instances of the node. |
| Data Type | The data type of the operation. This column won’t exist if the user specifies detailed_mode=false. |
| Input Shapes | A list of shapes for all inputs into the operation. This column won’t exist if the user specifies detailed_mode=false. |
| Stack Trace | The stack trace of the code that ran this op. This column only exists for PyTorch runs. |
CPU overhead is the time spent within the NVTX range that is not attributed to the CUDA API call. GPU idle time is the time between GPU kernel operations for a node when the GPU is not executing a kernel.
11.4. Iteration Report
The Iteration Report lists each kernel executed for every node and on every iteration. The kernel start time has been included as well, so the table can be sorted chronologically by kernels. Each row in the iteration report represents an instance of a kernel call. The report contains the following columns:
| Column Name | Description |
|---|---|
| Iteration | The iteration interval number that the kernel was launched. |
| Op ID | An ID string that uniquely identifies the operation and can be used to associate other report data with this one. The string is based on a combination of the op type and direction. |
| Op Name | The name of the node / NVTX range that call the kernel. |
| Direction | The direction (fprop vs bprop) of the op. This column only exists for PyTorch runs. |
| Op Type | The operation type. |
| Kernel Name | The name of the GPU kernel. |
| Device ID | The device ID of the GPU kernel. |
| GPU Start Time (ns) |
The time stamp for when the kernel began executing on the GPU. |
| GPU Time (ns) |
The time spent on the GPU executing the kernel. |
| API Call Start (ns) | The time stamp for when the kernel was called by the CPU. |
| API Call Time (ns) | The time spent on the CPU making the CUDA API call. |
| Uses TC | True if the kernel uses Tensor Cores. |
| Grid X | The x dimension of the grid size of the kernel. |
| Grid Y | The y dimension of the grid size of the kernel. |
| Grid Z | The z dimension of the grid size of the kernel. |
| Block X | The x dimension of the block size of the kernel. |
| Block Y | The y dimension of the block size of the kernel. |
| Block Z | The z dimension of the block size of the kernel. |
| Data Type | The data type of the op calling this kernel. |
| Input Shapes | The input shapes of the op calling this kernel. |
| Long Kernel Name | The full kernel name from the database. |
See Iteration Detection for more information on how to specify iteration intervals.
11.5. Kernel Report
The Kernel Report lists all the kernels launched in the network. Unlike the Iteration Report, this report contains an entry in the report for each unique kernel and provides timing metrics for instances of that kernel. The report contains the following columns:
| Column | Description |
|---|---|
| Kernel Name | The name of the GPU kernel. |
| Op ID | An ID string that uniquely identifies the operation and can be used to associate other report data with this one. The string is based on a combination of the op type and direction. |
| Op Name | The name of the op that call the kernel. |
| Direction | The direction (fprop vs bprop) of the op. This column only exists for PyTorch runs. |
| Uses TC | True if the kernel uses Tensor Cores. |
| Total GPU Time (ns) | The total GPU time for all instances of the node. |
| Avg. GPU Time (ns) | The average GPU time for all instances of the node. |
| Min GPU Time (ns) | The minimum GPU time found amongst all instances of the node. |
| Max GPU Time (ns) | The maximum GPU time found amongst all instances of the node. |
| Total API Time (ns) | The total CPU time spent on CUDA API call for all instances of the node. |
| Avg. API Time (ns) | The average CPU time spent on CUDA API for all instances of the node. |
| Min API Time (ns) | The minimum CPU time spent on CUDA API found amongst all instances of the node. |
| Max API Time (ns) | The maximum CPU time spent on CUDA API found amongst all instances of the node. |
11.6. Tensor Core Report
The Tensor Core Report lists all Tensor Core eligible operations and details about their Tensor Core usage. The report contains the following columns:
| Column | Description |
|---|---|
| Op ID | An ID string that uniquely identifies the operation and can be used to associate other report data with this one. The string is based on a combination of the op type and direction. |
| Op Name | The name of the node / NVTX range that call the kernel. |
| Direction | The direction (fprop vs bprop) of the op. This column only exists for PyTorch runs. |
| Op Type | The operation type. |
| Uses TC | True if the node uses Tensor Cores. |
| Total GPU Time | The total GPU time for all instances of the node. |
| TC GPU Time | The GPU time executing Tensor Cores for all instances of the node. |
| Non-TC GPU Time | The GPU time not executing Tensor Cores for all instances of the node. |
| TC Utilization (%) | 100 * (TC GPU Time) / (Total GPU Time) |
| Total Kernel Count | The total number of unique kernels executed by the node. |
| TC Kernel Count | The total number of unique kernels that use Tensor Cores for this node. |
| TC Kernel Names | A list of all the names of kernels using Tensor Cores for this node. |
| Non-TC Kernel Count | The total number of unique kernels that do not useTensor Cores for this node. |
| Non-TC Kernel Names | A list of all the names of kernels are not using Tensor Cores for this node. |
11.7. Op Type Summary Report
This report lists op types in the network. For each op type, the CPU and GPU times are flattened and rolled up. Statistical values are calculated across the individual instances to find the total sum, average, minimum, and maximum values for each measured metric. The report generates a table with the following columns:
| Column name | Description |
|---|---|
| Op Name | The operation name. |
| No. Nodes | The total number of nodes operation is included in. |
| No. Calls | Number of instances that the operation was called / executed. |
| TC Eligibility | Indicates if the node can use Tensor Cores based on operation name. |
| Using TC | Indicates if a Tensor Core enabled kernel was used by the node. |
| Total CPU Time (ns) | The total CPU time of all instances of the node. |
| Avg. CPU Time (ns) | The average CPU time of all instances of the node. |
| Min CPU Time (ns) | The minimum CPU time found amongst all instances of the node. |
| Max CPU Time (ns) | The maximum CPU time found amongst all instances of the node. |
| Total GPU Time (ns) | The total GPU time of all instances of the node. |
| Avg. GPU Time (ns) | The average GPU time of all instances of the node. |
| Min GPU Time (ns) | The minimum GPU time found amongst all instances of the node. |
| Max GPU Time (ns) | The maximum GPU time found amongst all instances of the node. |
| Total CPU Overhead Time (ns) | The total CPU overhead of all instances of the node. |
| Avg. CPU Overhead Time (ns) | The average CPU overhead of all instances of the node. |
| Min CPU Overhead Time (ns) | The minimum CPU overhead found amongst all instances of the node. |
| Max CPU Overhead Time (ns) | The maximum CPU overhead found amongst all instances of the node. |
| Total GPU Idle Time (ns) | The total GPU idle time of all instances of the node. |
| Avg. GPU Idle Time (ns) | The average GPU idle time of all instances of the node. |
| Min GPU Idle Time (ns) | The minimum GPU idle time found amongst all instances of the node. |
| Max GPU Idle Time (ns) | The maximum GPU idle time found amongst all instances of the node. |
11.8. Group Node Report
The Group Node Report lists all non-leaf nodes in the network. For each non-leaf node, it flattens and rolls up all statistics from its sub-tree. All metrics are calculated on a per-iteration basis. The report contains the following columns:
| Column name | Description |
|---|---|
| Name | The name (hierarchy) of the sub-tree. |
| No. Calls Aggregated | Total number of leaf node instances in this sub-tree. |
| No. TC Eligibility Ops | Total number of leaf nodes in this sub-tree that are eligible to use Tensor Cores. |
| No. Node Ops Using TC | Total number of leaf nodes in this sub-tree that use Tensor Cores. |
| Total CPU Time (ns) | The total CPU time of all instances of the sub-tree. |
| Avg. CPU Time (ns) | The average CPU time for all instances of the sub-tree on a per-iteration basis. |
| Min CPU Time (ns) | The minimum CPU time for all instances of the sub-tree on a per-iteration basis. |
| Max CPU Time (ns) | The maximum CPU time for all instances of the sub-tree on a per-iteration basis. |
| Total GPU Time (ns) | The total GPU time for all instances of the sub-tree. |
| Avg. GPU Time (ns) | The average GPU time for all instances of the sub-tree on a per-iteration basis. |
| Min GPU Time (ns) | The minimum GPU time for all instances of the sub-tree on a per-iteration basis. |
| Max GPU Time (ns) | The maximum GPU time for all instances of the sub-tree on a per-iteration basis. |
| Total CPU Overhead Time (ns) | The total CPU overhead time for all instances of the sub-tree. |
| Avg. CPU Overhead Time (ns) | The average CPU overhead time for all instances of the sub-tree on a per-iteration basis. |
| Min CPU Overhead Time (ns) | The minimum CPU overhead time for all instances of the sub-tree on a per-iteration basis. |
| Max CPU Overhead Time (ns) | The maximum CPU overhead time for all instances of the sub-tree on a per-iteration basis. |
| Total GPU Idle Time (ns) | The total GPU idle time for all instances of the sub-tree. |
| Avg. GPU Idle Time (ns) | The average GPU idle time for all instances of the sub-tree on a per-iteration basis. |
| Min GPU Idle Time (ns) | The minimum GPU idle time for all instances of the sub-tree on a per-iteration basis. |
| Max GPU Idle Time (ns) | The maximum GPU idle time for all instances of the sub-tree on a per-iteration basis. |
11.9. Expert Systems Report
The expert systems report will list all of the problems detected by Expert Systems and give actionable feedback for how to resolve the potential problems. The report contains the following columns:
| Column Name | Description |
|---|---|
| Problem | The potential problem that was discovered. |
| Recommendation | The recommended action to take to try to resolve the problem. |
11.10. Expert Systems
Expert Systems is a feature (currently in beta) that analyzes the model and the profile data to detect potential problems or inefficiencies. Any problems detected will come with a recommendation of action for you to attempt to resolve the issue. The results can be found by enabling the Expert Systems Report.
Expert Systems contains a number of problem detectors. Each detector will look for a specific problem. More detectors are planned in the future. Here is the current list of detectors and what they look for:
| Name | Problem Detected | Frameworks |
|---|---|---|
| Bad Iteration Range Detector | Detects the case when the Iteration Range contains a lot of variations between iterations, and recommends an ideal range if one is detected. | All |
| No Iteration Detector | Detects the case where no iterations are found because the Key Node is unspecified or invalid. | All |
| Bad Tensor Shape Detector | Detects the case where tensor cores are not used because of bad tensor shape or data type in the model. | Tensorflow |
| No Fusion Detector | Detects the case where fusion is disabled. | Tensorflow 1.x |
| AMP Detector | Detects the case where AMP is not used. | Pytorch, Tensorflow |
| Dataloader Detector | Detects when a significant portion of the run is spent in the dataloader. | Pytorch |
| Cudnn Benchmark Detector |
Detects if |
Pytorch |
| Slow Api Detector |
Detects if any of the following are set to True in the pytorch framework:
|
Pytorch |
| Imbalanced GPU Detector | Detects when one or more GPUs is used significantly less than other GPUs. | All |
| Underutilized GPU Detector | Detects when one or more GPUs is unused or overall GPU utilization is below 50%. |
All |
| Batch Size Detector | Detects cases where the batch size isn't large enough to utilize the available memory in the GPU. | PyTorch, TensorFlow |
| Emit NVTX Missing Detector | Detects if Pytorch emit_nvtx was not used. | PyTorch |
12.1. Op Names
The op names as listed in various reports are created based on the function call hierarchy that lead to the operation being executed. Multiple function calls of the same name from the same source function will have a number added to the end to distinguish between them. For example, if a network had a function “a”, which calls function “b” twice, and function “b” executes two different “conv1d” operations, then the following 4 op names would be created:
- /a/b/conv1d
- /a/b/conv1d(2)
- /a/b(2)/conv1d
- /a/b(2)/conv1d(2)
12.2. Op ID
It is rare but possible for multiple operations to have the exact same op name in PyTorch. As a result, whenever trying to identify a unique operation it is best to use the Op ID, which is available in most output reports.
12.3. Op Direction
As long as the source script wraps the training with torch.autograd.profiler.emit_nvtx(), then forward and backwards passes of the operations will be distinguished. The forward pass of an operation will be listed in reports with “fprop” in the direction field. The backward pass of the operation will have the same op name, but will have “bprop” in the direction field.
If the source script does not wrap the training with torch.autograd.profiler.emit_nvtx(), then forward pass will still be collected as usual, but the backward pass of all operations will be combined into a single operation with op type of “backward”.
When profiling any computer program, the objective is to inspect its code to determine if performance can be improved. In DLProf, profiling determines if GPUs are being fully utilized to take advantage of the hardware optimization. Typically, profiling is done at the time of training a model, so that adjustments can be made based on the results. DLProf can be used to understand how a deep learning model is performing with respect to the Tensor Core hardware. Objectives may be summarized as follows:
- Determine how the deep learning model performed in terms of GPU utilization time and percent usage as a summary.
- Understand the prominent nodes where optimization with mixed precision is possible.
- Drill down into the prominent node to understand individual operations and their correlation with Tensor Core compatibility.
- Get deeper insights into Kernel level information, which kernels are using Tensor Cores, for how long and what percent of the entire run.
13.1. How do I profile a deep learning network?
Start with downloading the NGC TensorFlow container.
Issue the dlprof command to profile training run. Nvidia recommends running the model for under 5 minutes.
13.2. How can I improve my network if I’m not using Tensor Cores?
Navigate to the Top 10 Op Nodes in the DLProf Viewer and sort by GPU. Find the longest running Op Node in the last that is eligible for Tensor Cores, but is not using Tensor Cores. In the python code, find out if operations that are running in floating point 32 mode can be switched to floating point 16. Use Automatic Mixed Precision to automatically change operations to use mixed precision operations wherever safe. By optimizing the model to use Tensor Cores, you will speed up the performance of training.
13.3. How do I find a good Key Node?
Using a good node for the key op is essential to maximize the analysis at a per iteration step level. By default, DLProf will use a key node that is found by default in most framework models. However this is not always the case and there may be models that the node operation does not exist. In this event, DLProf will alert the user to find a new key node.
First, run the profile as normal, making sure to save the generated SQL database and the Detailed Report. If possible, try to limit the number of steps executed, such as running only 20 batches.
$ dlprof --reports=detail python my_script.pl
In the detail report, sort the data by "No. Calls". Choose a node operation that has "No. Calls" value that is close to the same number of steps executed in the script. You will also want to choose the operation that occurs as close to the start of the iteration step as possible. This may require analyzing the graph or script.
When a node has been selected, you can re-run DLProf on the previous profile to specify the new Key Node without re-profiling the model.
$ dlprof --key_node=[<op_name_or_op_ID>] --database=[dbdlprof.sqlite]
DLProf should now show more than one iteration found and the Iteration Report will provide a GPU usage breakdown per iteration.
13.4. How do I choose a good iteration range to analyze?
By default, DLProf aggregates the data for all iterations found in the profile. However, this may not provide an accurate representation of the stabilized run-time performance. Most frameworks will typically have special warm-up and tear-down iteration, which can dramatically throw off the overall results. For a standard non-RNN network, iterations should have little time variation.
To find an ideal set of iteration, run the profile as normal, but generate an Iteration Report and save the generated SQL database.
dlprof --reports=iteration python my_script.pl
It should be trivial to view the iteration report in a spreadsheet application. A simple bar chart on the iteration times can expose an iteration range that has consistent time. Note the starting and stopping iteration number in this range. DLProf can then be re-ran using this new range and the existing SQL database to quickly re-aggregate the results over that range.
dlprof --iter_start=[<start iter>] --iter_stop=[<stop_iter>] --database=[dbdlprof.sqlite]
All reports will then be generated from data gathered only between and including these two iterations.
The following tutorial examples are run within the NGC TensorFlow container. See Profiling from the NGC TensorFlow Container for instructions on how to setup and run the container.
14.1. Resnet50
This is an example of running DLProf to profile Resnet50 model (resnet50_v1.5) located in the/workspace/tensorflow-examples/models directory of the NGC TensorFlow container.
14.1.1. Preparing the Example
- Copy training data locally to
/path/to/training/dataTraining data can be downloaded from ImageNet. - Run the NGC TensorFlow container, mapping the training data and result data directories.
            docker run --rm --gpus=1 --shm-size=1g --ulimit memlock=-1 \
  --ulimit stack=67108864 -it -p8000:8000 -v<path/to/training/data>:/data \
  -v<path/to/results>:/results nvcr.io/nvidia/tensorflow:21.07-tf1-py3
- Enable profiling of Pytorch (using
nvidia_dlprof_pytorch_nvtx)
14.1.2. Profiling Resnet50
To profile with DLProf, use the command shown below. This command will profile over the training data and generate detailed reports in addition to DLProf database.
            $ cd /workspace/nvidia-examples/resnet50v1.5
$ mkdir results
$ dlprof --reports=summary,detail,iteration \
--iter_start 20 --iter_stop 80 \
/usr/bin/python main.py \
--mode=train --iter_unit=batch --num_iter=100 \
--batch_size=128  --warmup_steps=1 --use_cosine_lr \
--label_smoothing 0.1 --lr_init=0.256 --lr_warmup_epochs=8 \
--momentum=0.875 --weight_decay=3.0517578125e-05 --use_tf_amp \
--data_dir=/data/train-val-tfrecord-480 --results_dir=./results
This command profiles 100 batches of the NVIDIA Resnet50 example using Automatic Mixed Precision (AMP). There will be three output report files in /workspace/nvidia-examples/resnet50v1.5.
- dlprof_summary.csv - The summary report
- dlprof_detailed.csv - The detailed node report
- dlprof_iteration.csv - The detailed iteration report
14.1.3. Viewing Results in DLProf
DLProf database file dlprof_dldb.sqlite will end up in /workspace/nvidia-examples/resnet50v1.5. The results can be visualized in the DLProf Viewer.
$ dlprofviewer /workspace/nvidia-examples/resnet50v1.5/dlprof_dldb.sqlite
To view the results, enter http://<IP Address>:8000 in a browser.
14.2. MobileNet
Here's an example of running DLProf to profile MobileNetV2 from TensorFlow.
14.2.1. Preparing the Example
- Copy training data locally to
/path/to/training/dataTraining data can be downloaded from ImageNet http://image-net.org/download
- Run the NGC TensorFlow docker container, and mapping the training data and result data directories.
            docker run --rm --gpus=1 --shm-size=1g --ulimit memlock=-1 \
--ulimit stack=67108864 -it -p8000:8000 -v<path/to/training/data>:/data \
-v<path/to/results>:/results nvcr.io/nvidia/tensorflow:21.07-tf1-py3
- In the docker container, install the TensorFlow benchmarks into
/workspacemkdir /workspace/tensorflow-examples && \ cd /workspace/tensorflow-examples && \ git clone https://github.com/tensorflow/models.git && \ git clone https://github.com/tensorflow/benchmarks.git && \ cd benchmarks && \ git checkout cnn_tf_v1.15_compatible && \ export PYTHONPATH=/workspace/tensorflow-examples/models && \ cd /workspace/tensorflow-examples/benchmarks/scripts/tf_cnn_benchmarks
14.2.2. Profiling MobileNet
The following command line is the minimum needed to profile the model and generate an event file.
            dlprof \
/usr/bin/python tf_cnn_benchmarks.py \
--num_gpus=1 --batch_size=256 --model=mobilenet --device=gpu --gpu_indices=1 \
--data_name=imagenet --data_dir=/data/train-val-tfrecord-480 \
--num_batches=50 --use_fp16 --fp16_enable_auto_loss_scale
14.2.3. Viewing Results in DLProf Viewer
The following command line will launch DLProf Viewer:
$ dlprofviewer ./dlprof_dldb.sqlite
To view the results, enter http://<IP Address>:8000 in a browser.
14.3. Pytorch
This demonstrates how to use DLProf to profile a deep learning model, using Pytorch, visualize the results, using the DLProf Viewer, and finally improve the model using the provided recommendations.
14.3.1. Preparing the Example
- Copy training data locally to
/path/to/training/data. Training data can be downloaded from ImageNet - Run the NGC TensorFlow container, using Pytorch, and map the training data and result data directories
            $ docker run --rm --gpus=1 --shm-size=1g --ulimit memlock=-1 \
  --ulimit stack=67108864 -it -p8000:8000 -v<path/to/training/data>:/data \
  -v<path/to/results>:/results nvcr.io/nvidia/pytorch:21.07-tf1-py3
- Enable profiling of PyTorch (using
nvidia_dlprof_pytorch_nvtx).
14.3.2. Profiling Unoptimized Resnet
The following command will profile and create the DLProf database:
            $ dlprof -f true --reports=summary,detail,iteration,kernel,tensor \
--delay 60 --duration 60 python /workspace/examples/resnet50v1.5/main.py \
--arch resnet50 -b 16 --training-only  --raport-file benchmark.json \
--epochs 90 --prof 100 /data/imagenet
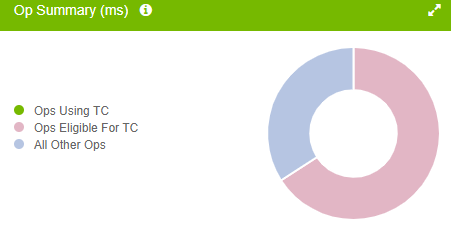
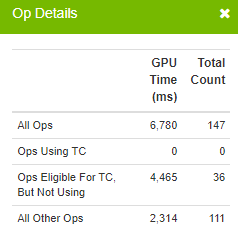
14.3.3. Starting DLProf Viewer and Analyzing the Results
The following command line will launch the viewer:
$ dlprofviewer /workspace/examples/resnet50v1.5/dlprof_dldb.sqlite
To view the results, enter http://<IP Address>:8000 in a browser.
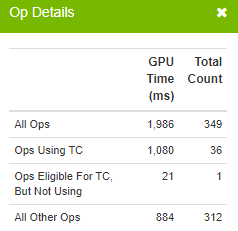
The results indicate that a large percentage of ops are Tensor Core eligible, but are not utilizing the Tensor Cores:
|
|
Two problems are listed with recommended solutions:
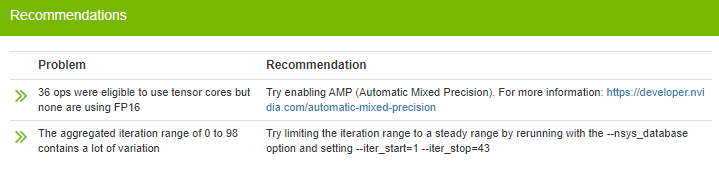
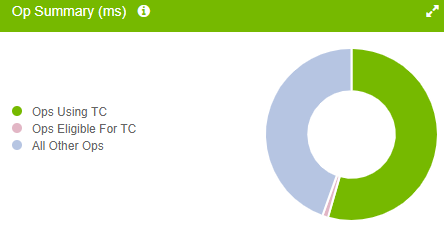
14.3.4. Profiling Optimized Resnet
Using the above recommendations, we can constrain the iteration range and enable AMP, with the following command:
            $ dlprof -f true --reports=summary,detail,iteration,kernel,tensor \
  --delay 60 --duration 60 --iter_start=47 --iter_stop=111 python \
/workspace/examples/resnet50v1.5/main.py --arch resnet50 -b 16 \
--training-only --raport-file benchmark.json --epochs 90 --prof 100 --amp \
--static-loss-scale 256 /data/imagenet
Relaunching the Viewer and examining the results, you will see the majority of previously eligible ops are now using Tensor Cores:
|
|
15.1. Error loading libnvidia-ml.so.1
If you get this error:
            dlprof: error while loading shared libraries: libnvidia-ml.so.1: cannot open
shared object file: No such file or directory
You may not meet the prerequisite drivers and CUDA version. Update your driver and CUDA SDK to match the minimal versions needed for this release.
The following section contains additional reference material.
16.1. Command Line Options
DLProf command lines can have one of two forms:
dlprof [optional switch_options] [application] [optional application_options]
or
dlprof [optional swith_options] --database=dbdlprof.sqlite
All command line options are case sensitive. For optional switch options, when short options are used, the parameters should follow the switch after a space; e.g. -m simple. When long options are used, the switch should be followed by an equal sign and then the parameter(s); e.g.--mode=simple.
Not all command line switch options and features are available for every mode and framework build. Please refer todlprof --help for the complete list of available switch options for a specific framework build.
16.1.1. CLI Global Options
The following options are available for every mode and framework build, unless otherwise specified.
| Global Options Short | Global Options Long | Description |
| -h | --help | Help message providing information about available command switches and their options. |
| -V | --version | Output DLProf CLI version information. |
| Generic Option Short | Generic Option Long | Possible Parameters | Default | Description |
| -f | --force | true, false | false | If true, overwrite all existing result files with the same output filename (QDSTREM, QDREP, SQLITE, CSV, JSON). |
| -v | --verbosity | quiet, minimal, normal, detailed, diagnostic | normal | Specify the output verbosity level. |
| -m | --mode | simple, tensorflow1, tensorflow2, tensorrt,pytorch | build dependent | Specify the target framework being profiled. Use 'simple' to generate only high level metrics agnostic to any framework. Use all other options to generate detailed metrics and reports specific to the framework. |
The mode options and availability is dependent on the specific container build. For a simple mode only build, the --mode switch is not available and defaults to 'simple'. For all other framework specific builds, the default mode is the target framework; e.g. 'tensorflow1' for the DLProf built for the TensorFlow 1.x NGC container. All framework specific builds will always have the option to run in simple mode.
16.1.2. Nsight System Options
The following Nsight System options are available for all profile modes unless otherwise specified.
| Short | Long | Possible Parameters | Default | Description |
| --database | < database filename > | NA | Input SQLITE file. It can be the one generated by Nsight Systems or the one createe by DLProf. When specified, DLProf will aggregate profile data directly from the database. If specified, additional application commands are ignored and the application will not be profiled. | |
| --nsys_base_name | [ base name ] | nsys_profile | Specify the base name for all Nsight Systems output files. | |
| --nsys_options | "[<nsys args>]" | "-t cuda,nvtx -s none" | Customize the args passed to Nsight Systems. Option must include the default for DLProf to operate correctly. | |
| -y | --delay | < seconds > | 0 | Collection start delay in seconds. |
| -d | --duration | < seconds > | NA | Collection duration in seconds, duration must be greater than zero. |
| --detailed_mode | true, false | true | Gather detailed NVTX information, including tensor shapes and data types. |
Note:--detailed_mode is a feature that is only available in tensorflow1 and tensorflow2 operation mode, or in the TensorFlow NGC containers. This feature is enabled by default and will add more information to the NVTX markers which may increase profiling overhead.
Setting custom Nsight Systems options requires surrounding the custom options in quotes, e.g. --nsys_options="-t cuda,nvtx -s none".
16.1.3. Data Aggregation Options
Data aggregation options are not available in simple mode or the simple mode only builds of DLProf.
| Short | Long | Possible Parameters | Default | Description |
| --key_node | < op name or op ID > | global_step | Iteration intervals are determined from the NVTX start times of each key node instance. If DLProf is not detecting intervals correctly, try specifying a different key node. | |
| --iter_start | < iteration number > | 0 | Set the iteration interval to start aggregating data. Profile data from iteration intervals less than the starting interval are excluded from all aggregated reports. | |
| --iter_stop | < iteration number > | NA | Set the iteration interval to stop aggregating data. Profile data from iteration intervals greater than the stopping interval are excluded from all aggregated reports. The stop iteration number must be greater than or equal to the start iteration. |
16.1.4. Output Report Options
Unless specified, the following output report options are available in all modes and builds.
| Short | Long | Possible Parameters | Default | Description |
| --output_path | < path > | ./ | Specify the output path for all generated aggregated collateral. | |
| --base_name | < profile name > | dlprof | Specify a name for the profile that is prepended to all generated report file names and displayed in the Viewer. | |
| --reports | summary, detail, kernel, iteration, tensor, op_type, group_node, expert_systems | NA | Select the aggregated report(s) to generate. Multiple reports can be selected, separated by commas only (no spaces). | |
| --formats | csv, json | csv | Specify output file format(s). Multiple formats can be selected, separated by commas only (no spaces). A separate report is created for each file format. | |
| --domains | < domain list > | All | Specify NVTX domains to aggregate. Multiple domains can be selected, separated by commas only (no spaces). Every requested report is created for each specified domain. | |
| --dump_model_data | true, false | false | If true, a json file is created that contains the raw, correlated model data. |
Note: The only available report type for simple mode is 'kernel'.
Notice
This document is provided for information purposes only and shall not be regarded as a warranty of a certain functionality, condition, or quality of a product. NVIDIA Corporation (“NVIDIA”) makes no representations or warranties, expressed or implied, as to the accuracy or completeness of the information contained in this document and assumes no responsibility for any errors contained herein. NVIDIA shall have no liability for the consequences or use of such information or for any infringement of patents or other rights of third parties that may result from its use. This document is not a commitment to develop, release, or deliver any Material (defined below), code, or functionality.
NVIDIA reserves the right to make corrections, modifications, enhancements, improvements, and any other changes to this document, at any time without notice.
Customer should obtain the latest relevant information before placing orders and should verify that such information is current and complete.
NVIDIA products are sold subject to the NVIDIA standard terms and conditions of sale supplied at the time of order acknowledgement, unless otherwise agreed in an individual sales agreement signed by authorized representatives of NVIDIA and customer (“Terms of Sale”). NVIDIA hereby expressly objects to applying any customer general terms and conditions with regards to the purchase of the NVIDIA product referenced in this document. No contractual obligations are formed either directly or indirectly by this document.
NVIDIA products are not designed, authorized, or warranted to be suitable for use in medical, military, aircraft, space, or life support equipment, nor in applications where failure or malfunction of the NVIDIA product can reasonably be expected to result in personal injury, death, or property or environmental damage. NVIDIA accepts no liability for inclusion and/or use of NVIDIA products in such equipment or applications and therefore such inclusion and/or use is at customer’s own risk.
NVIDIA makes no representation or warranty that products based on this document will be suitable for any specified use. Testing of all parameters of each product is not necessarily performed by NVIDIA. It is customer’s sole responsibility to evaluate and determine the applicability of any information contained in this document, ensure the product is suitable and fit for the application planned by customer, and perform the necessary testing for the application in order to avoid a default of the application or the product. Weaknesses in customer’s product designs may affect the quality and reliability of the NVIDIA product and may result in additional or different conditions and/or requirements beyond those contained in this document. NVIDIA accepts no liability related to any default, damage, costs, or problem which may be based on or attributable to: (i) the use of the NVIDIA product in any manner that is contrary to this document or (ii) customer product designs.
No license, either expressed or implied, is granted under any NVIDIA patent right, copyright, or other NVIDIA intellectual property right under this document. Information published by NVIDIA regarding third-party products or services does not constitute a license from NVIDIA to use such products or services or a warranty or endorsement thereof. Use of such information may require a license from a third party under the patents or other intellectual property rights of the third party, or a license from NVIDIA under the patents or other intellectual property rights of NVIDIA.
Reproduction of information in this document is permissible only if approved in advance by NVIDIA in writing, reproduced without alteration and in full compliance with all applicable export laws and regulations, and accompanied by all associated conditions, limitations, and notices.
THIS DOCUMENT AND ALL NVIDIA DESIGN SPECIFICATIONS, REFERENCE BOARDS, FILES, DRAWINGS, DIAGNOSTICS, LISTS, AND OTHER DOCUMENTS (TOGETHER AND SEPARATELY, “MATERIALS”) ARE BEING PROVIDED “AS IS.” NVIDIA MAKES NO WARRANTIES, EXPRESSED, IMPLIED, STATUTORY, OR OTHERWISE WITH RESPECT TO THE MATERIALS, AND EXPRESSLY DISCLAIMS ALL IMPLIED WARRANTIES OF NONINFRINGEMENT, MERCHANTABILITY, AND FITNESS FOR A PARTICULAR PURPOSE. TO THE EXTENT NOT PROHIBITED BY LAW, IN NO EVENT WILL NVIDIA BE LIABLE FOR ANY DAMAGES, INCLUDING WITHOUT LIMITATION ANY DIRECT, INDIRECT, SPECIAL, INCIDENTAL, PUNITIVE, OR CONSEQUENTIAL DAMAGES, HOWEVER CAUSED AND REGARDLESS OF THE THEORY OF LIABILITY, ARISING OUT OF ANY USE OF THIS DOCUMENT, EVEN IF NVIDIA HAS BEEN ADVISED OF THE POSSIBILITY OF SUCH DAMAGES. Notwithstanding any damages that customer might incur for any reason whatsoever, NVIDIA’s aggregate and cumulative liability towards customer for the products described herein shall be limited in accordance with the Terms of Sale for the product.
VESA DisplayPort
DisplayPort and DisplayPort Compliance Logo, DisplayPort Compliance Logo for Dual-mode Sources, and DisplayPort Compliance Logo for Active Cables are trademarks owned by the Video Electronics Standards Association in the United States and other countries.
HDMI
HDMI, the HDMI logo, and High-Definition Multimedia Interface are trademarks or registered trademarks of HDMI Licensing LLC.
OpenCL
OpenCL is a trademark of Apple Inc. used under license to the Khronos Group Inc.
Trademarks
NVIDIA, the NVIDIA logo, and cuBLAS, CUDA, cuDNN, DALI, DIGITS, DGX, DGX-1, DGX-2, DGX Station, DLProf, Jetson, Kepler, Maxwell, NCCL, Nsight Compute, Nsight Systems, NvCaffe, NVIDIA Ampere GPU Architecture, PerfWorks, Pascal, SDK Manager, Tegra, TensorRT, Triton Inference Server, Tesla, TF-TRT, and Volta are trademarks and/or registered trademarks of NVIDIA Corporation in the U.S. and other countries. Other company and product names may be trademarks of the respective companies with which they are associated.